FIL +24.54% (Directional Strategy Resonance)

A deal analysis using cluster analysis and delta: how market inefficiency formed the entry point, and a decline in buyer efficiency became a signal to take profits.
Table of contents

Coin: FIL/USDT
Risk: Medium
Level: Beginner
Entry Reasons
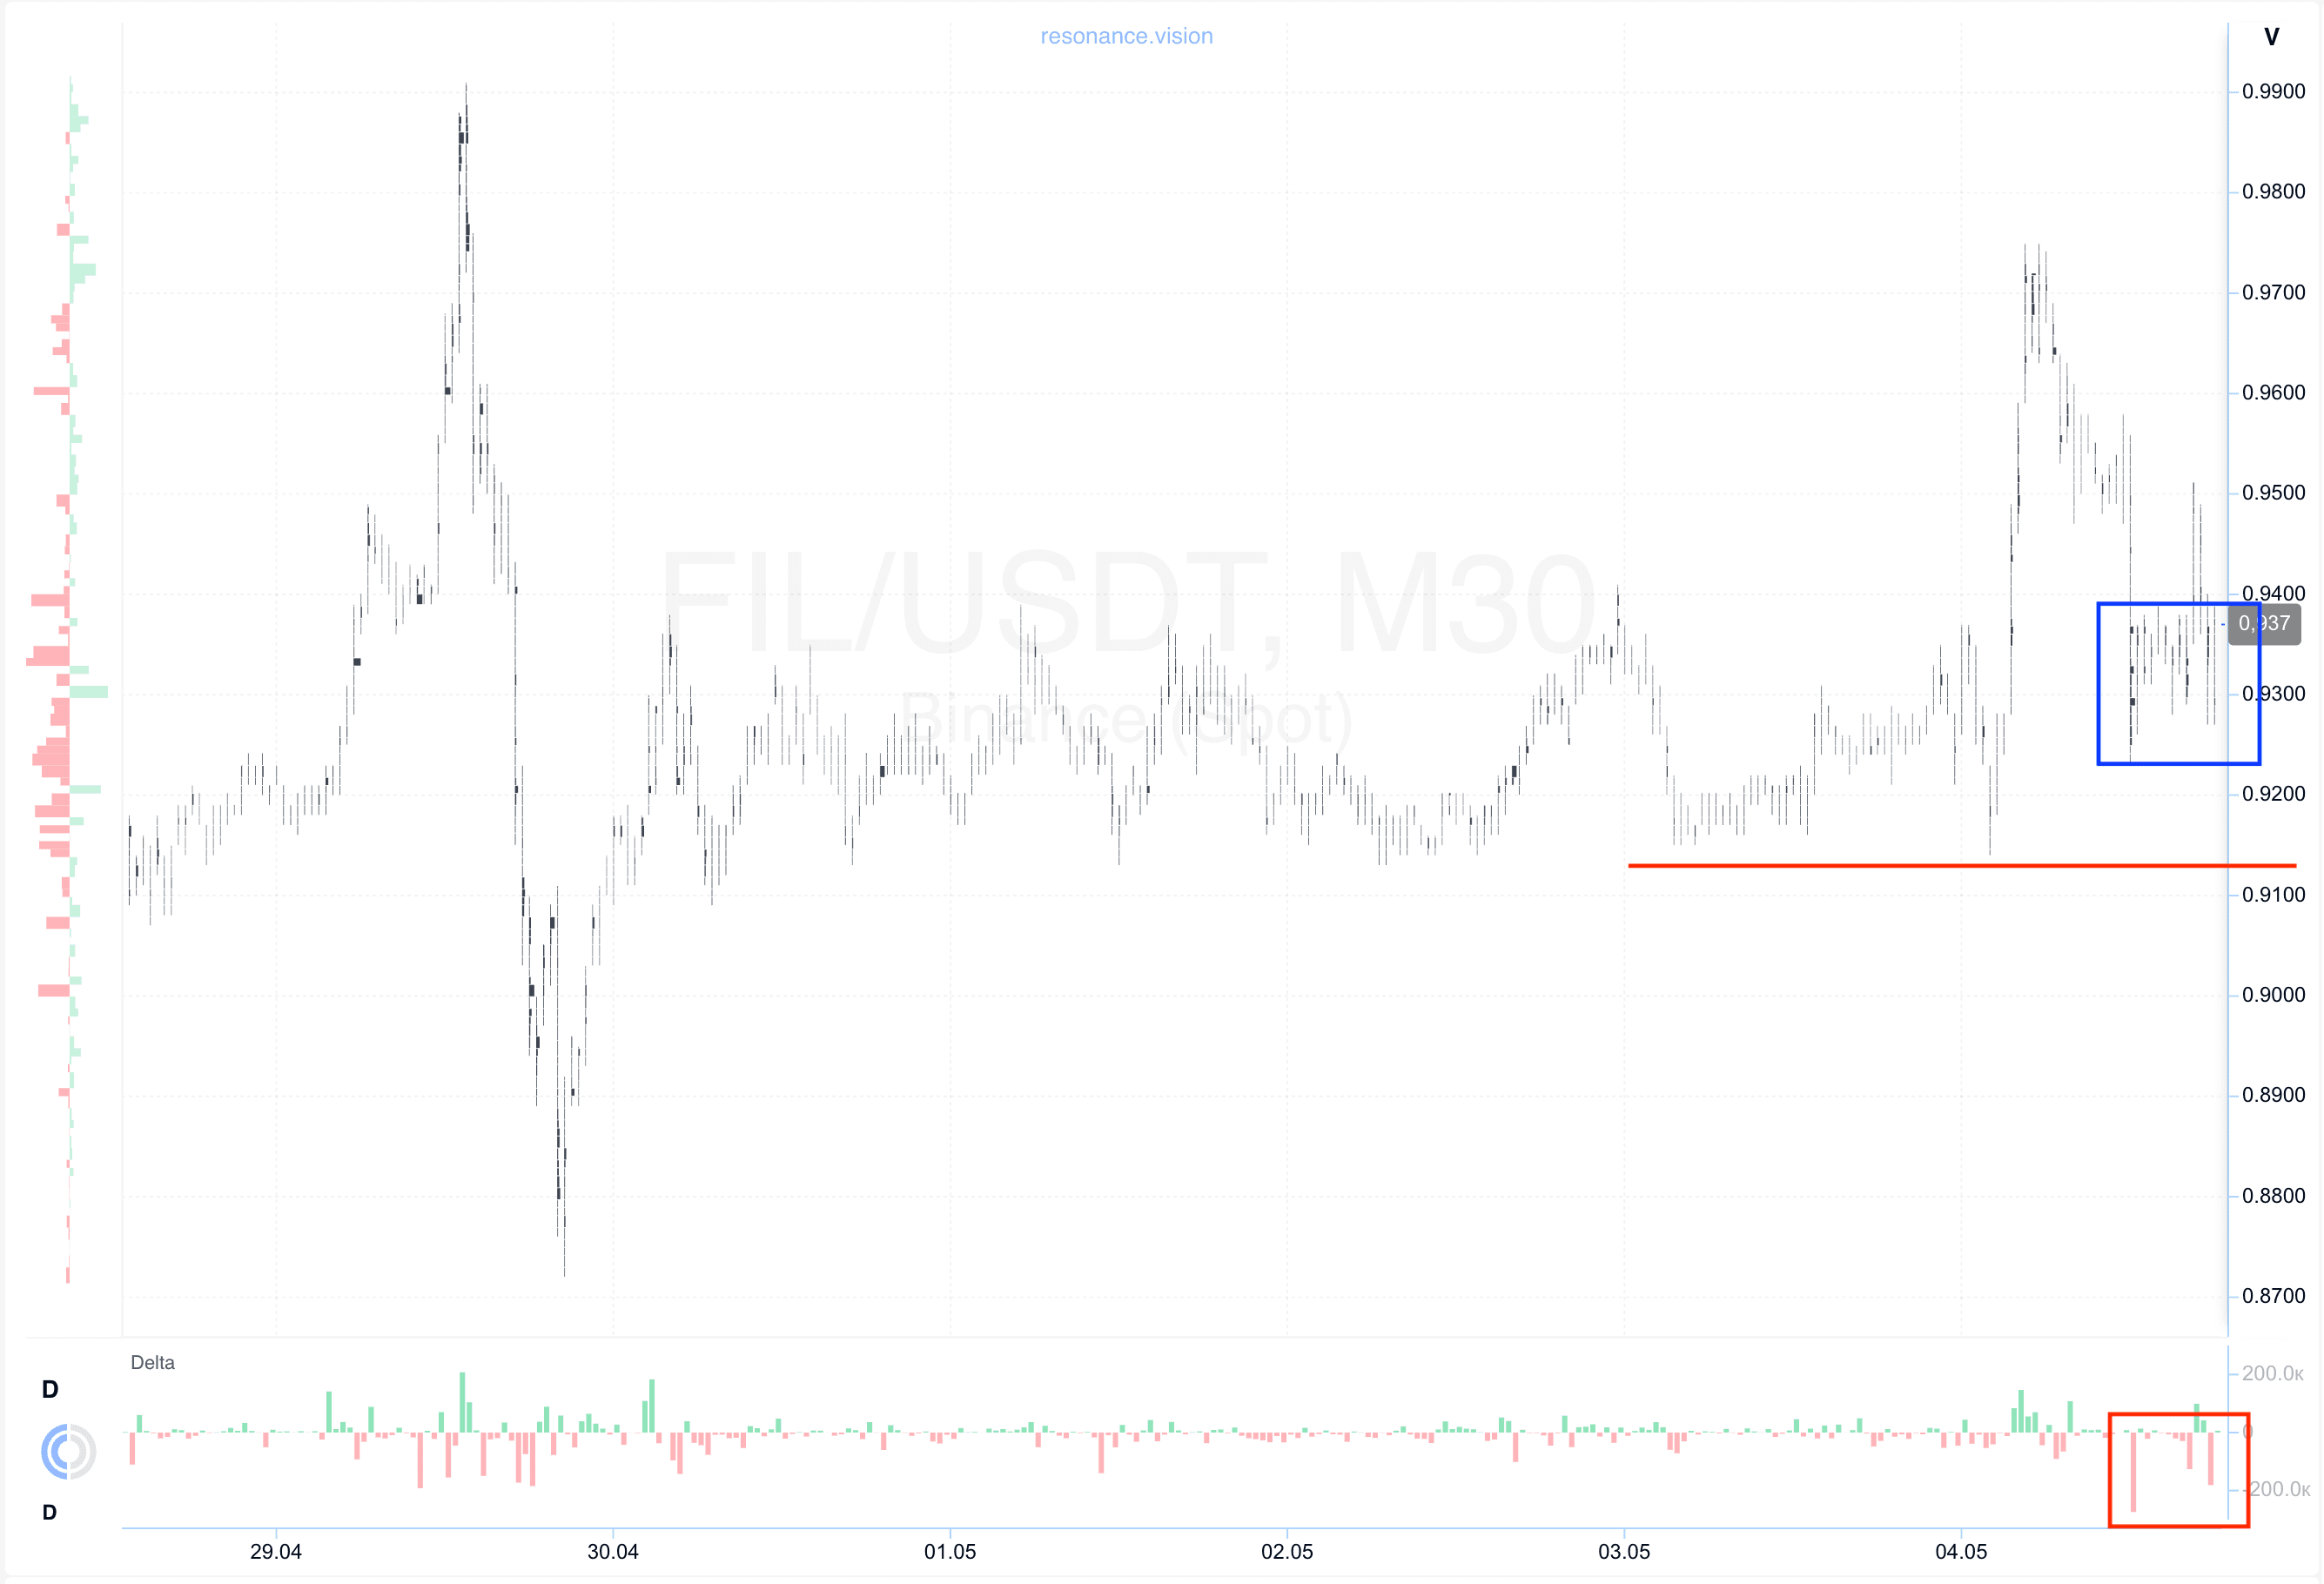
Cluster Chart: during the latest local decline, significant volume clusters began to form (blue rectangle), within which there was a pronounced dominance of market sell orders (red rectangle).
However, despite the significant selling volume, the price stopped reacting with a proportional decline and failed to update the local minimum (red line).
Such a reaction indicates the formation of signs of a local deficit and weakening seller initiative. When significant selling volumes no longer lead to further price decline, this often becomes a signal of a possible shift in initiative or the formation of a local reversal.
In the Dashboard
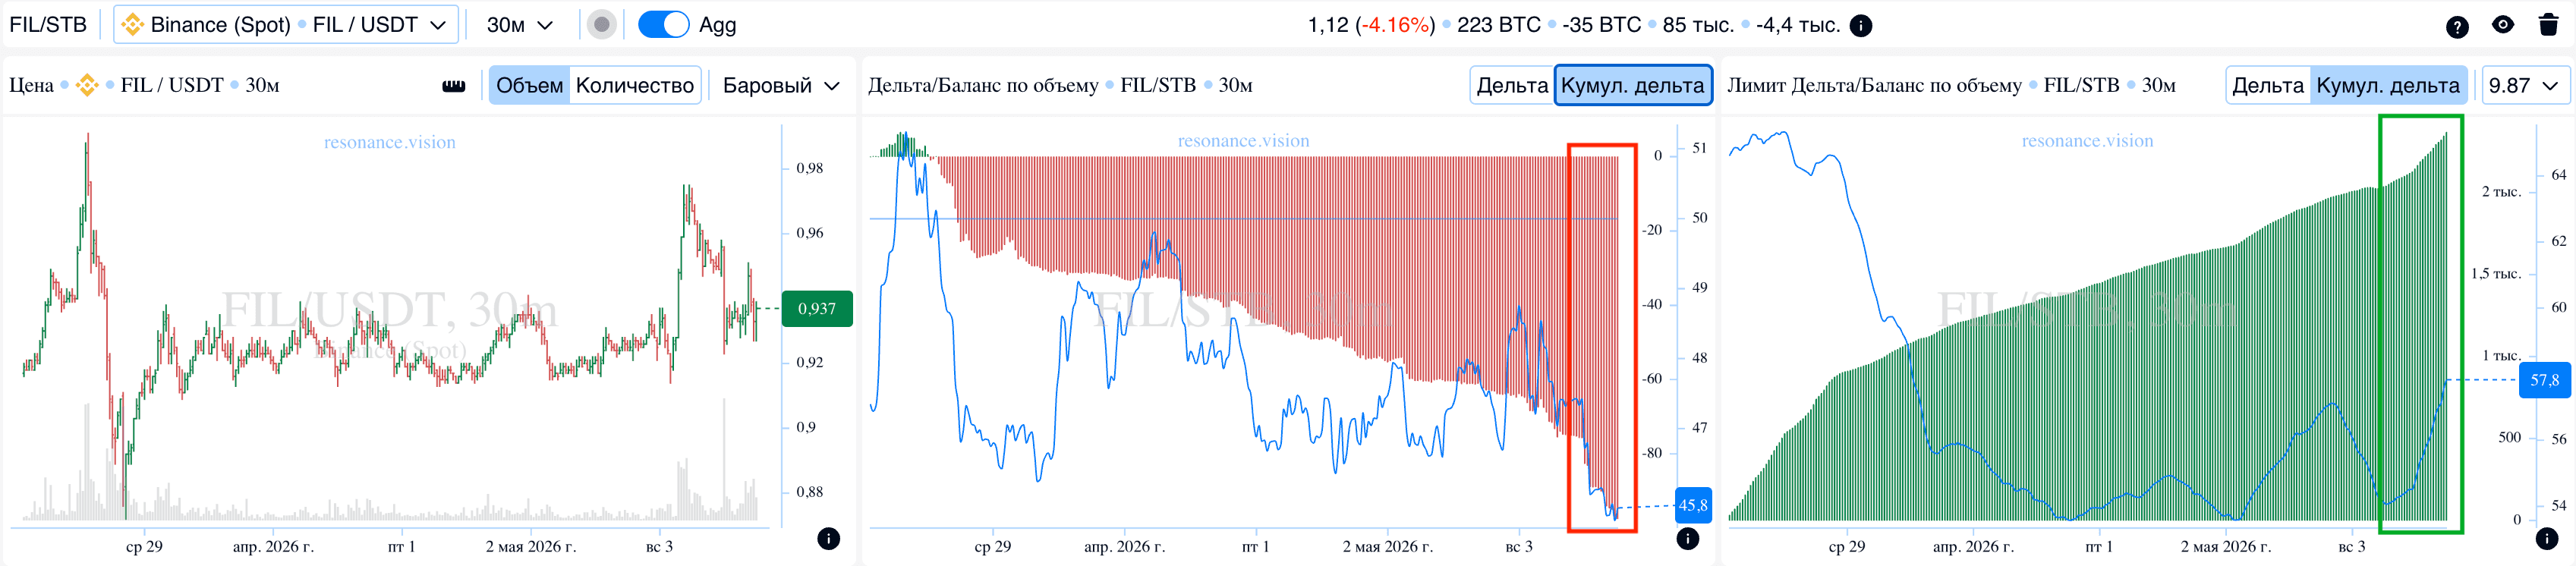
Delta / Volume Balance and Limit Delta: in aggregated form, data across all pairs and exchanges confirmed the observations from the cluster chart. During the observed period, there was a sustained increase in market selling pressure, which was clearly reflected in the cumulative delta histogram. At the same time, extreme selling values continued to increase (red rectangle).
Simultaneously, the limit delta showed a cumulative increase in limit buy orders, which became even more pronounced in the final stage of the movement (green rectangle).
Such a combination indicates active absorption of incoming market sell volume by limit buy orders. As a result, local support forms within the current range, further confirming signs of supply deficit and a shift in balance toward buyers.
Exit Reasons
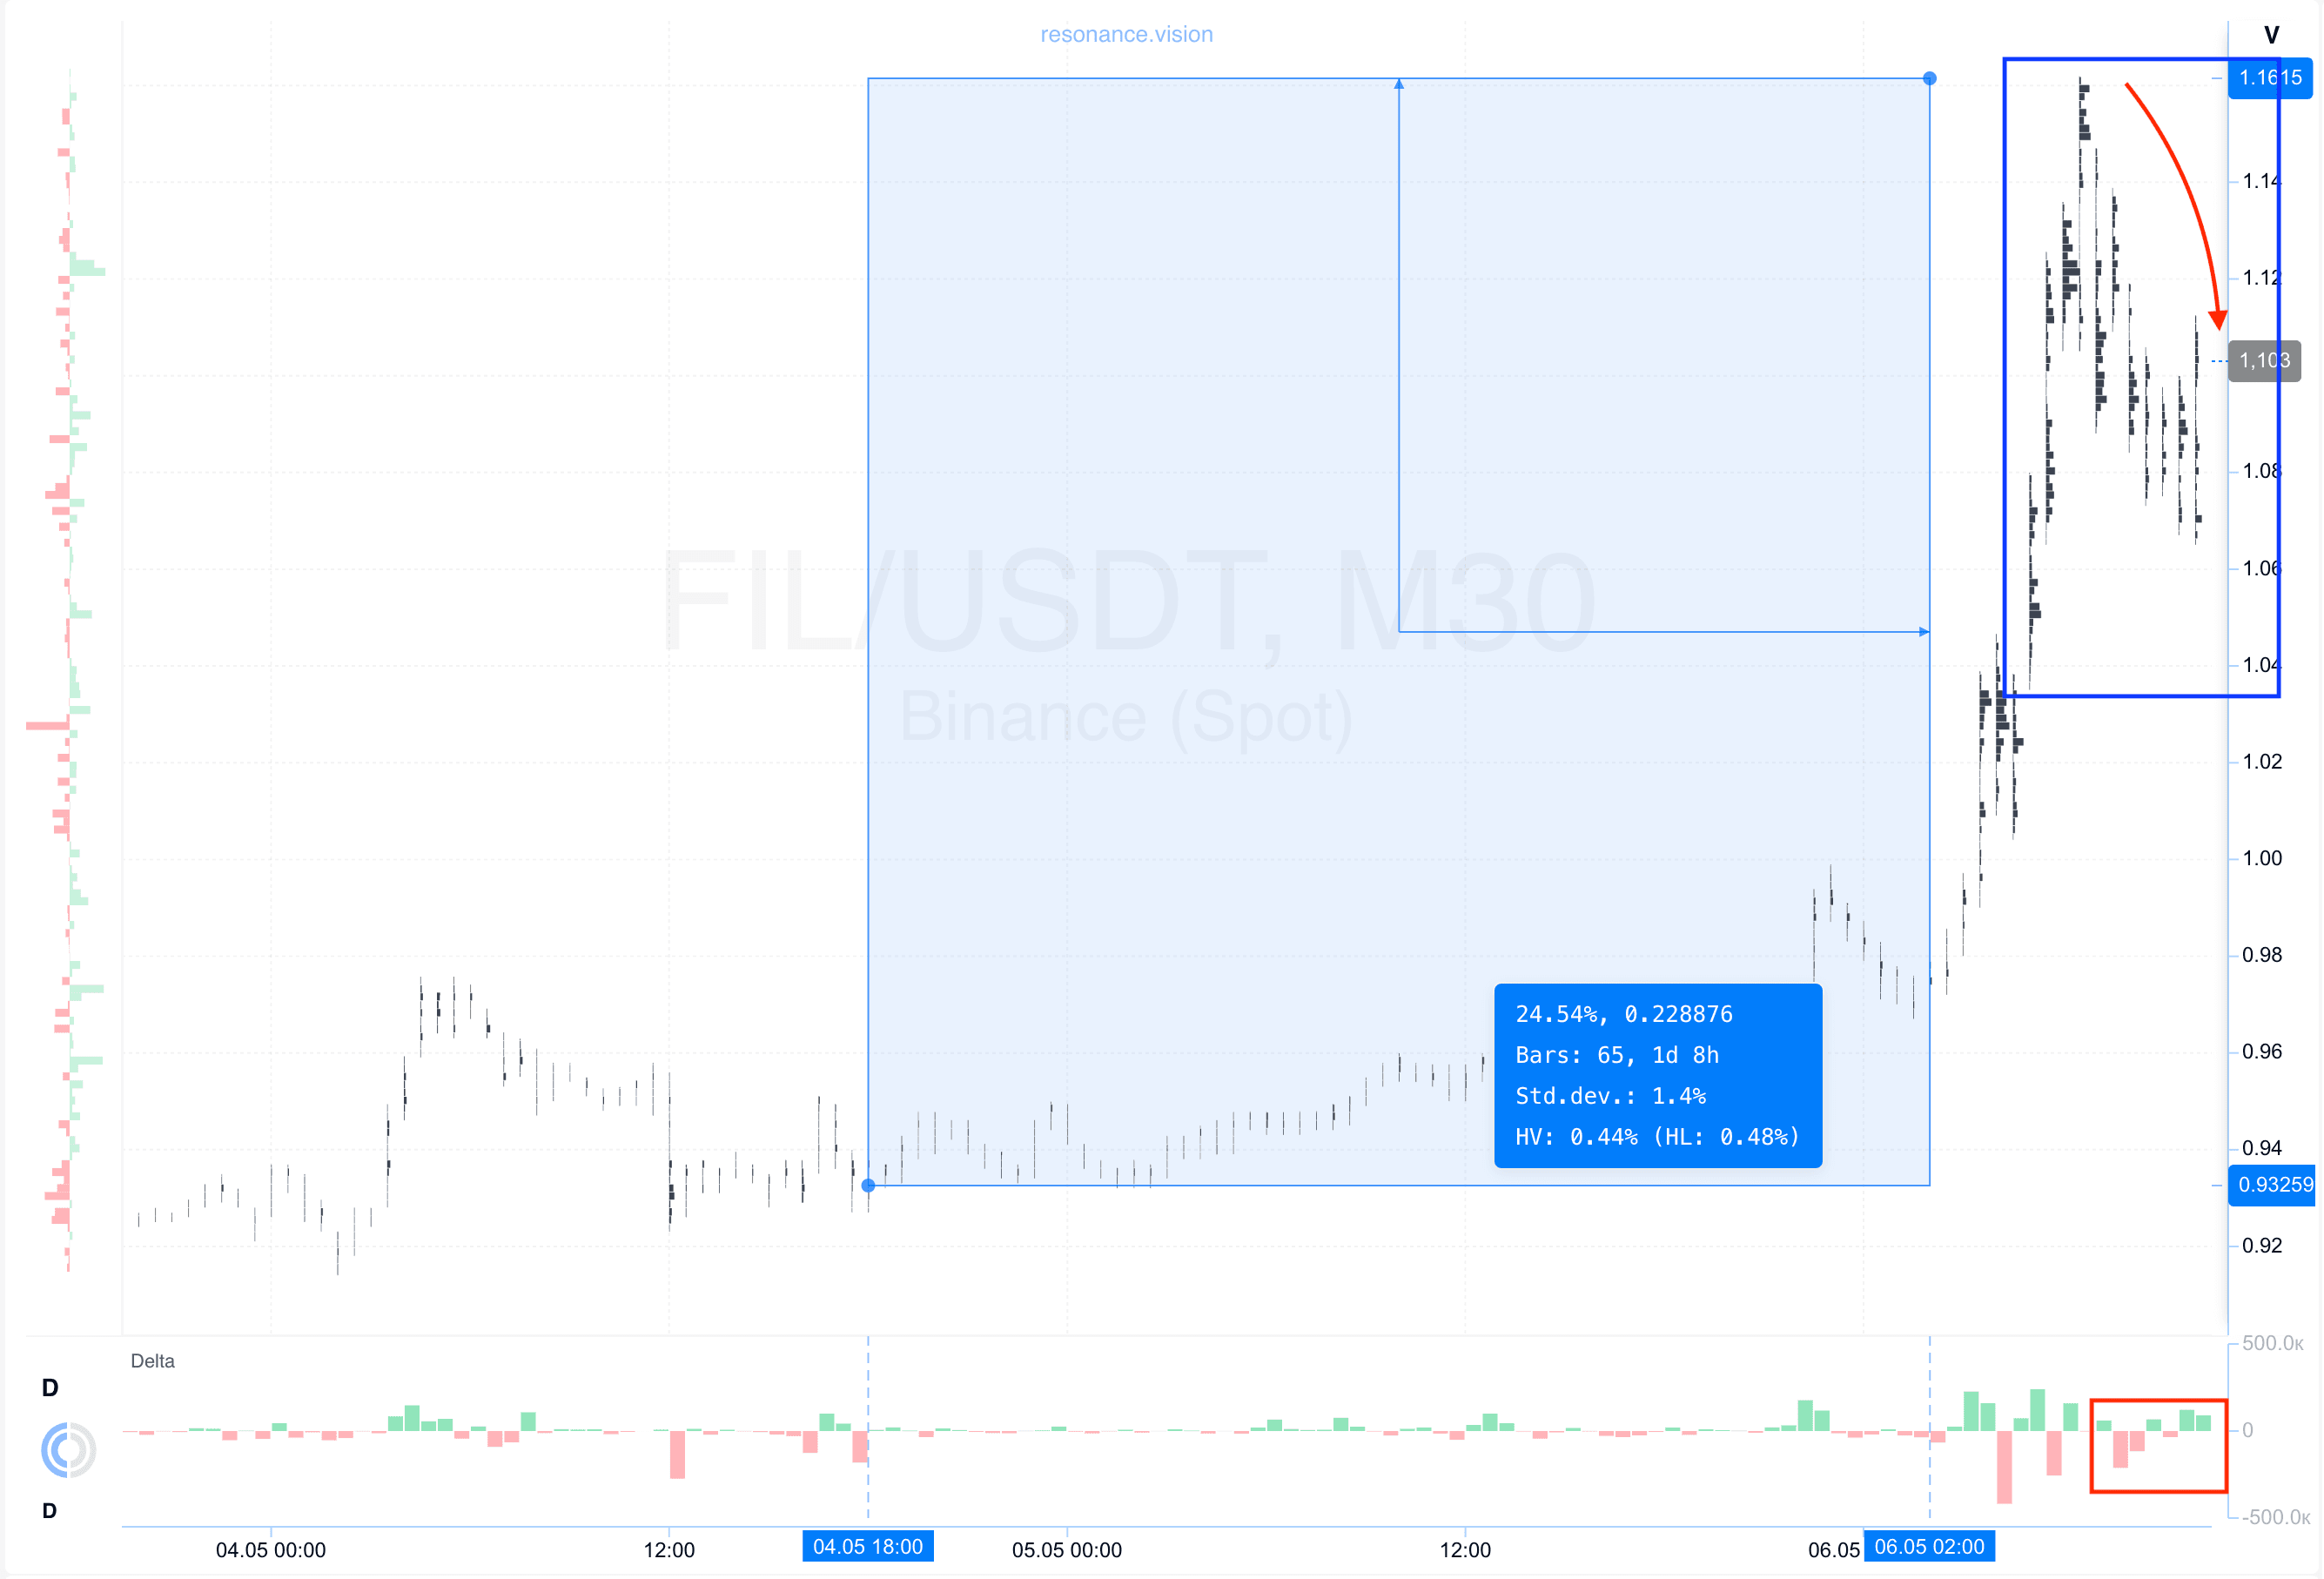
Cluster Chart: from the entry point, the price increased by nearly 25%, which is a strong move for this asset.
During the growth phase, both volume and volatility increased significantly (blue rectangle), and a notable pullback also formed. Within this pullback, dominant market sell orders began to appear, while market buys were still present but no longer had the same impact on price (red rectangle and arrow).
Such dynamics indicate decreasing buyer efficiency and signs of a developing surplus.
Under such conditions, further holding the position becomes accompanied by a noticeable increase in risk, making profit-taking a logical and justified decision.
Conclusion
This review clearly demonstrates that the key factor in market analysis is not simply the presence of volume, but its efficiency and impact on price.
At the entry stage, despite the sustained increase in market selling pressure, the price stopped reacting with further decline and failed to update the local minimum. This indicated weakening sellers and active absorption of their volume by limit buyers, which led to the formation of a local deficit and created conditions for upward movement.
Additional confirmation came from the dashboard data: the cumulative growth in market selling was accompanied by strengthening limit buy orders, indicating the formation of local support and a gradual shift in balance toward buyers.
Thus, the entry was based on signs of seller inefficiency and the formation of a deficit, while the exit was based on decreasing buyer efficiency and growing risks of further holding the position. Such an approach allows for more informed decision-making by relying on the interaction between volume and price, rather than only the direction of market movement.
Follow new insights in our telegram channel.
No need to invent complex schemes and look for the "grail". Use the Resonance platform tools.
Register via the link — get a bonus and start earning:
OKX | BingX | KuCoin.
Promo code TOPBLOG gives you a 10% discount on any Resonance tariff plan.
Recommended articles


