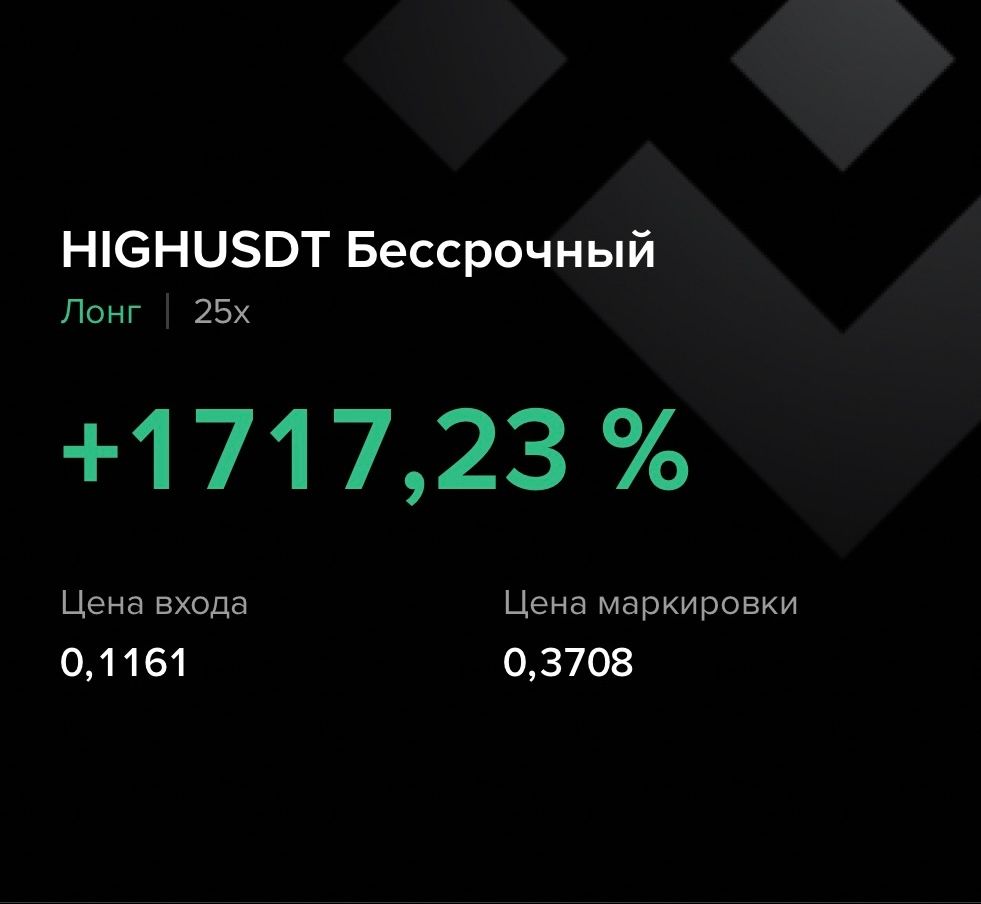
HIGH +1717.23% (Directional Strategy Resonance)

A deal analysis through volume and efficiency: how market inefficiencies shaped the entry point, while reduced buyer influence allowed for profit-making.
Table of contents

Coin: HIGH/USDT
Risk: medium
Level of understanding: beginner
Entry Reasons
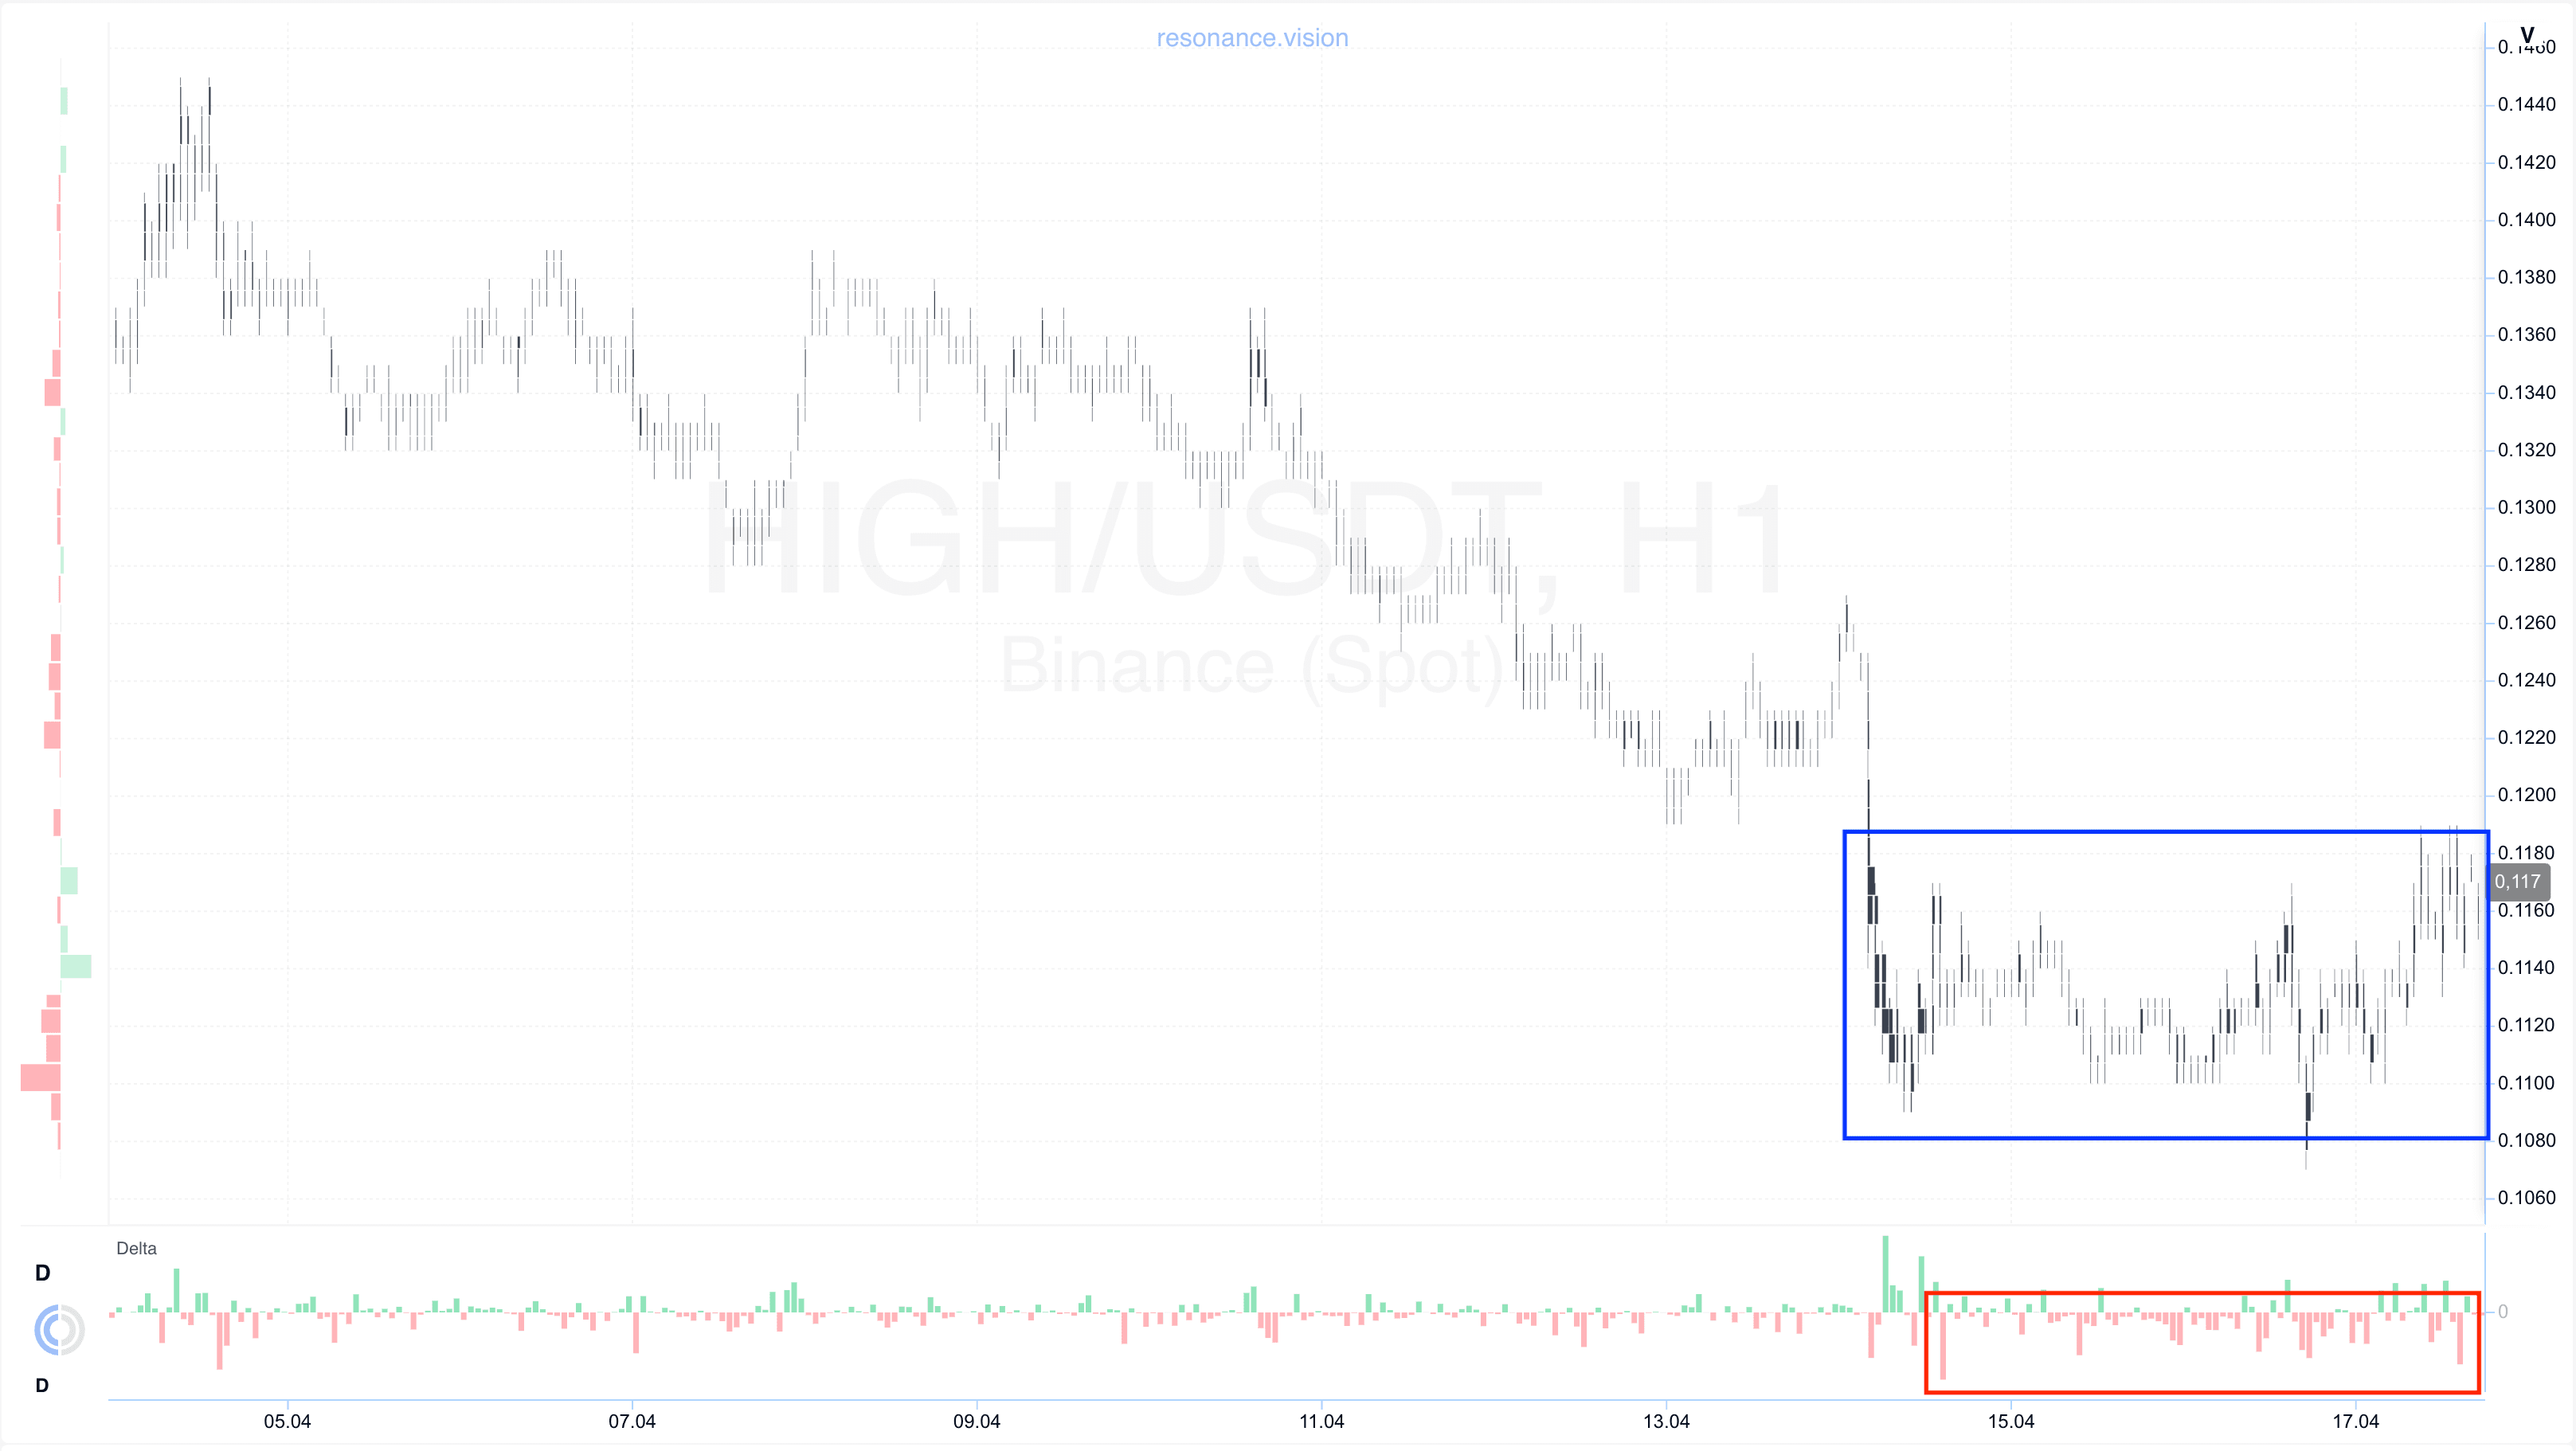
Cluster chart: during the local decline, significant volume clusters began to form (blue rectangle), within which a pronounced dominance of market sell orders was observed (red rectangle).
However, despite the large volume of selling, the price stopped reacting with a corresponding decline and stabilized within a range.
Such a reaction indicates the formation of signs of a local deficit and weakening of sellers’ initiative. When significant volumes of selling no longer lead to further price decline, this often becomes a signal of a potential shift in initiative and the formation of a local reversal.
In the Dashboard
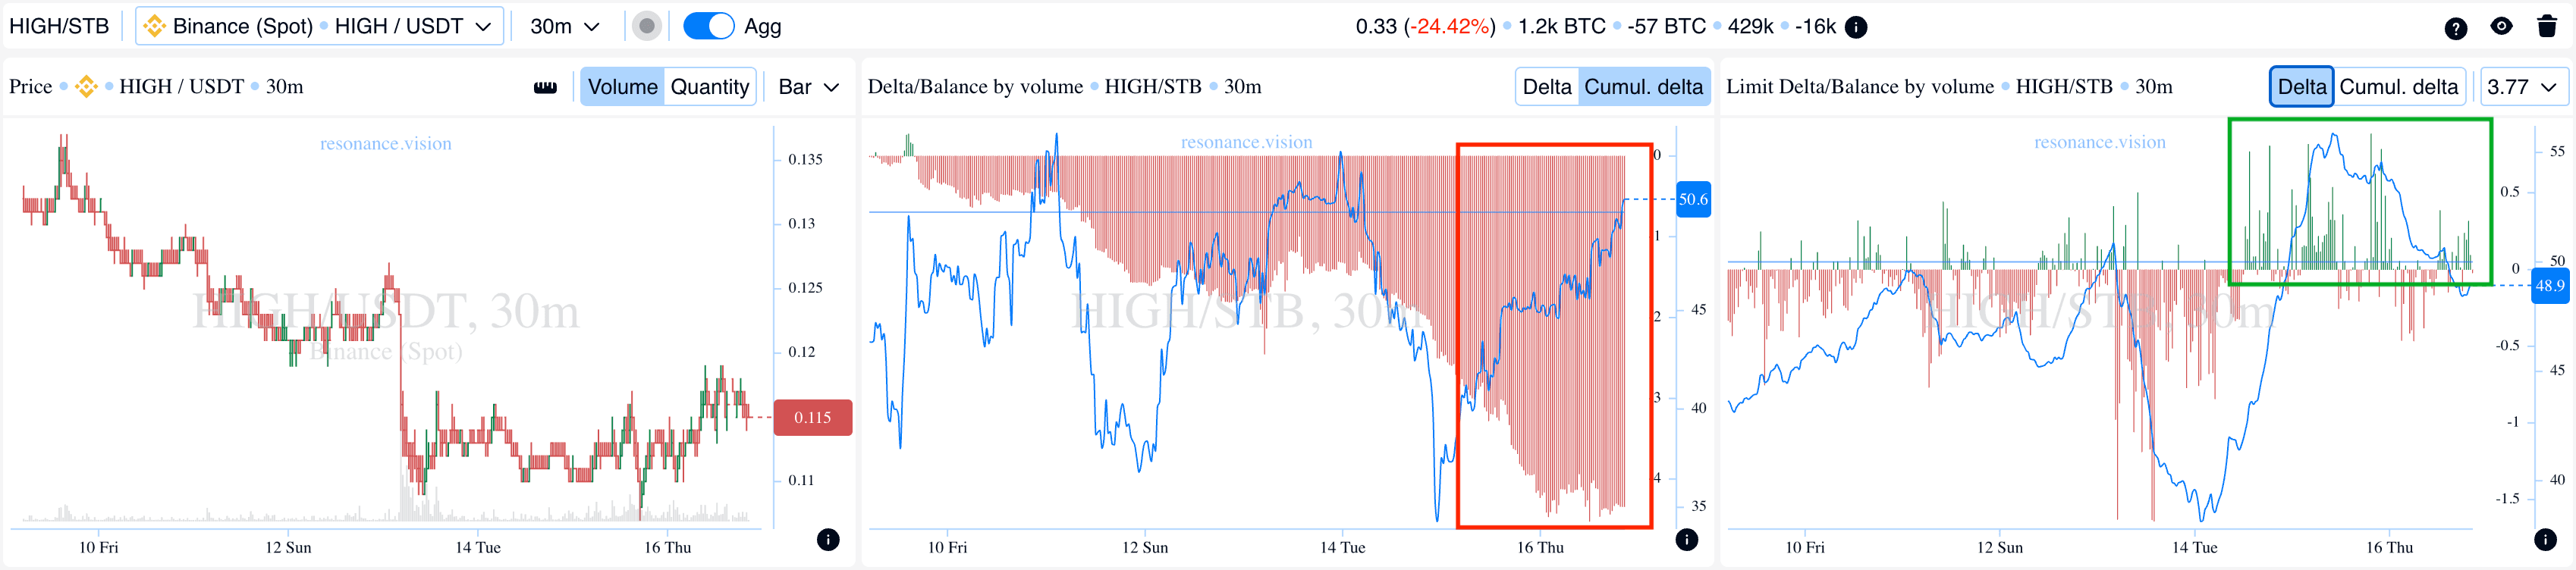
Delta / Volume Balance and Limit Delta: in aggregated form, data across all pairs and exchanges confirms the observations from the cluster chart. During the analyzed period, sustained pressure from market sell orders was recorded, clearly reflected in the cumulative delta histogram. At the same time, extreme selling values continued to accumulate (red rectangle).
At the same time, bursts of limit buy orders were observed near the current price range in the limit delta (green rectangle).
This combination indicates active absorption of incoming market sell volume by limit buy orders. As a result, local support is formed in the current range, which further confirms signs of a supply deficit and a shift in balance toward buyers.
Exit Reasons
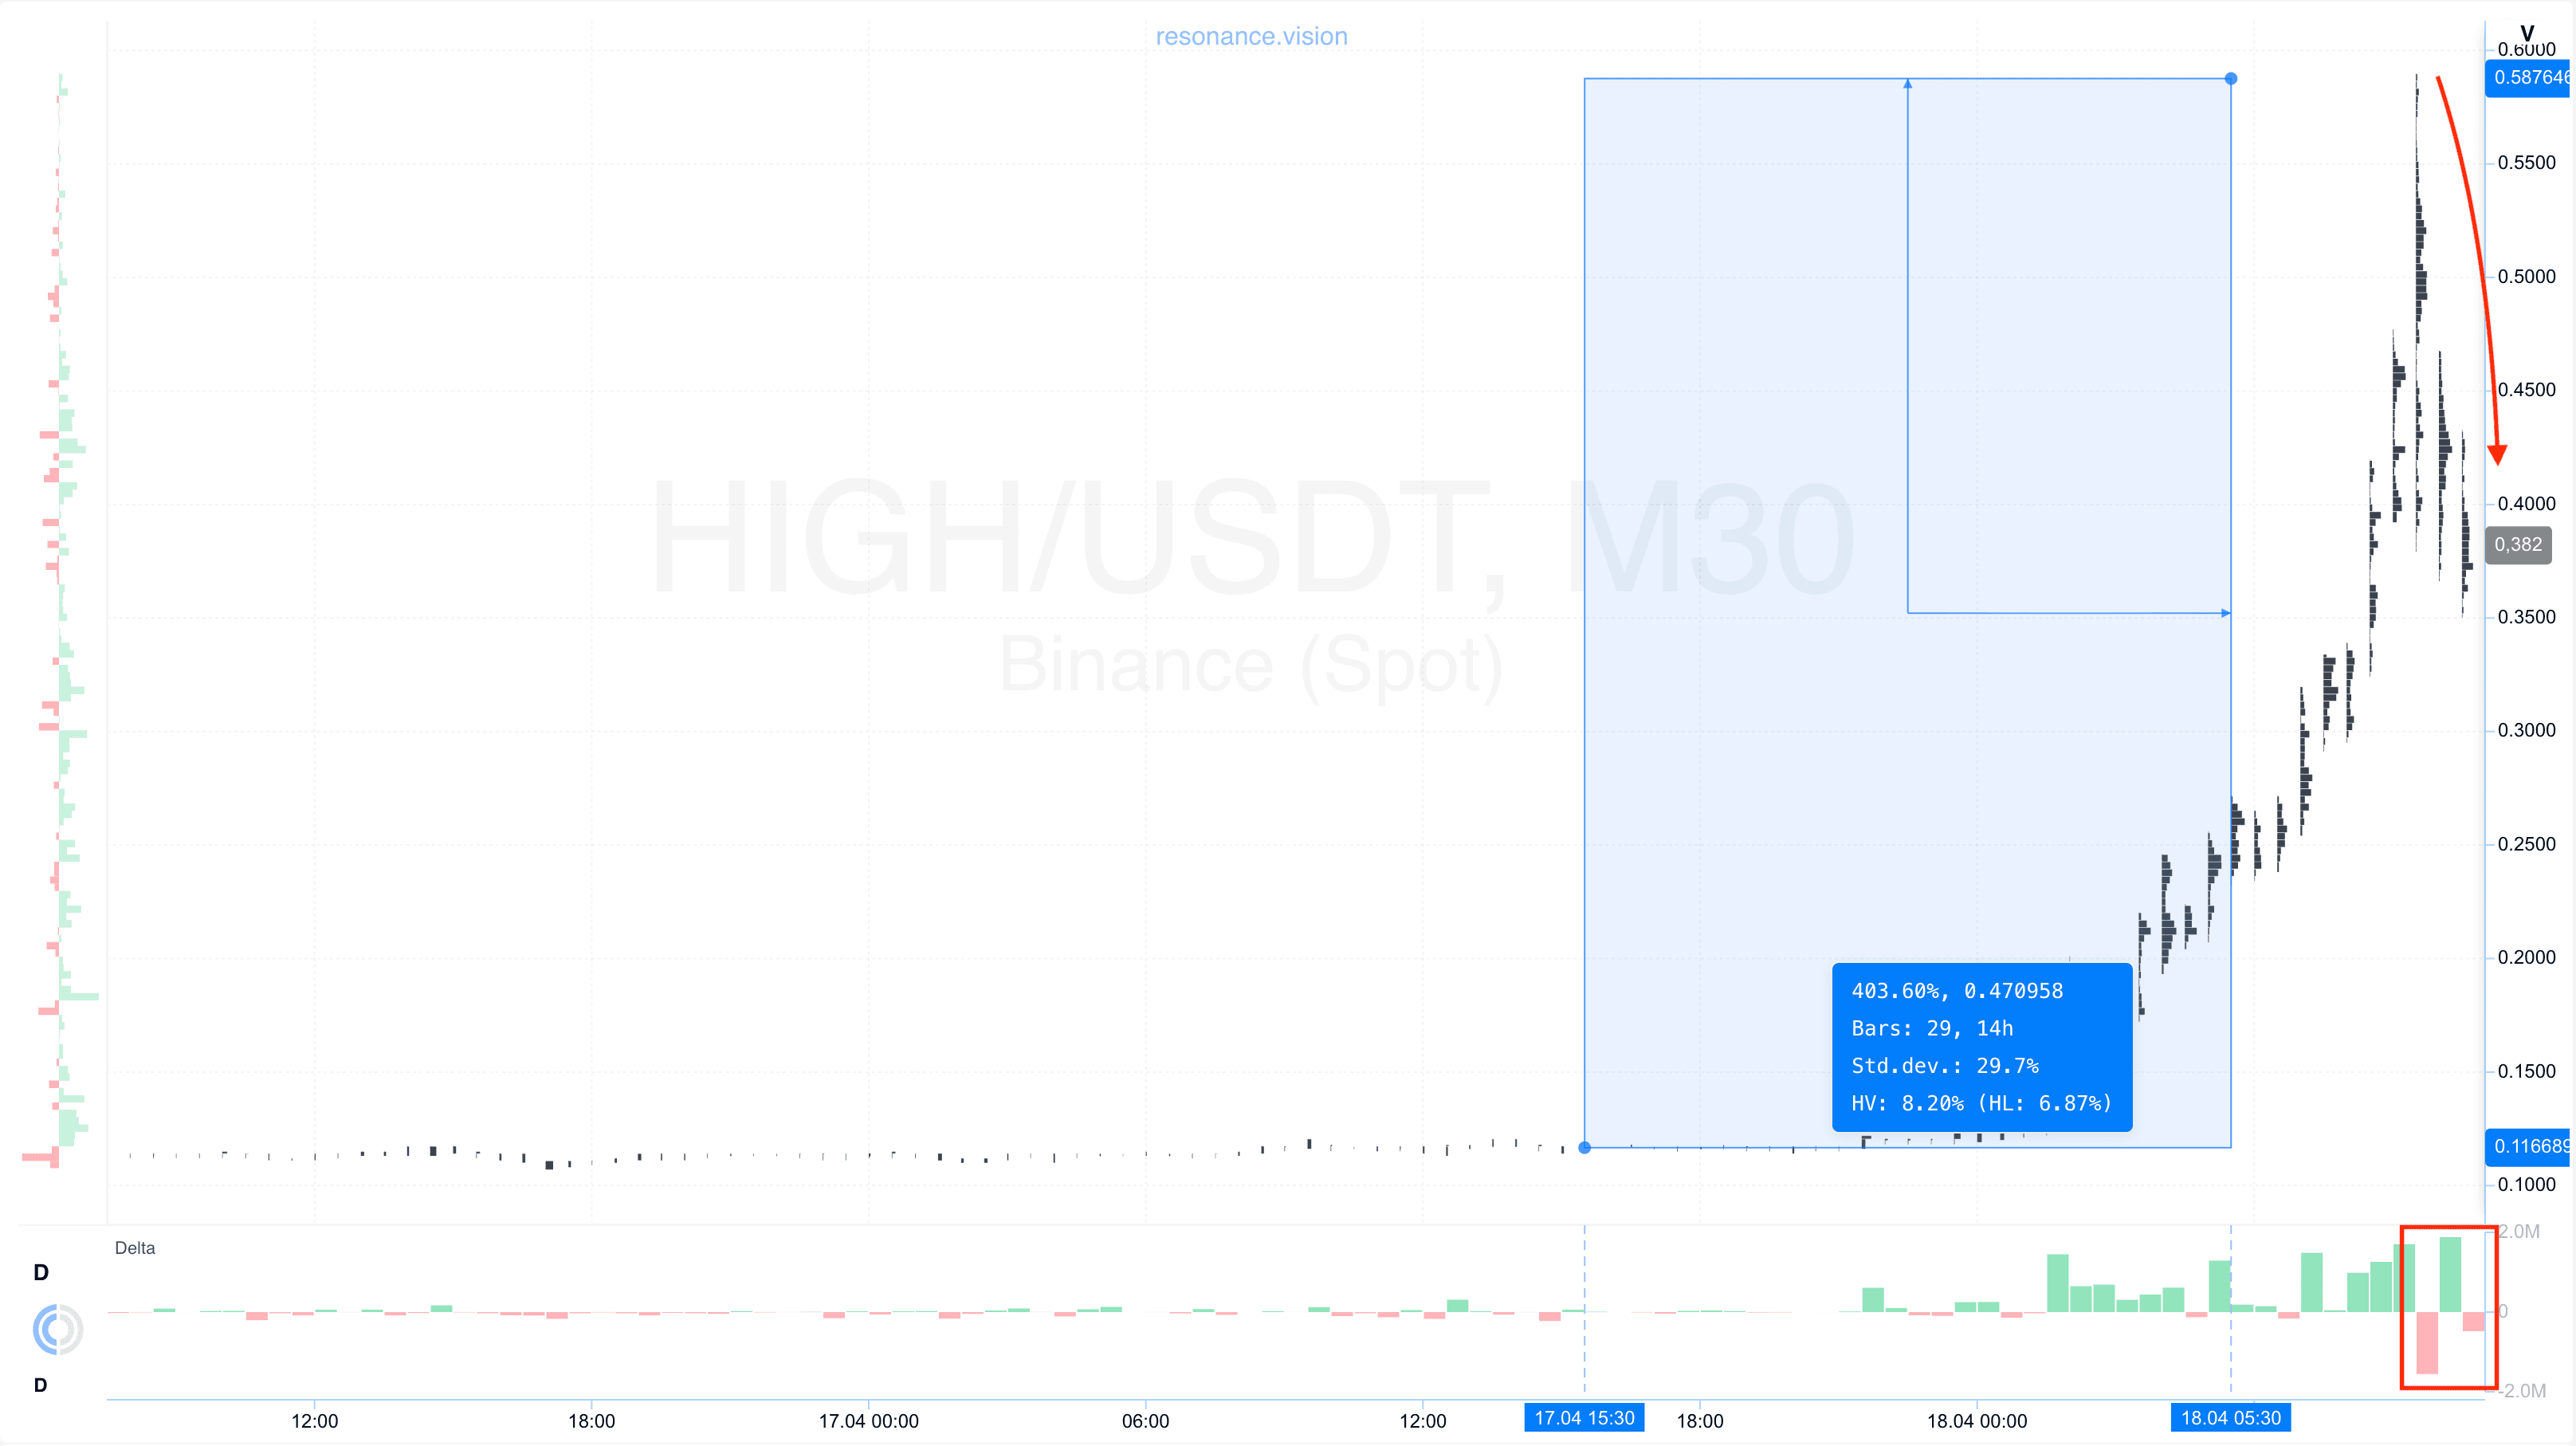
Cluster chart: from the entry point, the price moved more than 400%, which is an extremely strong move for the asset.
During the growth, volatility increased significantly, and a notable pullback was formed. In this pullback, dominant market sell orders began to appear, while market buy orders were still present but no longer had the same impact on price (red rectangle and arrow).
Such dynamics indicate a decrease in buyer efficiency and signs of surplus formation.
In these conditions, further holding of the position is accompanied by a significant increase in risk, making profit-taking a logical and justified decision.
Result
In this trade, a profit of +1717.23% was secured, corresponding to a risk/reward ratio of 1:27.
Conclusion
This analysis clearly demonstrates that the key factor in market evaluation is not just volume itself, but its efficiency and real impact on price.
At the entry stage, despite sustained pressure from market sellers, the price stopped reacting with further decline. This indicated weakening of sellers and active absorption of their volume by limit buy orders, which led to the formation of a local deficit and created the prerequisites for further upward movement.
After the entry, the market delivered an extremely strong impulse. However, as the move developed, signs of a structural shift began to appear: increased volatility, formation of pullbacks, and decreasing efficiency of buyers. Buyers were still present in the market but could no longer exert the same influence on price, indicating the formation of a surplus.
Thus, the entry was based on signs of seller inefficiency and the formation of a deficit, while the exit was based on decreasing buyer efficiency and a shift in balance toward sellers. This approach allows not only to find strong entry points but also to lock in profits in a timely manner, based on objective changes in supply and demand structure.
Follow new insights in our telegram channel.
No need to invent complex schemes and look for the "grail". Use the Resonance platform tools.
Register via the link — get a bonus and start earning:
OKX | BingX | KuCoin.
Promo code TOPBLOG gives you a 10% discount on any Resonance tariff plan.
Recommended articles


