HUMA +26.5% (Resonance Directional Strategy)

A volume-based analysis of the deal: how market inefficiency provided an entry point, and a decline in buyer efficiency became a signal to take profits.
Table of contents

Coin: HUMA/USDT
Risk: high
Level of understanding: beginner
Entry Reasons
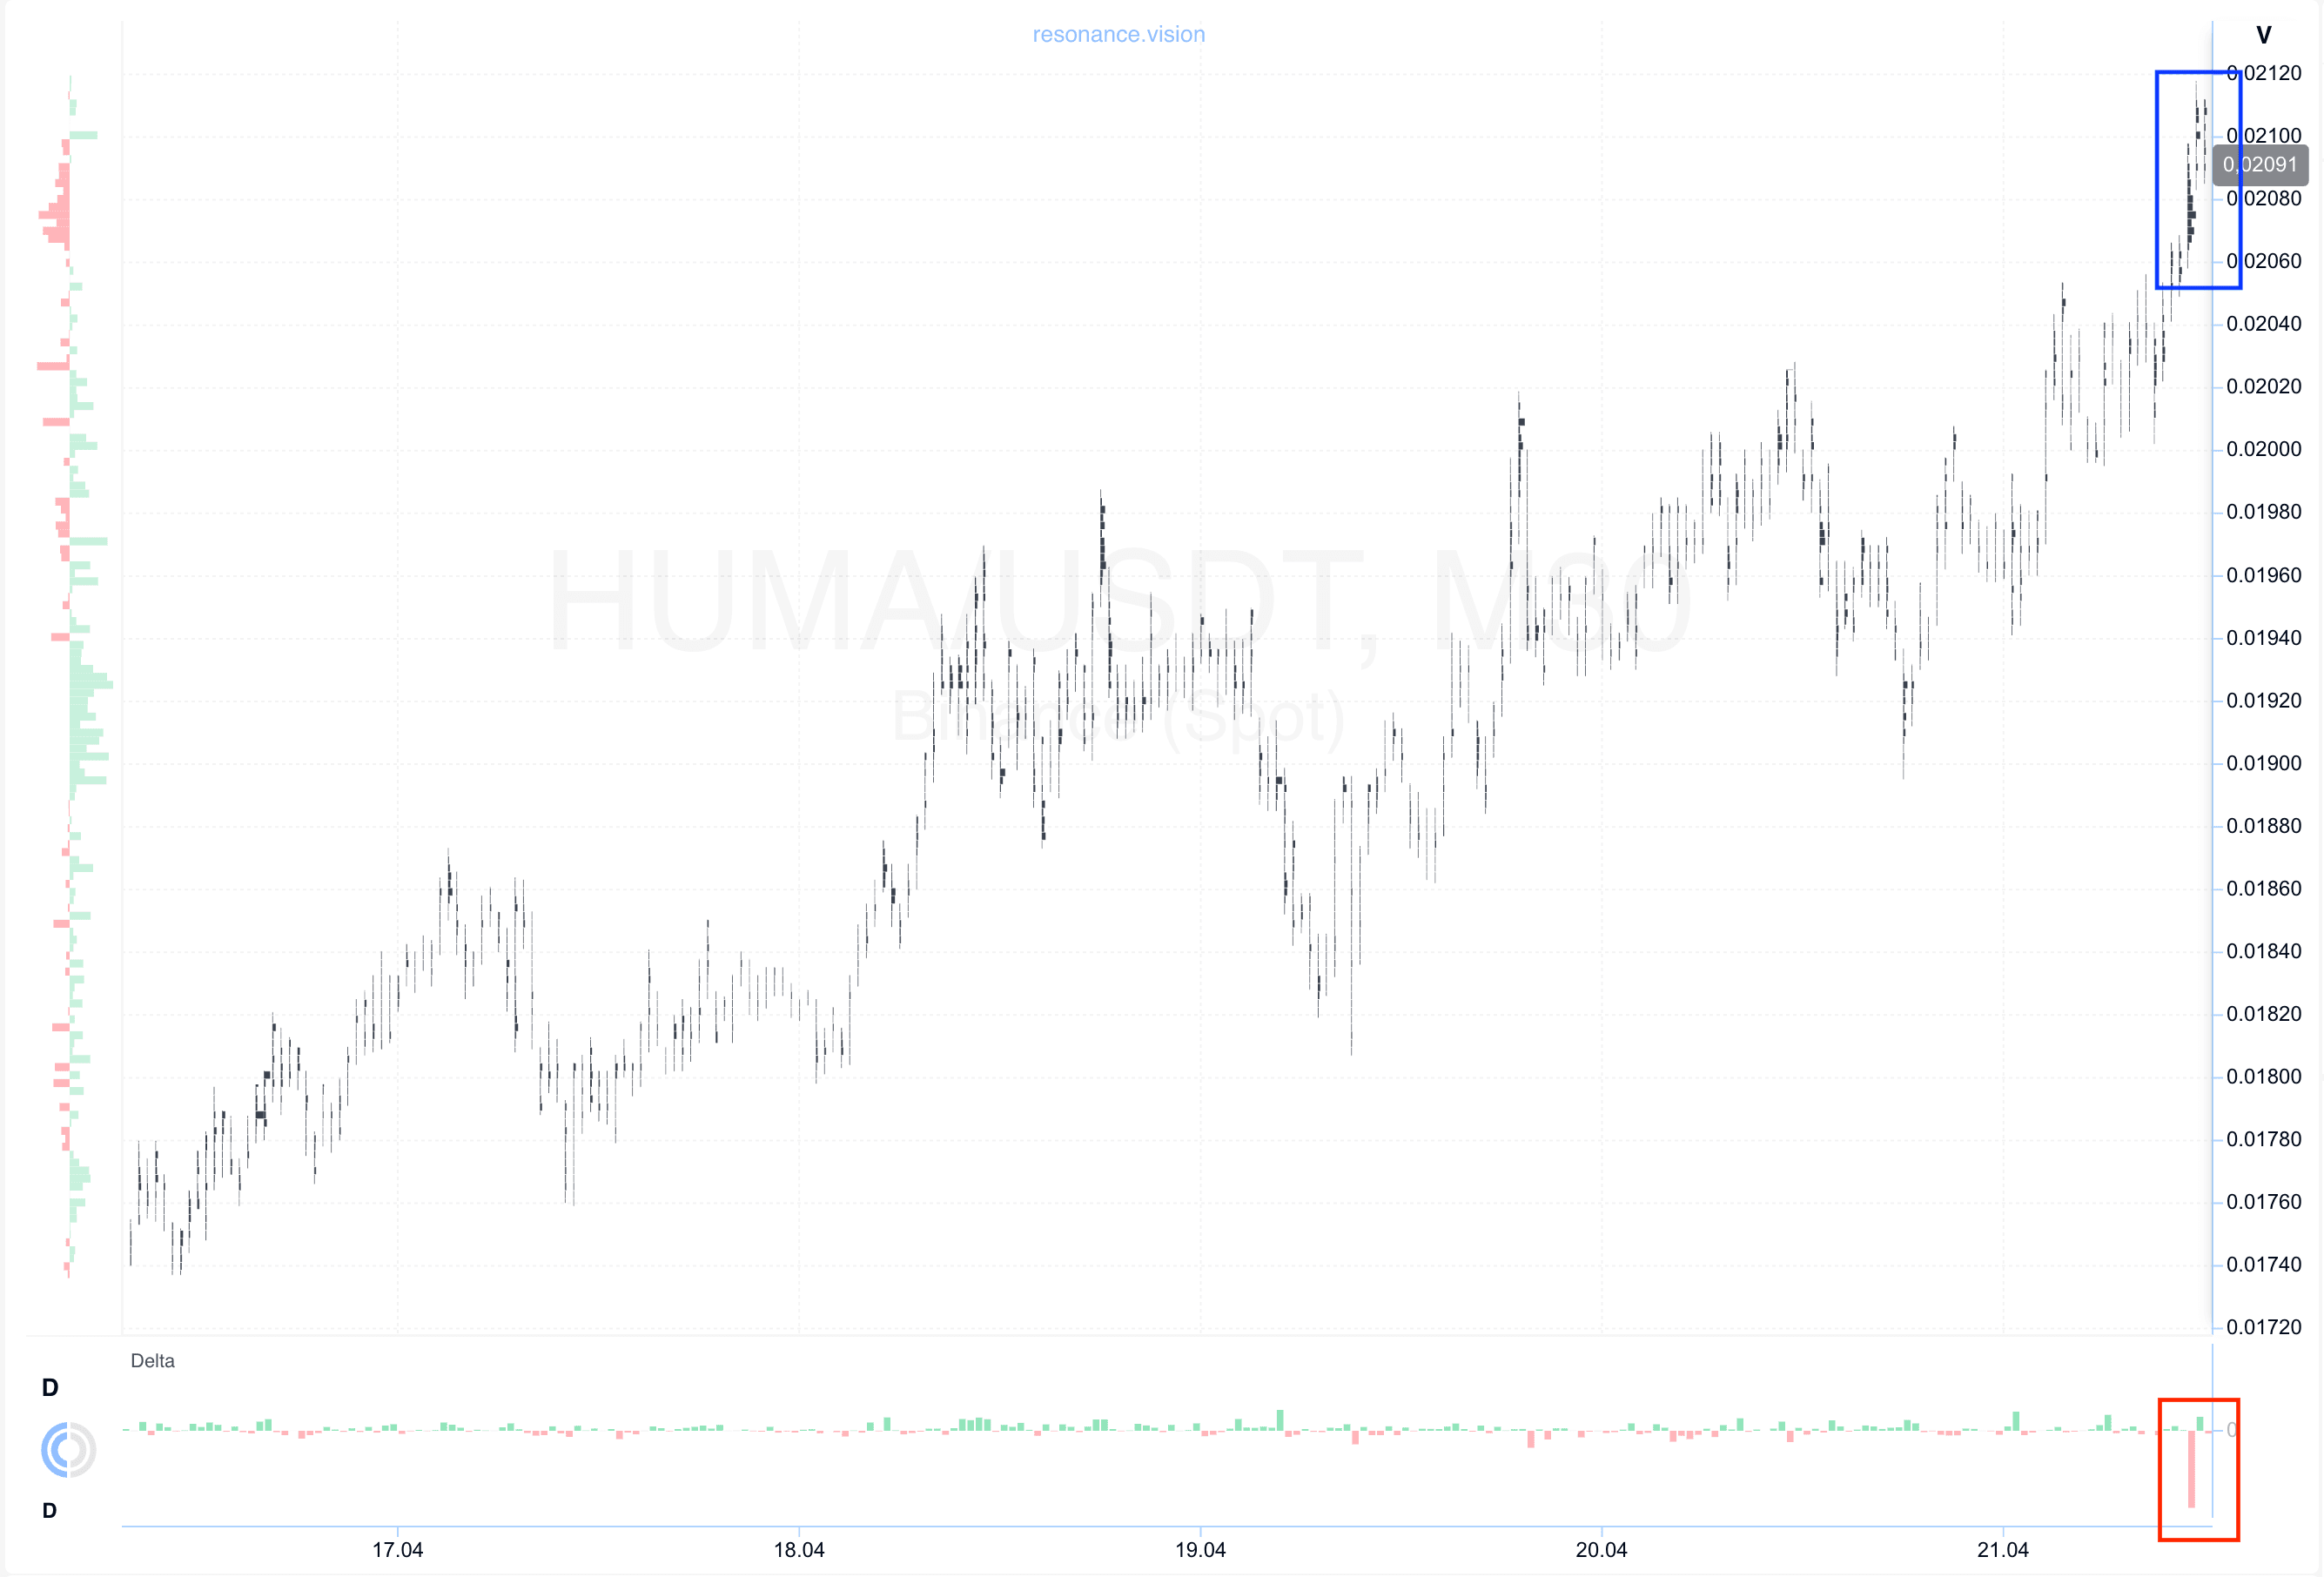
Cluster chart: during the local upward movement, significant volume clusters were formed (blue rectangle), within which a pronounced dominance of market sell orders was observed (red rectangle).
However, despite the dominance of selling, the price did not show any decline and remained within a range.
Such a reaction indicates the formation of signs of a local deficit: the market stops declining even under dominant selling, which indicates the weakness of market sellers and a possible shift in balance toward buyers.
In the Dashboard
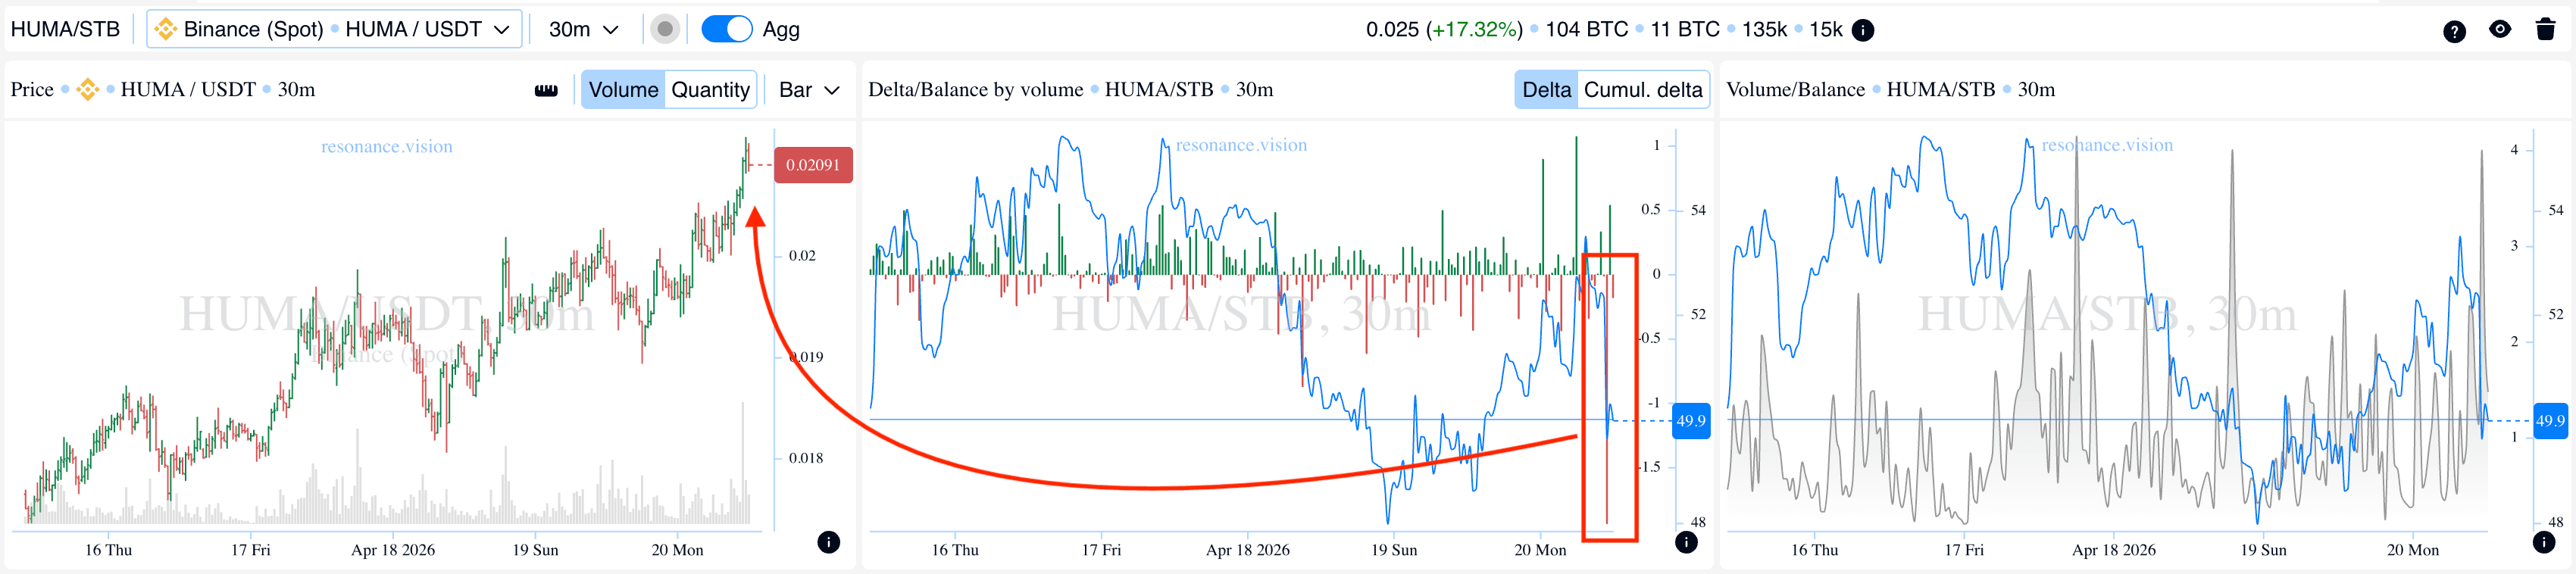
Delta / Volume Balance: in aggregated form, data across all pairs and exchanges confirms the observations from the cluster chart. During the analyzed period, volumes of market selling increased, however, the price did not show a corresponding reaction (red rectangles and arrow).
Such a structure indicates active absorption of incoming market sell volume by limit buy orders. As a result, local support is formed in the current range, which further confirms the weakening of selling pressure.
Exit Reasons
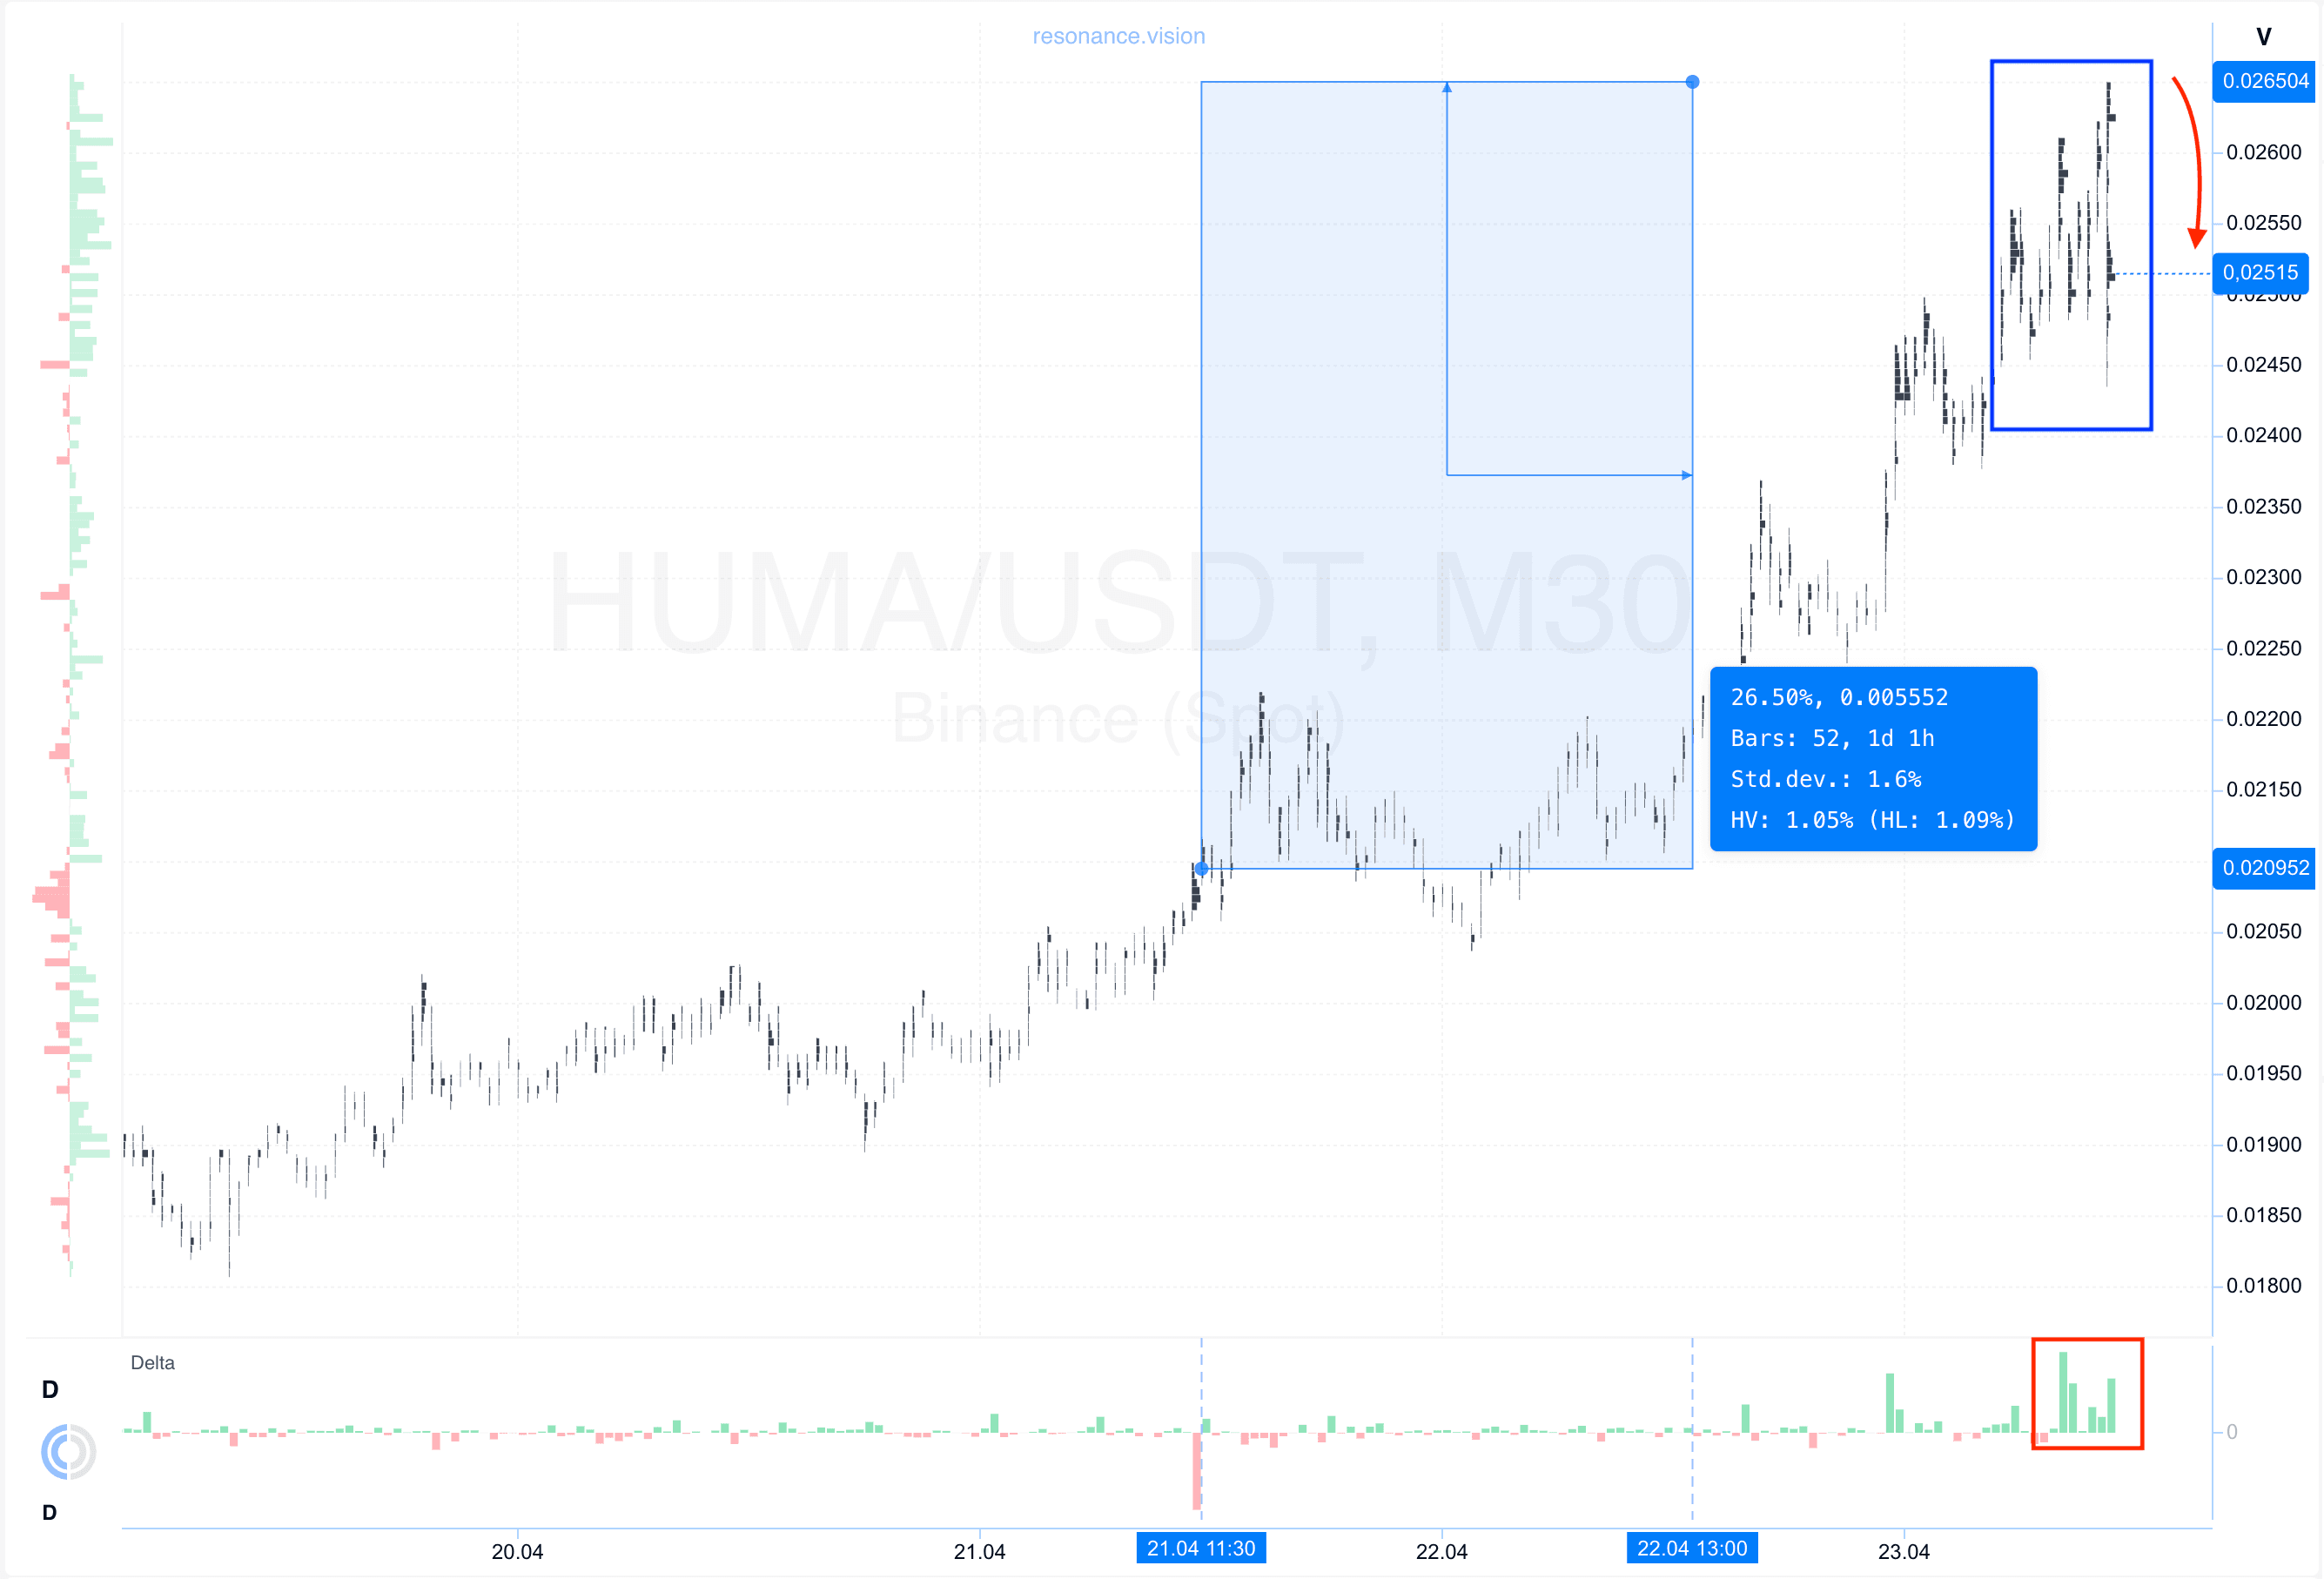
Cluster chart: after the entry point, the price increased by more than 25%, forming a solid move. During the growth, new volume clusters began to form, and volatility increased (blue rectangle).
At the same time, despite the continued dominance of market buy orders, the price stopped showing further growth (red rectangle and arrow).
Such a reaction indicates the formation of signs of a local surplus: buyers remain present in the market, but their impact on price is decreasing.
Under these conditions, further holding of the position is accompanied by increasing risk. Therefore, taking profits in this zone appears to be the most rational and balanced decision from a position management perspective.
Conclusion
This analysis shows that the key factor in market evaluation is not the volume itself, but its efficiency and impact on price.
At the entry stage, despite the dominance of market selling, the price did not show a corresponding decline. This indicated weakening of sellers and active absorption of their volume by limit participants, which led to the formation of a local deficit and created the prerequisites for further growth.
After the entry, the market delivered a move, however, as it developed, signs of structural change began to appear: market buying persisted, but its impact on price was decreasing. This indicated the formation of a local surplus and a transition of the market into a balance phase.
Such an approach allows decisions to be made not only based on price direction, but through understanding the current balance of supply and demand, which significantly improves the quality of trading decisions over time.
Follow new insights in our telegram channel.
No need to invent complex schemes and look for the "grail". Use the Resonance platform tools.
Register via the link — get a bonus and start earning:
OKX | BingX | KuCoin.
Promo code TOPBLOG gives you a 10% discount on any Resonance tariff plan.
Recommended articles


