MEGA +30.44% (Directional Strategy Resonance)

Analyzing the trade using cluster analysis, delta, and limit delta. We demonstrate how signs of local shortages and ineffective market selling helped determine the entry point, while an increase in volatility after a move of more than 30% signaled profit-taking.
Table of contents

Coin: MEGA/USDT
Risk: Medium
Knowledge Level: Beginner
Entry Reasons
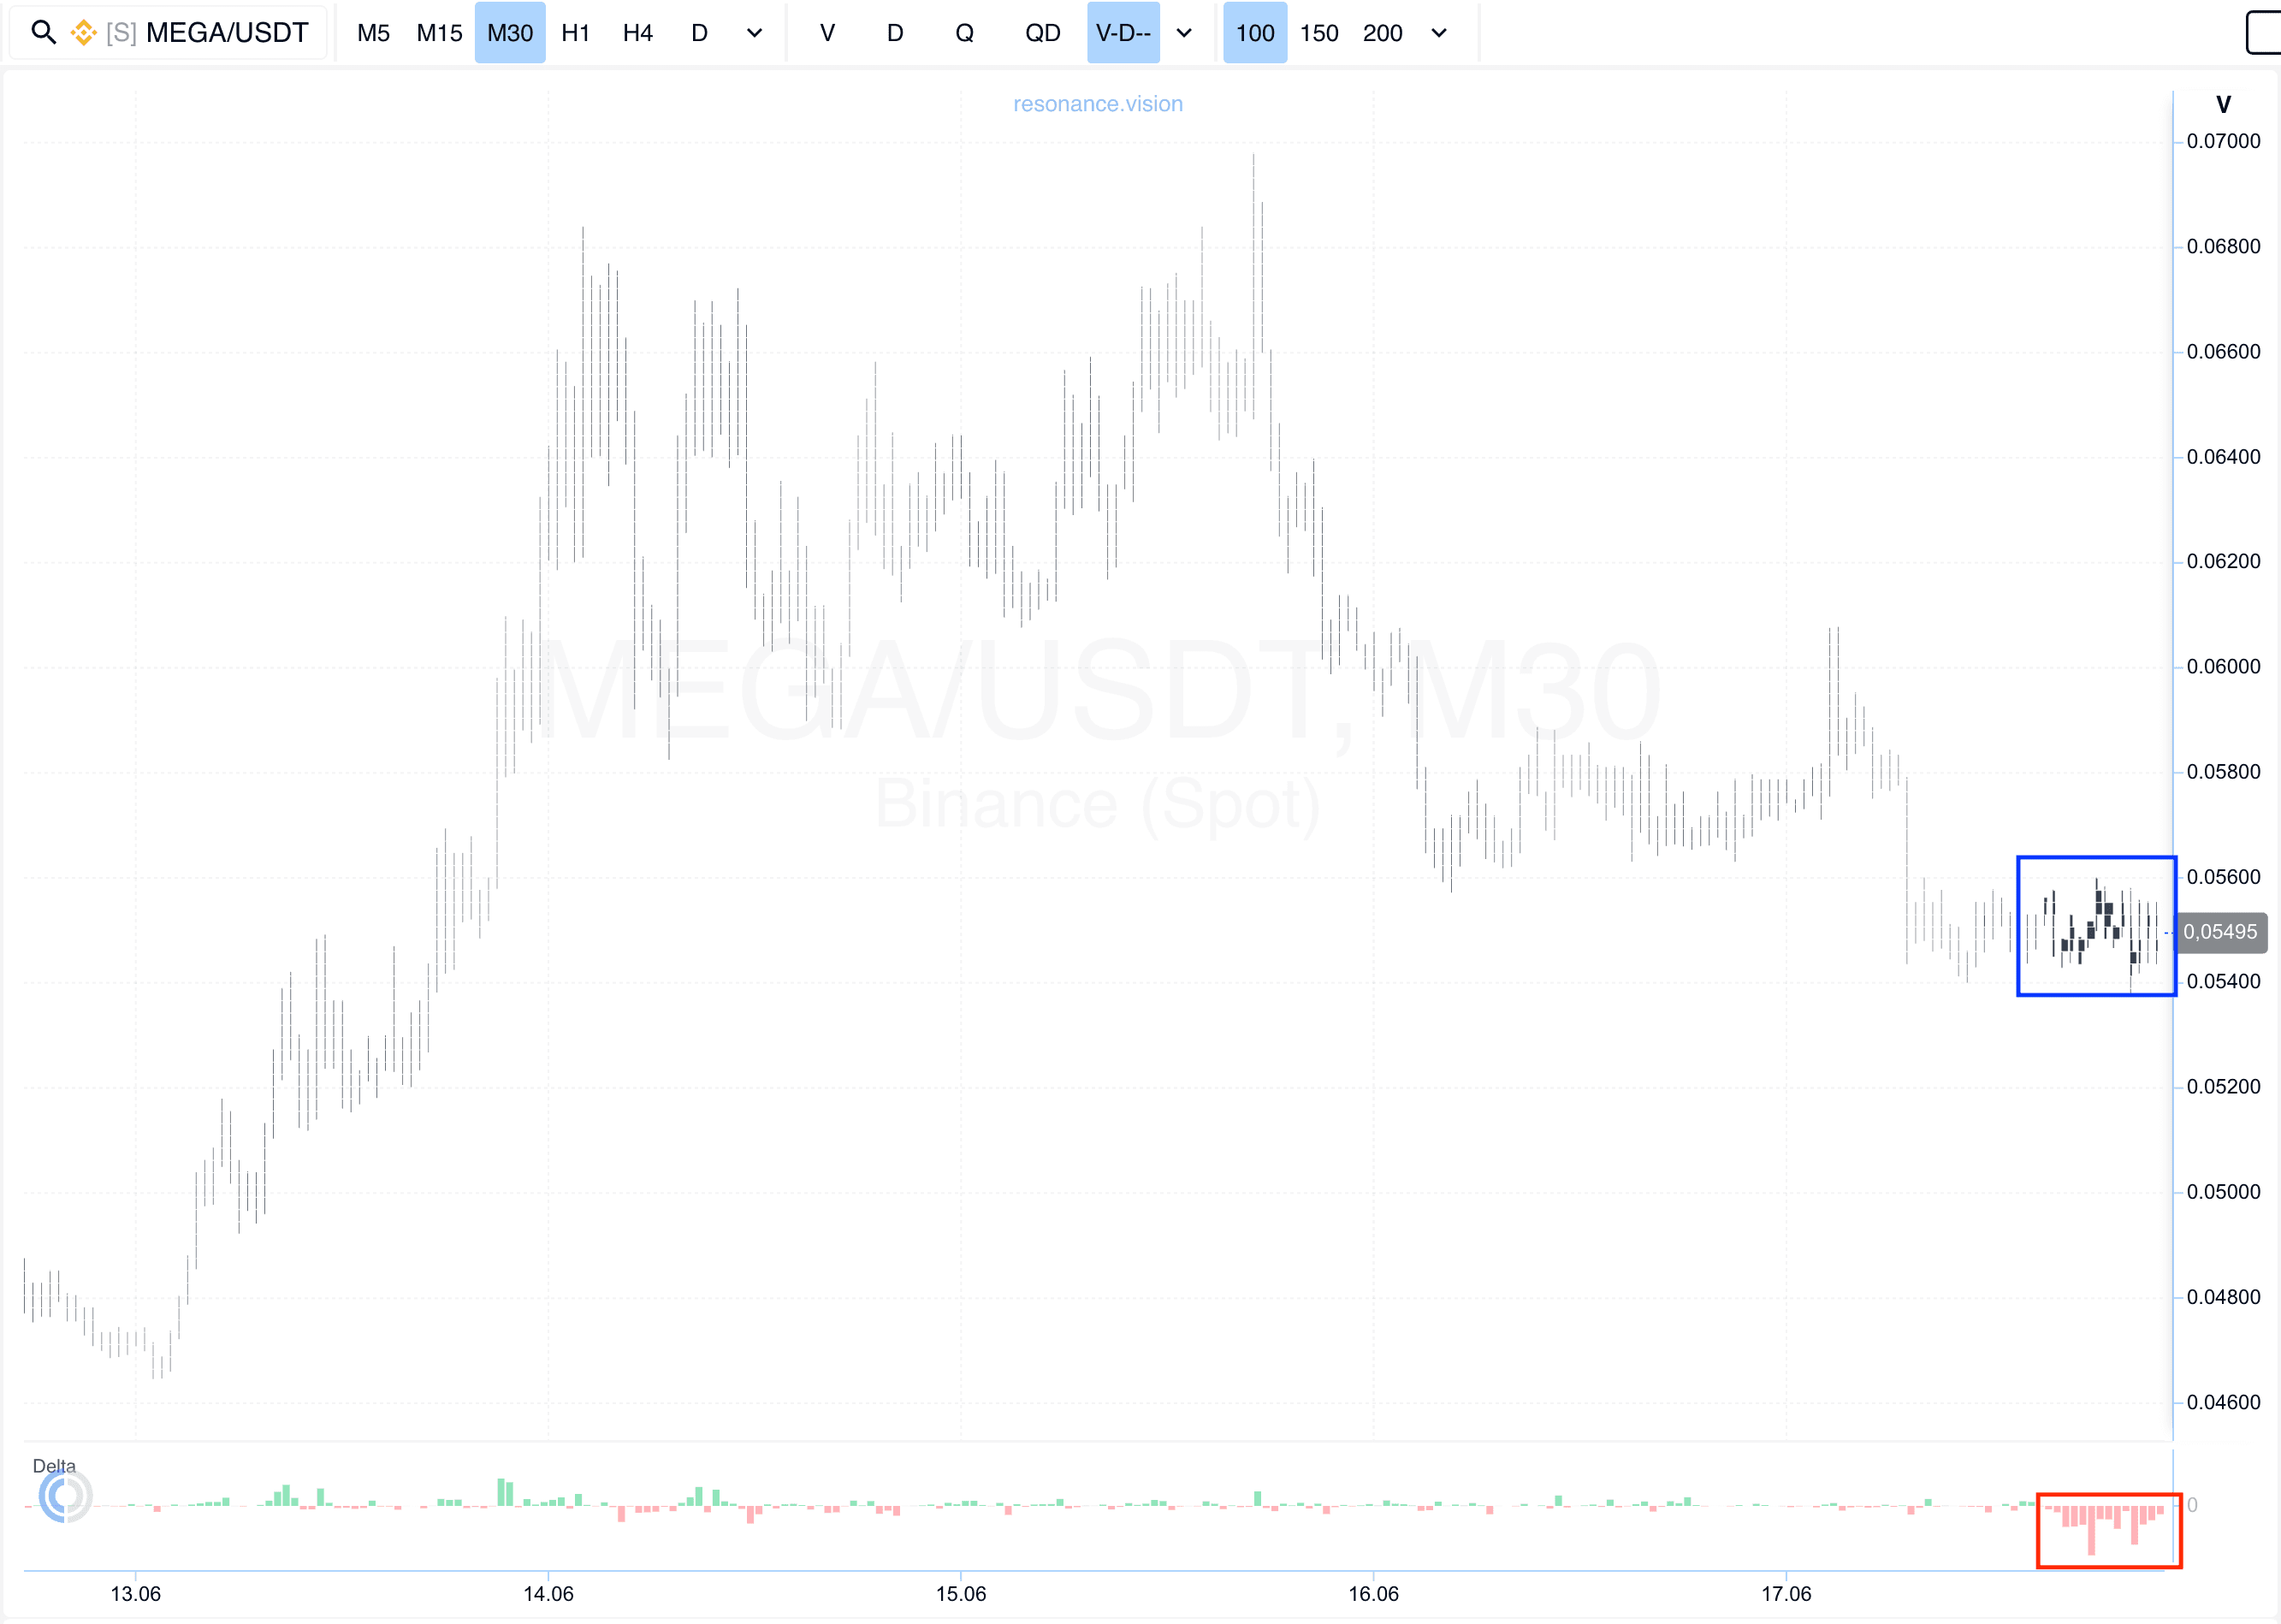
Cluster Chart: During the local decline, large volume clusters formed (blue rectangle), indicating high participant activity within this area. Inside these clusters, there was a pronounced dominance of market sell orders (red rectangle), reflecting aggressive selling activity.
However, despite the significant volume of market selling, the price stopped responding with a comparable decline. Sellers’ attempts to continue the downward move no longer resulted in lower prices.
This divergence between volume and price reaction is an important signal of a shift in market balance. Sellers continue to expend significant volume, but their impact on price is becoming increasingly ineffective. This suggests the presence of opposing demand actively absorbing incoming sell orders.
Such behavior indicates the formation of signs of a local deficit and weakening seller initiative. Under these conditions, the probability of a short-term shift in balance toward buyers begins to increase noticeably.
In the Dashboard
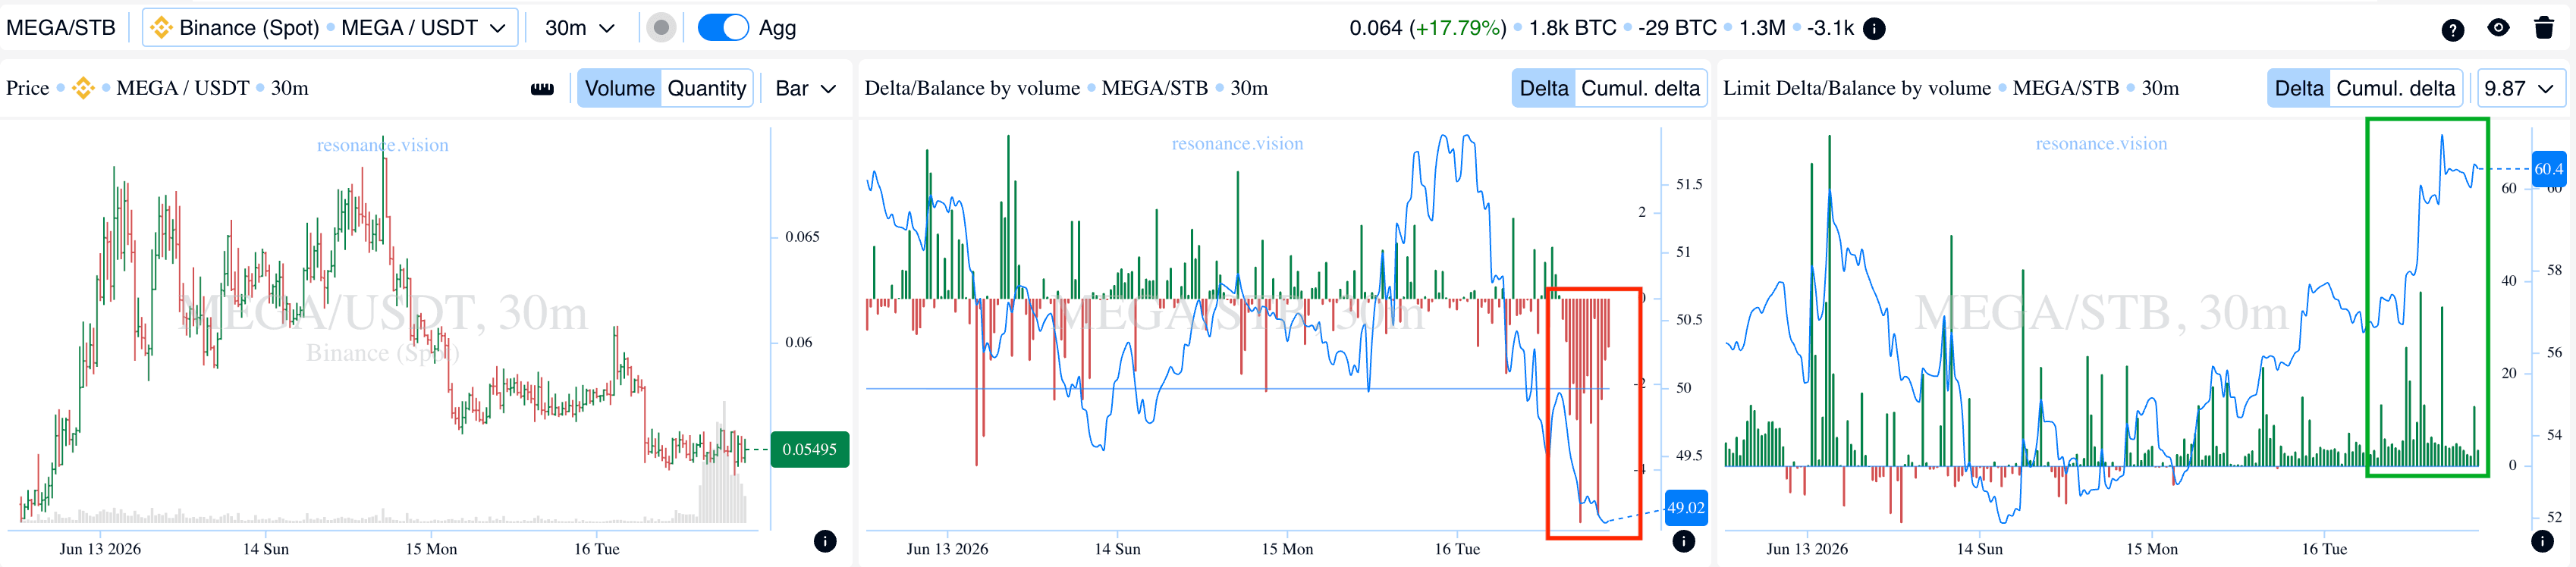
Delta / Volume Balance and Limit Delta: Aggregated data across all trading pairs and exchanges also confirms the observations from the cluster chart. During the analyzed period, a noticeable surge in market sell orders was recorded, clearly reflected in the delta histogram (red rectangle).
Despite the increase in aggressive selling activity, the price failed to show a corresponding reaction, further indicating declining seller efficiency and the presence of strong opposing demand.
At the same time, limit delta showed an increase in buy limit orders (green rectangle). This indicates that incoming market sell volume was actively absorbed by limit buyers willing to accept supply at current prices.
This combination of signals points to the formation of local support within the analyzed range. As a result, a supply deficit begins to emerge while the balance gradually shifts toward buyers, providing additional confirmation for a potential bullish scenario.
Exit Reasons
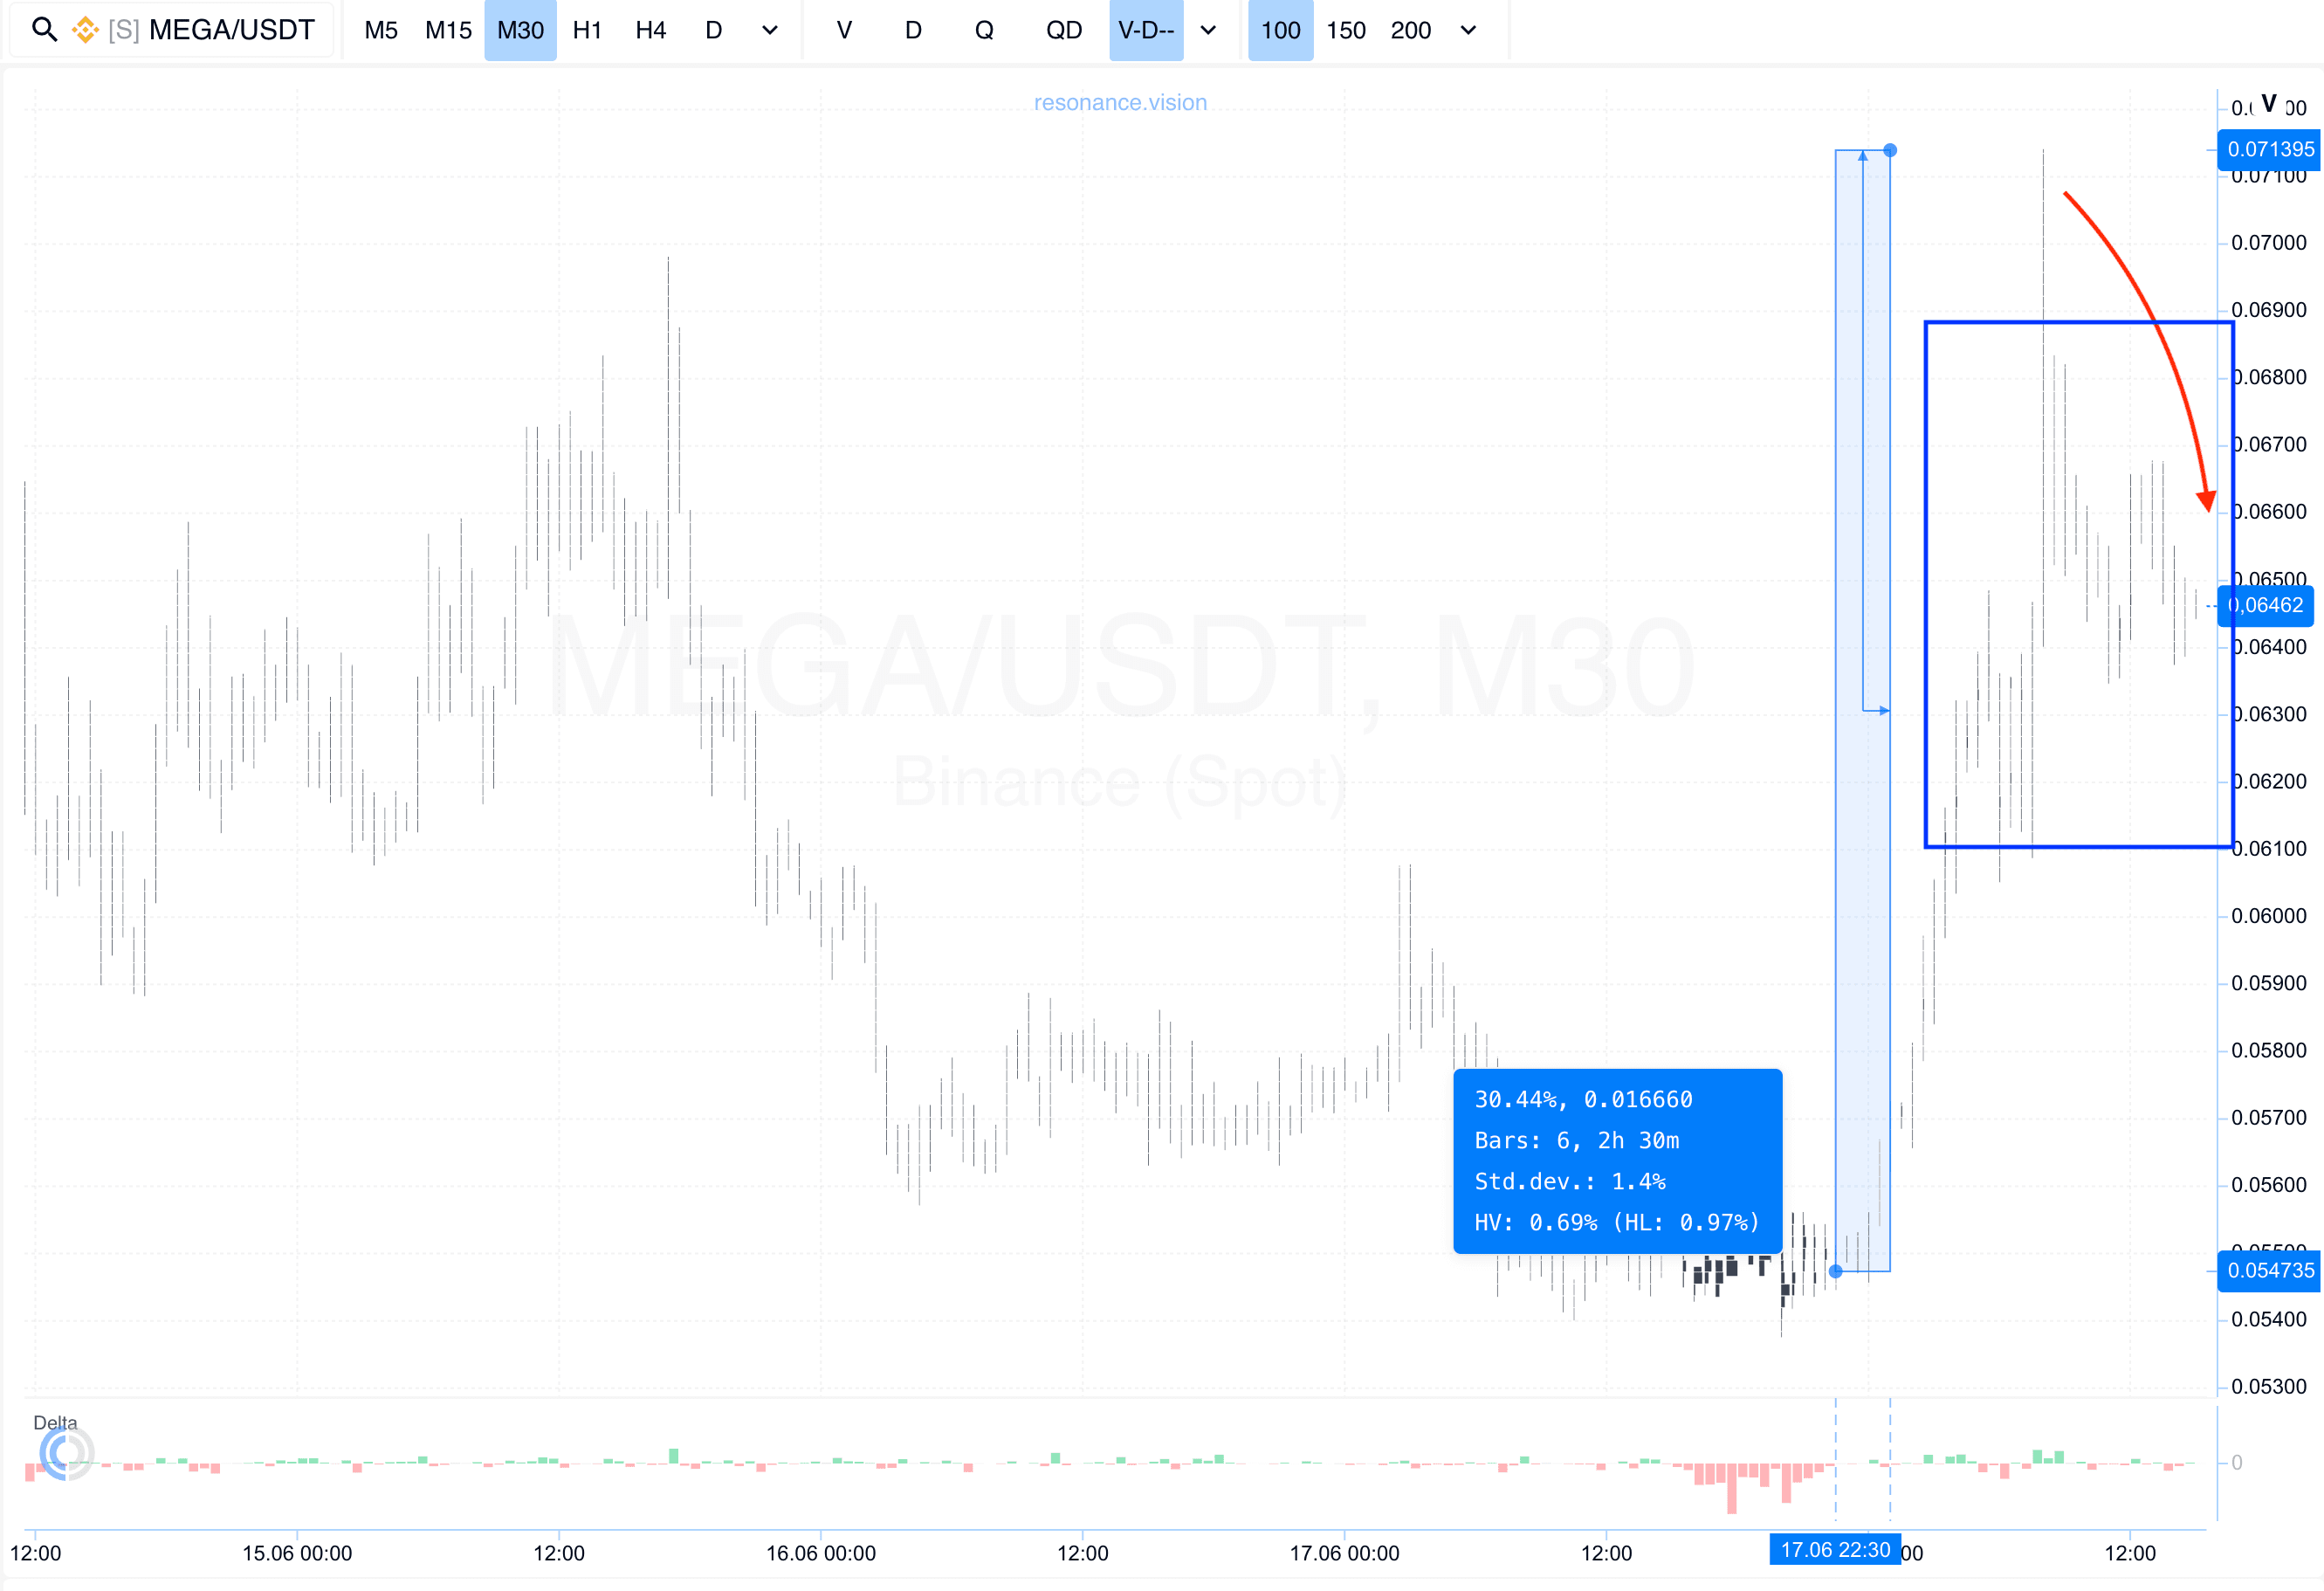
Cluster Chart: From the entry point, the price advanced more than 30%, representing a strong move for this asset and fully validating the original trading idea.
As the upward move developed, volatility increased noticeably (blue rectangle), indicating intensifying competition between buyers and sellers. This was followed by a pullback (arrow), which became the first signal of weakening bullish momentum.
Such dynamics often indicate a transition from a directional trend into a phase of searching for a new balance. After a strong rally, market participants begin actively taking profits, increasing the probability of a deeper correction.
Under these conditions, continuing to hold the position involves a noticeable increase in risk. Therefore, securing profits after a move exceeding 30% appeared to be a logical and well-justified decision from a position management and capital preservation perspective.
Conclusion
This trade demonstrates how analyzing the interaction between volume and price can reveal shifts in market balance before a significant move begins. Despite substantial pressure from market sellers, the market stopped reacting with further declines, indicating weakening seller efficiency and the formation of signs of a local deficit.
Additional confirmation came from the dashboard data: the surge in market selling activity was accompanied by an increase in buy limit orders, indicating active absorption of supply and the formation of local support. This combination of factors suggested a shift in initiative toward buyers and provided a well-founded entry opportunity.
After the position was opened, the market followed the expected scenario and delivered a gain of more than 30%. As the move developed, both volume and volatility increased, signaling intensified competition between market participants and a growing probability of a transition into a corrective phase.
Thus, the entry was based on signs of a local deficit and seller inefficiency, while the exit was driven by increasing risks following a strong move and the appearance of signs of weakening bullish momentum. This approach allows traders to systematically evaluate the state of supply and demand and make higher-quality trading decisions over the long term.
Follow new insights in our telegram channel.
No need to invent complex schemes and look for the "grail". Use the Resonance platform tools.
Register via the link — get a bonus and start earning:
OKX | BingX | KuCoin.
Promo code TOPBLOG gives you a 10% discount on any Resonance tariff plan.
Recommended articles


