MITO +39.94% (Directional Strategy Resonance)

A deal analysis using cluster analysis, delta, and limit delta. We demonstrate how market inefficiency and signs of local shortages helped determine the entry point, while a shift in the sellers’ favor signaled profit-taking after a 40% rally.
Table of contents

Coin: MITO/USDT
Risk: Medium
Knowledge Level: Beginner
Entry Reasons
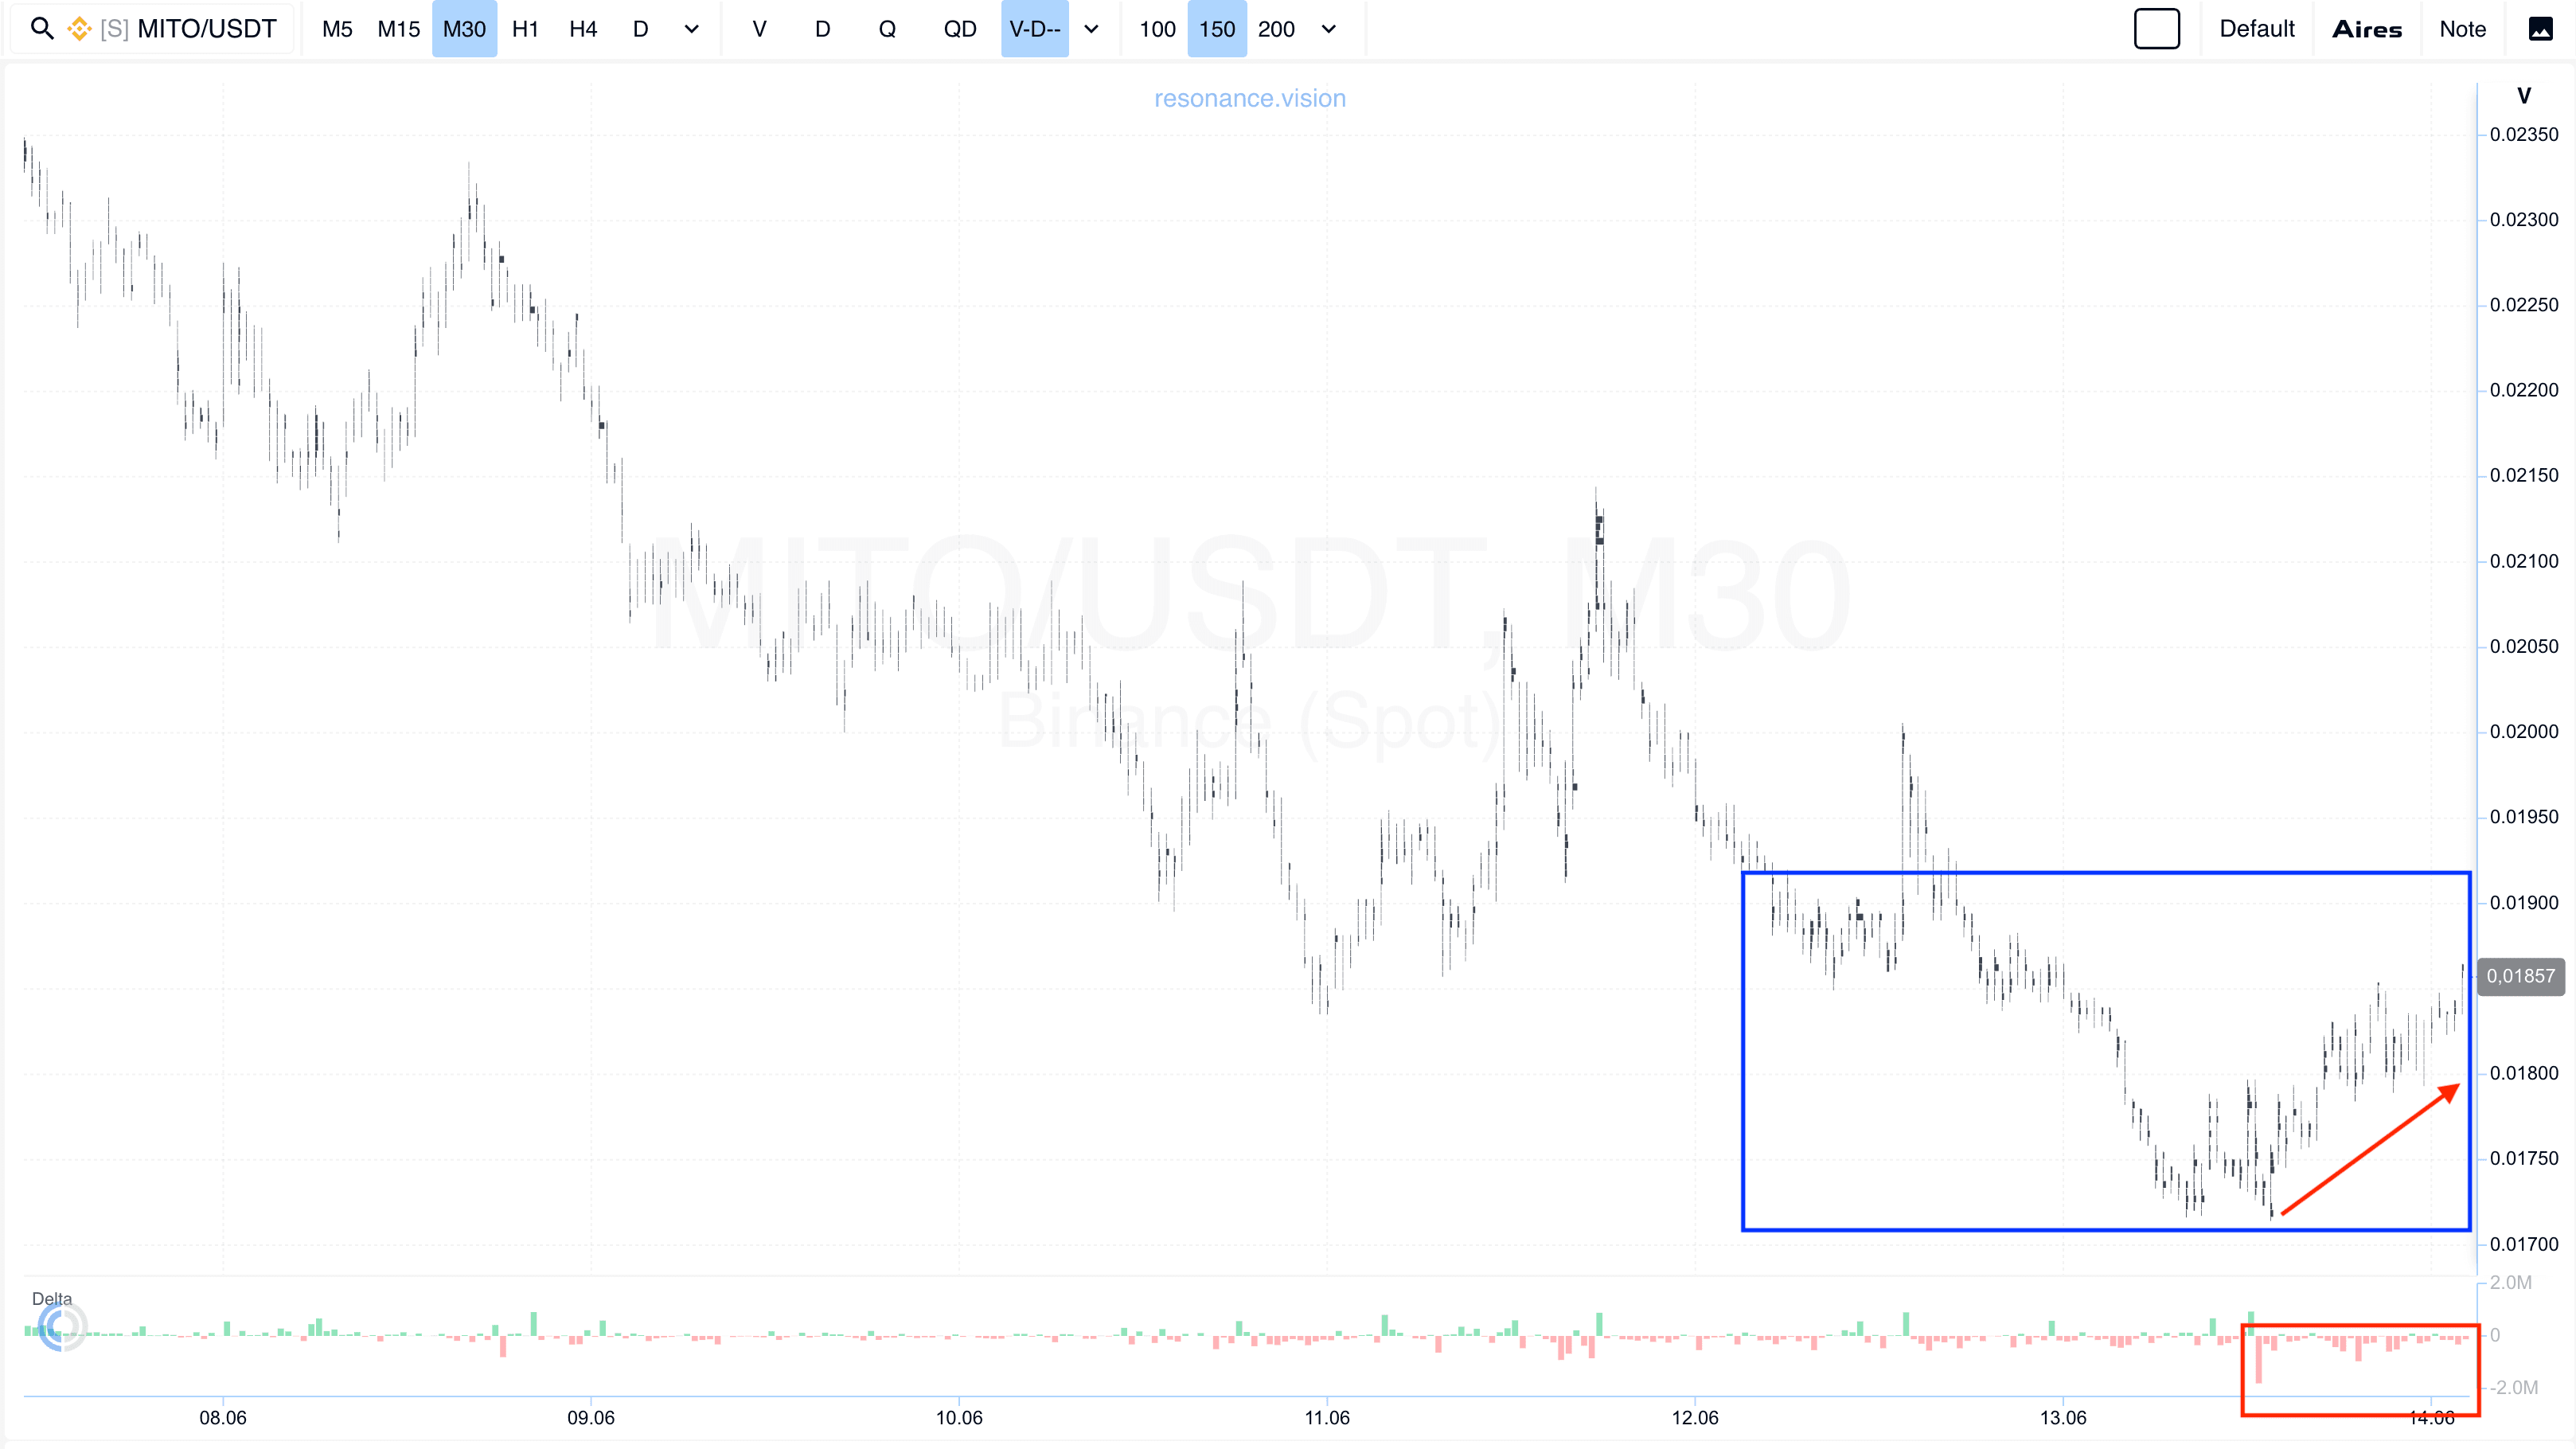
Cluster Chart: During the local decline, large volume clusters formed relative to the entire visible range (blue rectangle), indicating high market participant activity within this area.
At the same time, market sell orders began to consistently dominate during the latest period (red rectangle and arrow). However, despite the ongoing selling pressure, the price stopped reacting with further declines and instead gradually started moving higher.
This divergence between selling volume and price reaction is an important sign of a shift in market balance. Sellers continue to expend significant volume, but their impact on price is becoming increasingly ineffective. This suggests the presence of opposing demand actively absorbing incoming sell orders.
Such behavior indicates declining effectiveness of market selling pressure and the formation of signs of a local deficit. Under these conditions, initiative gradually begins to shift toward buyers, creating favorable conditions for further upside movement.
In the Dashboard
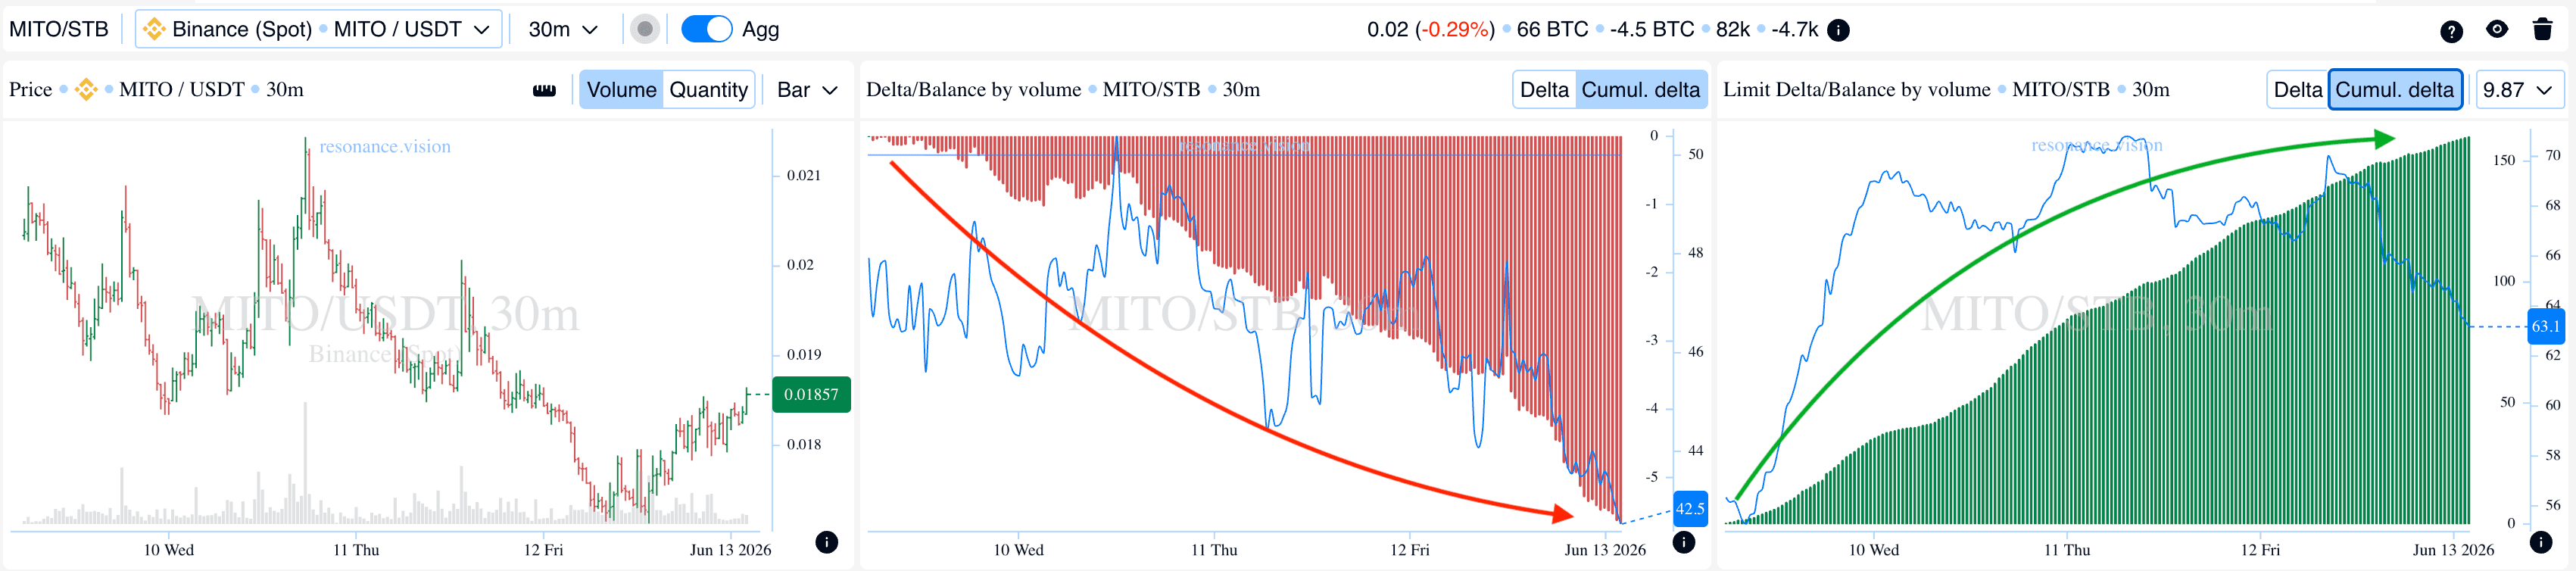
Delta / Volume Balance and Limit Delta: Aggregated data across all trading pairs and exchanges also confirms the observations from the cluster chart. During the analyzed period, cumulative market selling pressure continued to strengthen steadily, which is clearly reflected in the cumulative delta histogram. Extreme selling values continued to increase (red arrow).
Despite the growth in market sell volume, the price failed to show a corresponding reaction. This further confirmed declining seller efficiency and the presence of strong opposing demand within the analyzed area.
At the same time, the limit delta showed a cumulative increase in buy limit orders (green rectangle). This indicates that incoming market sell volume was actively absorbed by limit buyers.
This combination of signals is a characteristic sign of local support formation. As a result, a supply deficit begins to emerge while the balance gradually shifts toward buyers, creating favorable conditions for opening a long position.
Exit Reasons
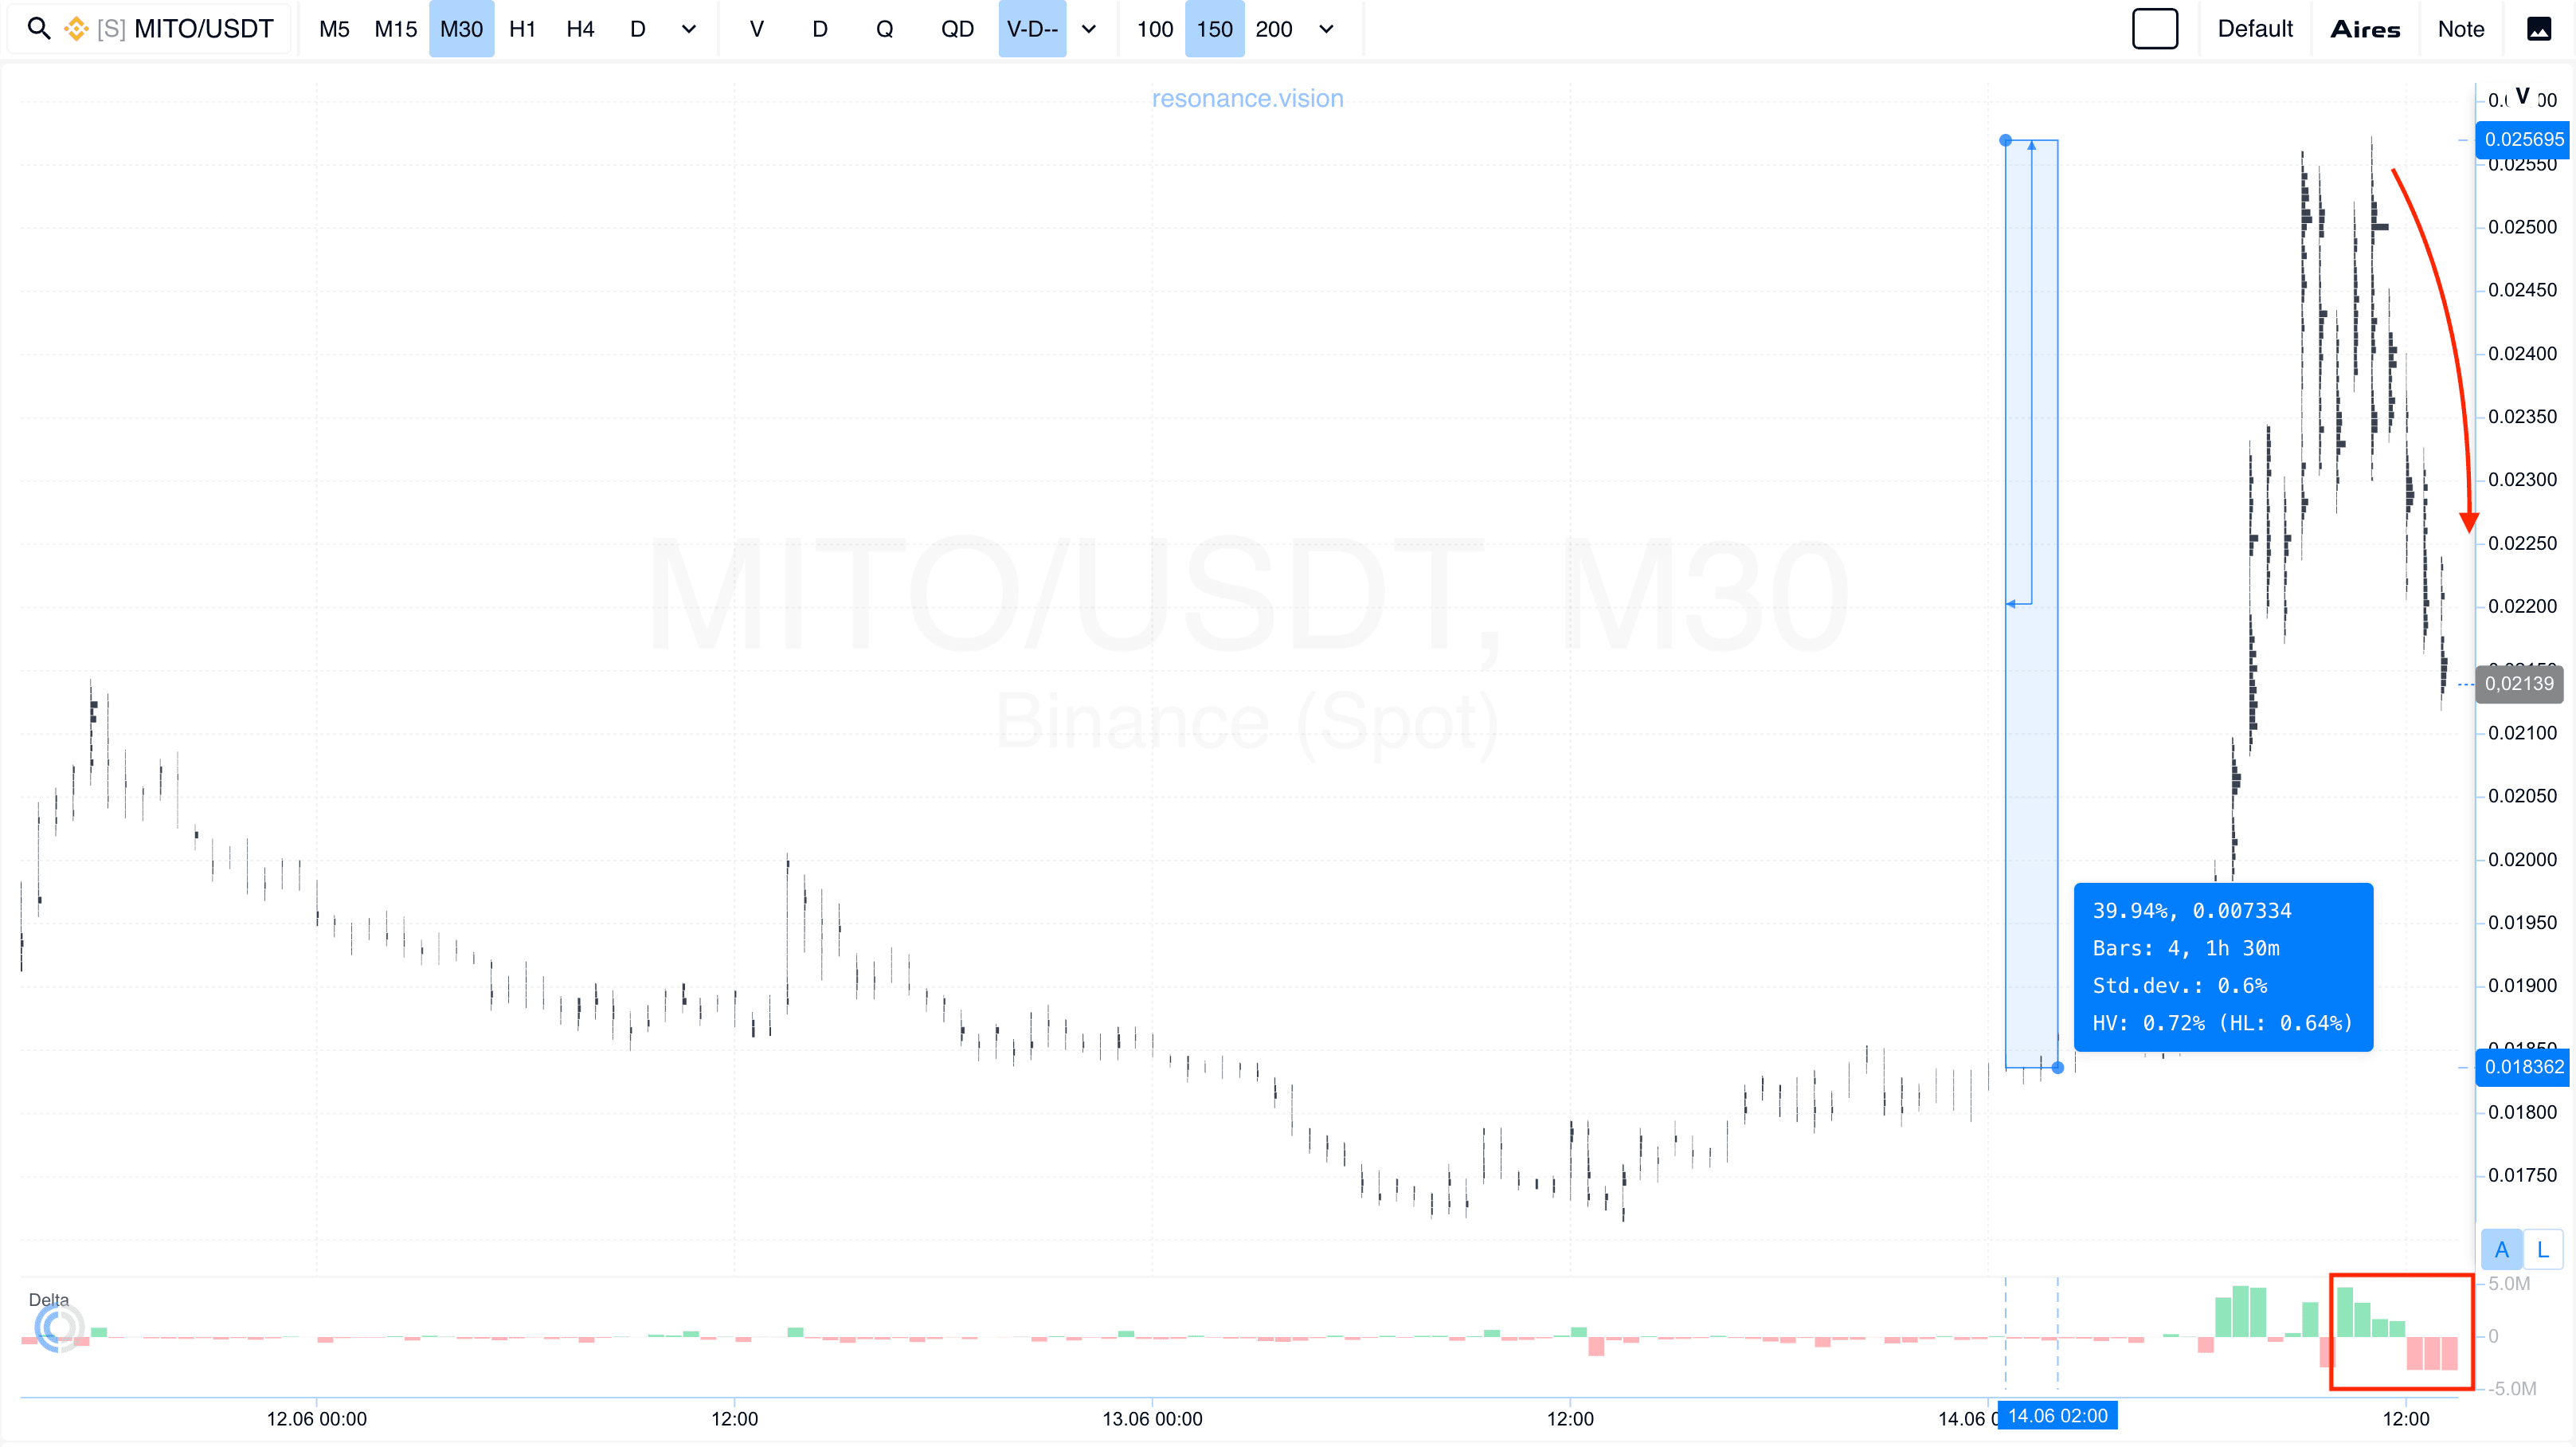
Cluster Chart: From the entry point, the price advanced nearly 40%, representing a strong move for this asset and fully validating the original trading idea.
As the upward move developed, volumes continued to increase, which is clearly visible through the formation of large clusters. At the same time, volatility rose noticeably, which often indicates intensified competition between buyers and sellers following an extended trending move.
Afterward, a pullback formed during which market buying activity gradually transitioned into market selling activity (red rectangle and arrow). Unlike the situation at the entry point, sellers were now demonstrating effectiveness and exerting a noticeable influence on price.
Such dynamics indicate a shift in short-term initiative toward sellers and increase the probability of a deeper correction or a transition into a balance-seeking phase.
Under these conditions, continuing to hold the position involves a noticeable increase in risk. Therefore, taking profits after such a strong move appeared to be a logical and well-justified decision from a position management perspective.

Conclusion
This trade review clearly demonstrates the importance of evaluating volume efficiency rather than simply focusing on its size. At the entry stage, the market was under sustained pressure from market sellers, yet the price stopped reacting with further declines and gradually began moving higher. This indicated weakening sellers and active absorption of their volume by limit buyers, which created signs of a local deficit and established conditions for further upside movement.
Additional confirmation came from the dashboard data, where increasing market selling pressure was accompanied by a cumulative rise in buy limit orders. This combination of signals indicated the formation of local support and a gradual shift in initiative toward buyers.
After entry, the market followed the expected scenario and produced a move of approximately 40%. However, as the rally developed, the structure began to change: both volume and volatility increased, while sellers once again started exerting a noticeable influence on price. This indicated a shift in the short-term balance and an increased probability of a corrective move.
Thus, the entry was based on signs of a local deficit and seller inefficiency, while the exit was based on the recovery of seller effectiveness and the emergence of signs of weakening buyer strength. This approach allows traders to identify shifts in the balance between supply and demand in a timely manner and make higher-quality trading decisions.
Follow new insights in our telegram channel.
No need to invent complex schemes and look for the "grail". Use the Resonance platform tools.
Register via the link — get a bonus and start earning:
OKX | BingX | KuCoin.
Promo code TOPBLOG gives you a 10% discount on any Resonance tariff plan.
Recommended articles


