MORPHO +18.58% (Resonance Directional Strategy)

A deal analysis through volume and efficiency: how market inefficiencies formed the entry point, and a decline in buyer influence became a signal to take profits.
Table of contents

Coin: MORPHO/USDT
Risk: medium
Level of understanding: beginner
Entry Reasons
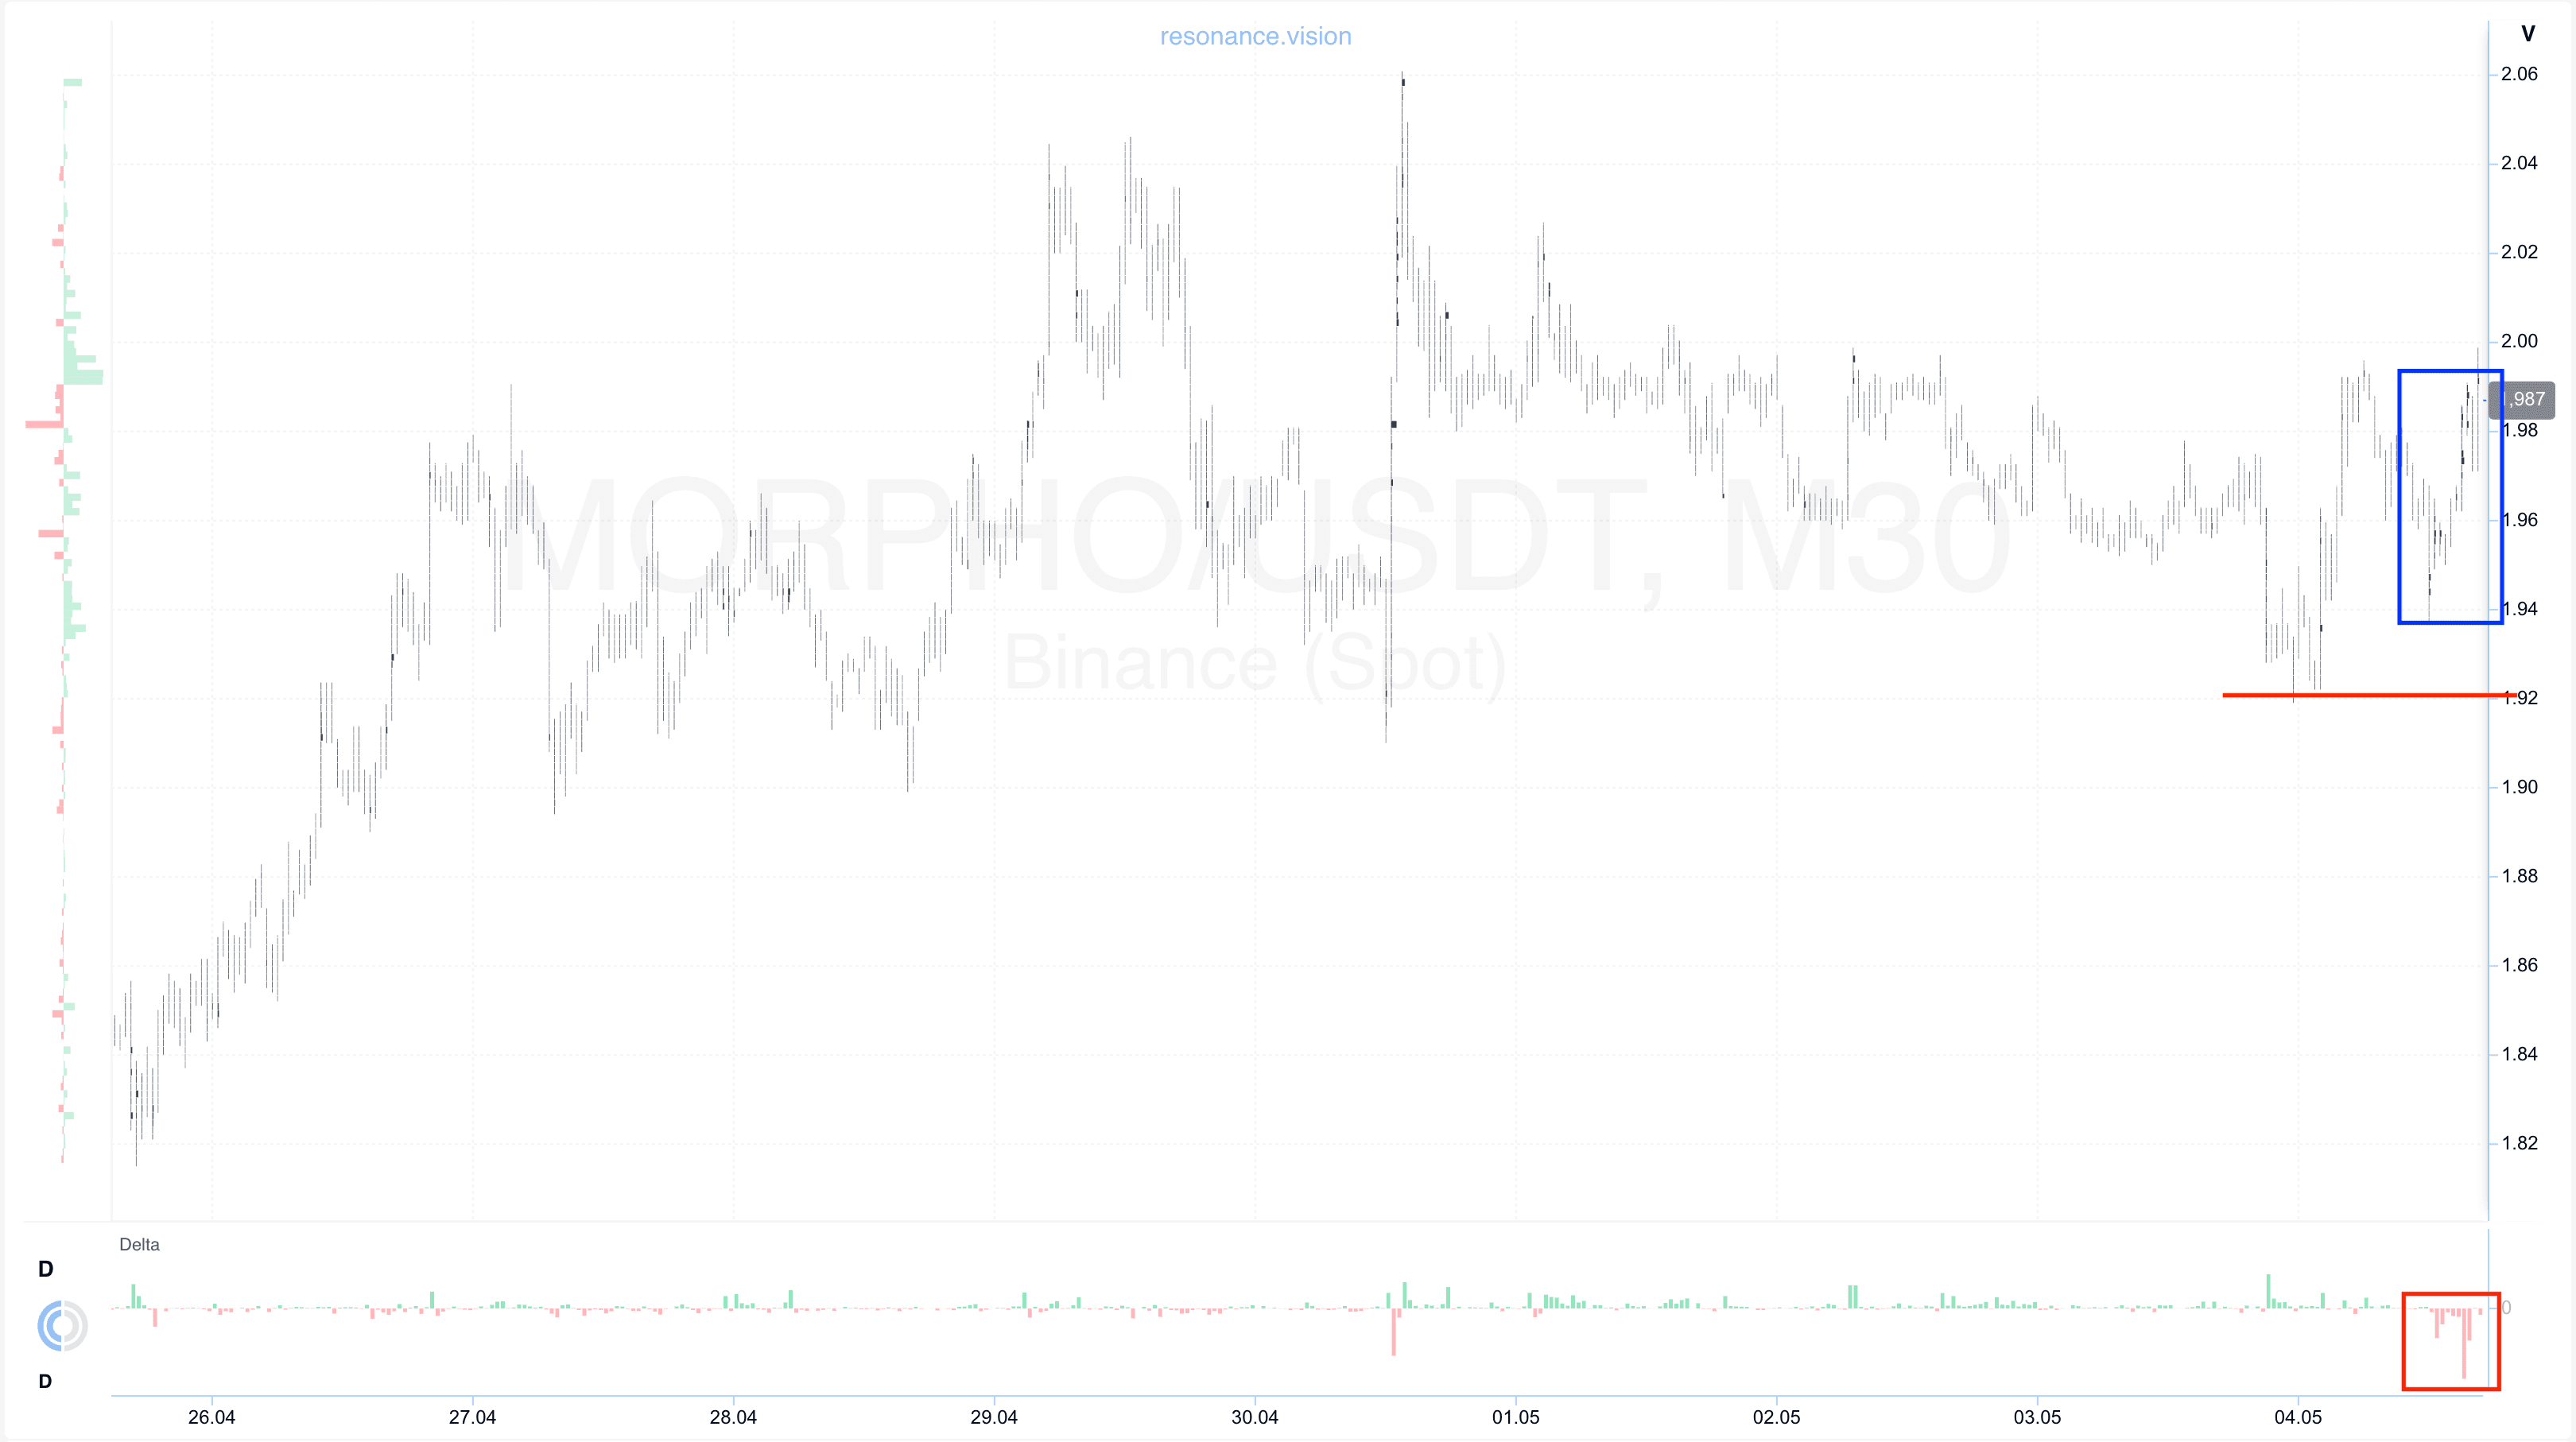
Cluster chart: during the phase of local sideways movement, relatively large volume clusters were formed within the visible range (blue rectangle). These volumes were accompanied by a pronounced dominance of market sell orders (red rectangle).
However, despite the dominance of selling, the price did not show a significant decline and failed to update the local minimum (red line).
Such a reaction indicates the formation of signs of a local deficit: the market stops declining even under dominant selling, which indicates weakening of sellers’ initiative and a possible shift in balance toward buyers.
In the Dashboard
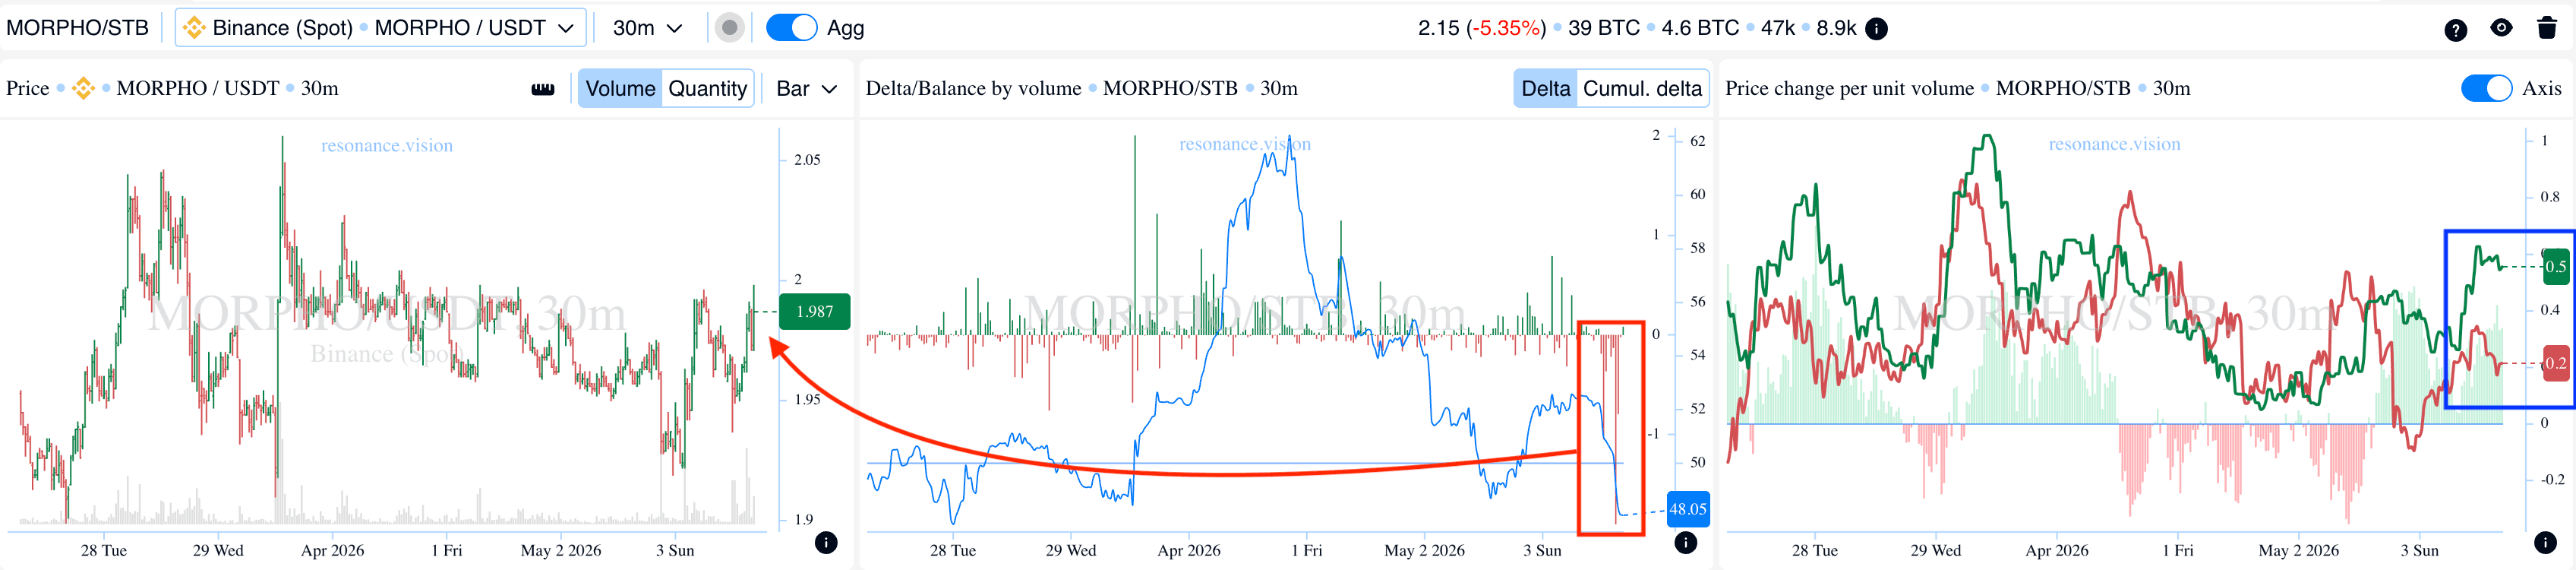
Delta / Volume Balance: in aggregated form, data across all pairs and exchanges confirms the observations from the cluster chart. During the analyzed period, while market sell volumes were increasing, the price, on the contrary, showed a slight local growth (red rectangles and line).
Such a combination indicates active absorption of incoming market sell volume by limit participants. As a result, local support is formed in the current range, which further confirms the weakening of selling pressure.
Price Change per Unit of Volume: it can also be observed that the efficiency of market order impact began shifting toward buyers (blue rectangle).
Less volume is required to move the price upward than downward. This indicates higher efficiency on the buyers’ side and serves as an additional argument.
As a result, several factors were formed indicating a shift in initiative toward buyers, which served as the basis for entering the position.
Exit Reasons
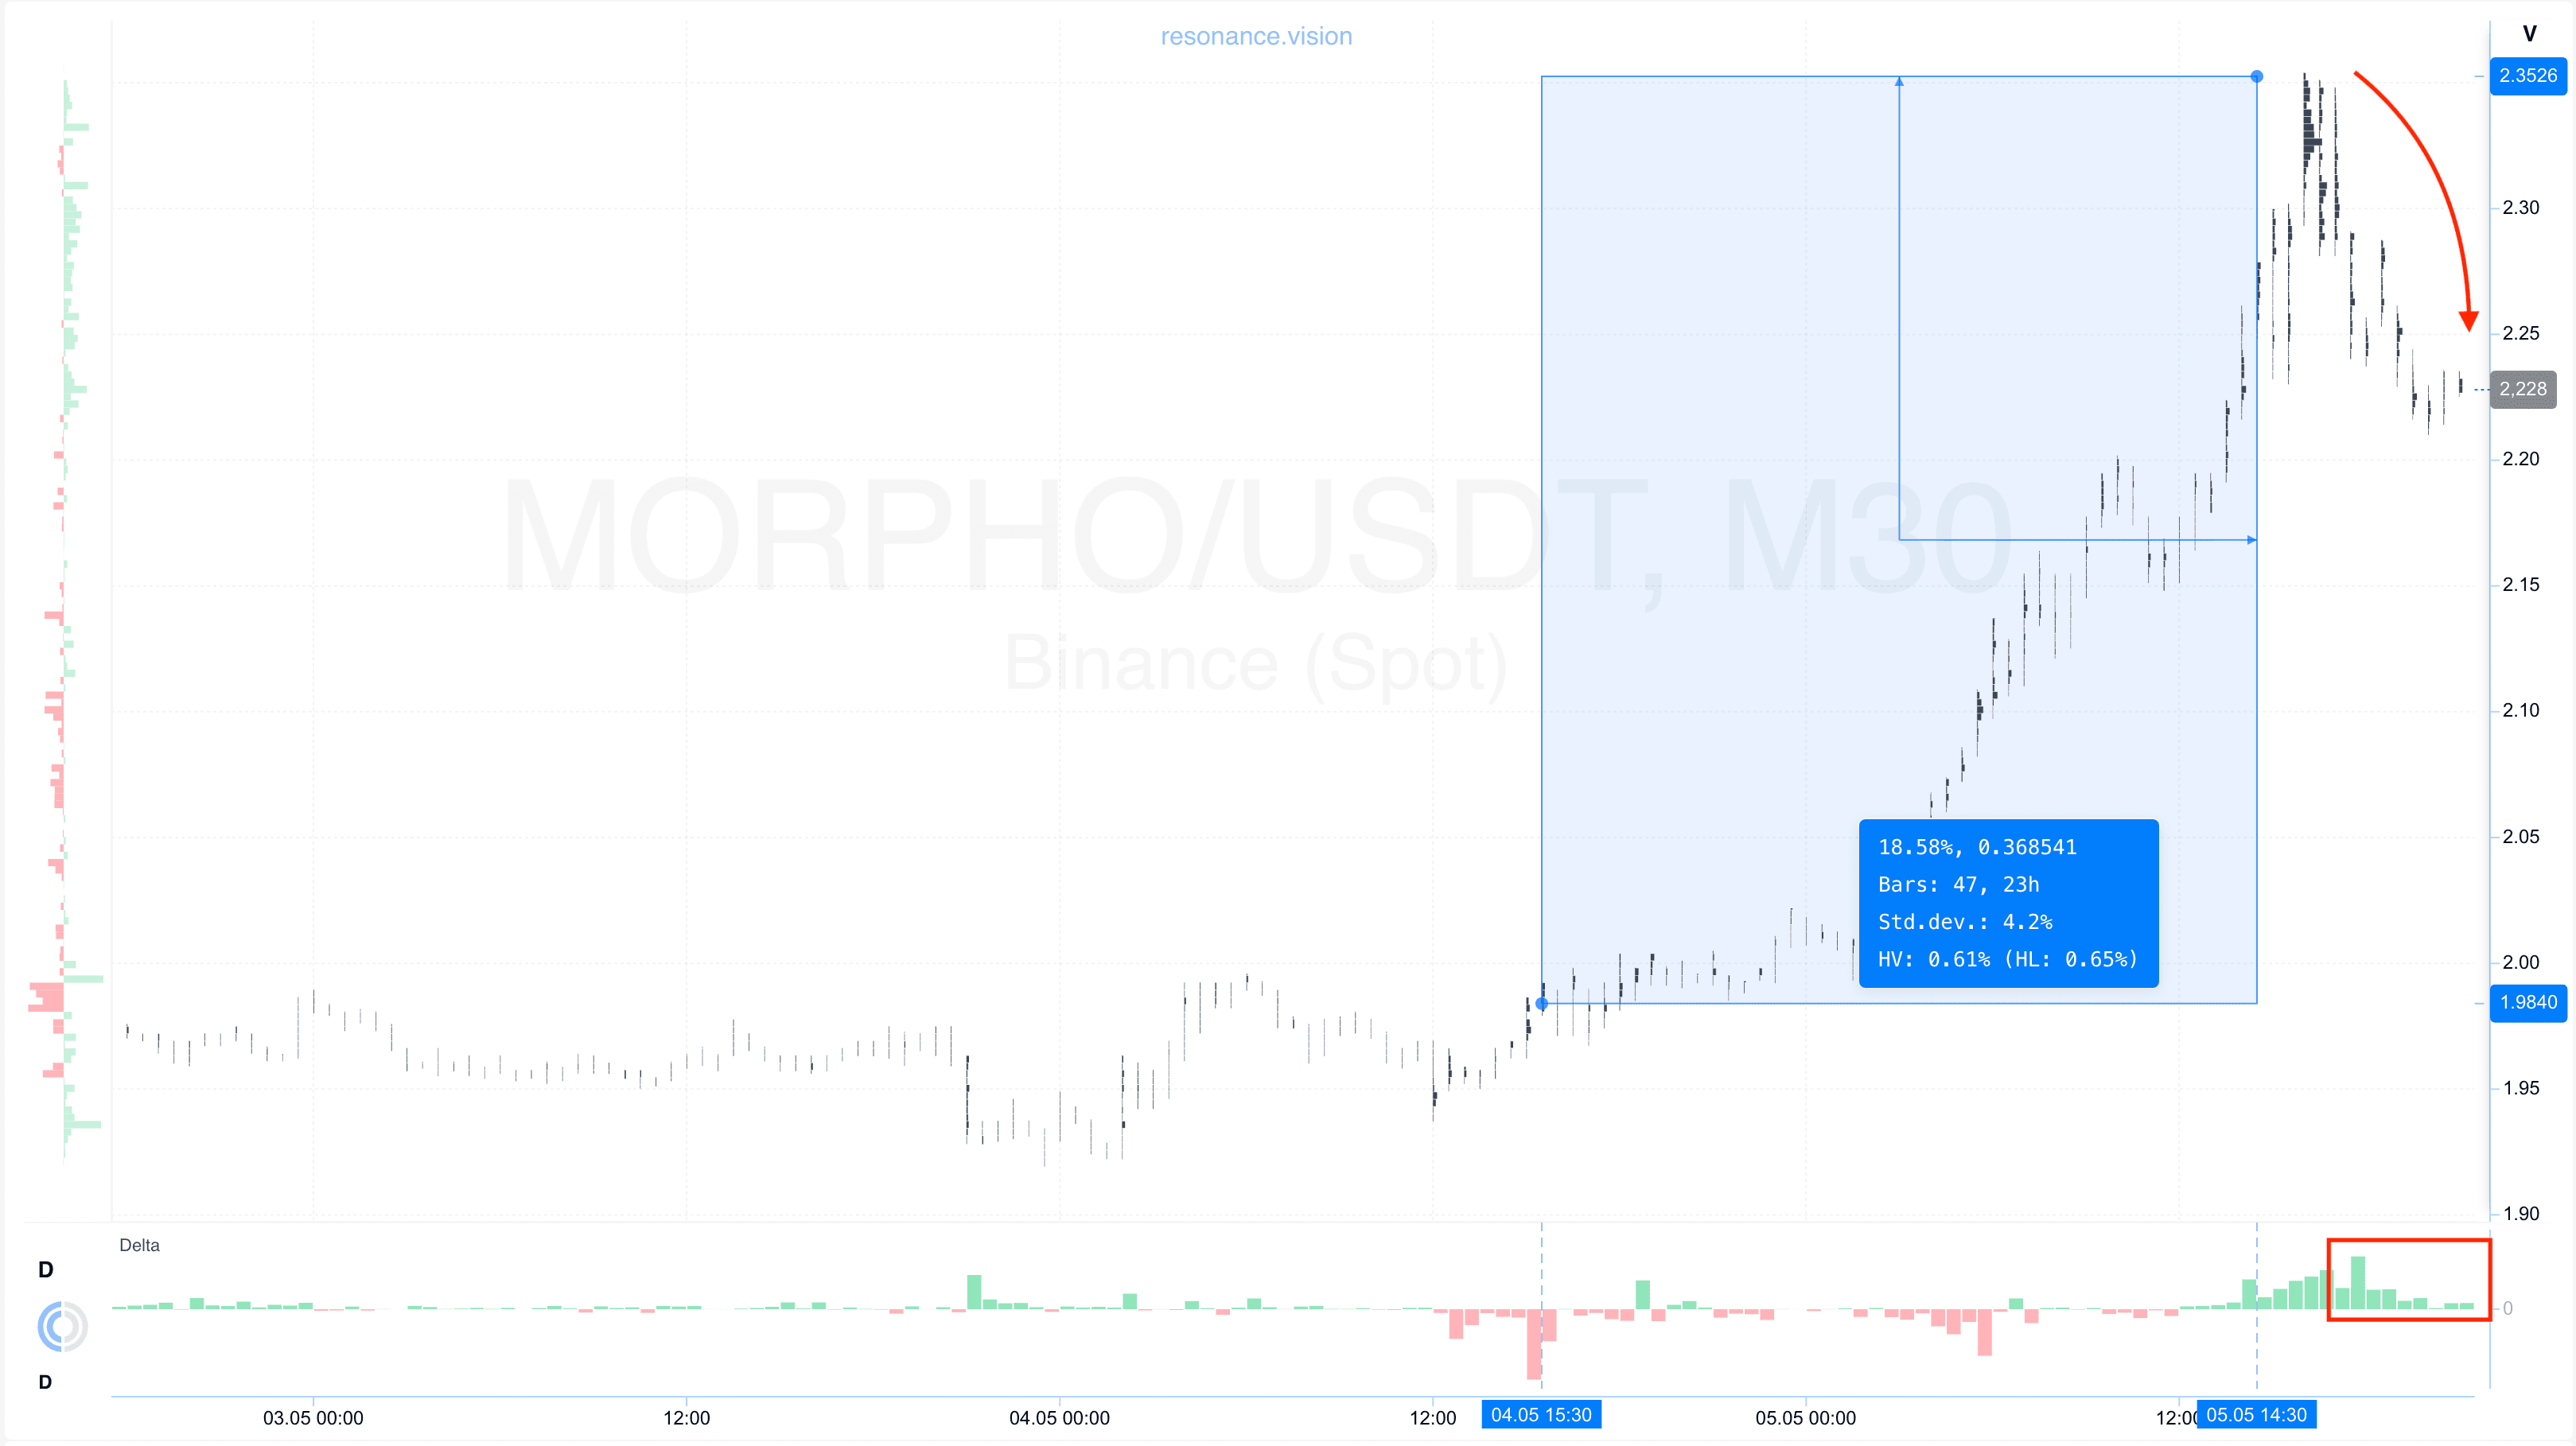
Cluster chart: after the entry point, the price increased by nearly 20%, forming a confident local movement.
However, subsequent market buy orders no longer had the same impact on price — the asset gradually began to decline (red rectangle and arrow).
Such a reaction indicates decreasing buyer efficiency and the appearance of signs of a local surplus.
Under these conditions, further holding of the position is accompanied by increasing risks. Therefore, taking profit in this zone appeared to be the most rational and balanced decision from a position management perspective.
Conclusion
This analysis clearly demonstrates that the key factor in market evaluation is not just the presence of volume, but its efficiency and impact on price.
At the entry stage, despite the dominance of market selling, the price not only stopped declining but also began showing local stability. This indicated weakening of sellers and active absorption of their volume by limit participants, which led to the formation of signs of a local deficit and a shift in balance toward buyers.
Additional confirmation came from the aggregated dashboard data and the price change per unit of volume, where it became noticeable that the buyers’ side had begun exerting a more efficient influence on price.
After the entry, the market delivered the expected upward movement. However, as the impulse developed, signs of a structural shift began to appear: market buy orders remained present, but their impact on price gradually weakened, and the asset entered a phase of local weakening.
Thus, the entry was based on signs of seller inefficiency and the formation of a deficit, while the exit was based on decreasing buyer efficiency and the appearance of signs of surplus.
Such an approach allows the market to be evaluated through the interaction between volume and price, which significantly improves the quality and validity of trading decisions over time.
Follow new insights in our telegram channel.
No need to invent complex schemes and look for the "grail". Use the Resonance platform tools.
Register via the link — get a bonus and start earning:
OKX | BingX | KuCoin.
Promo code TOPBLOG gives you a 10% discount on any Resonance tariff plan.
Recommended articles


