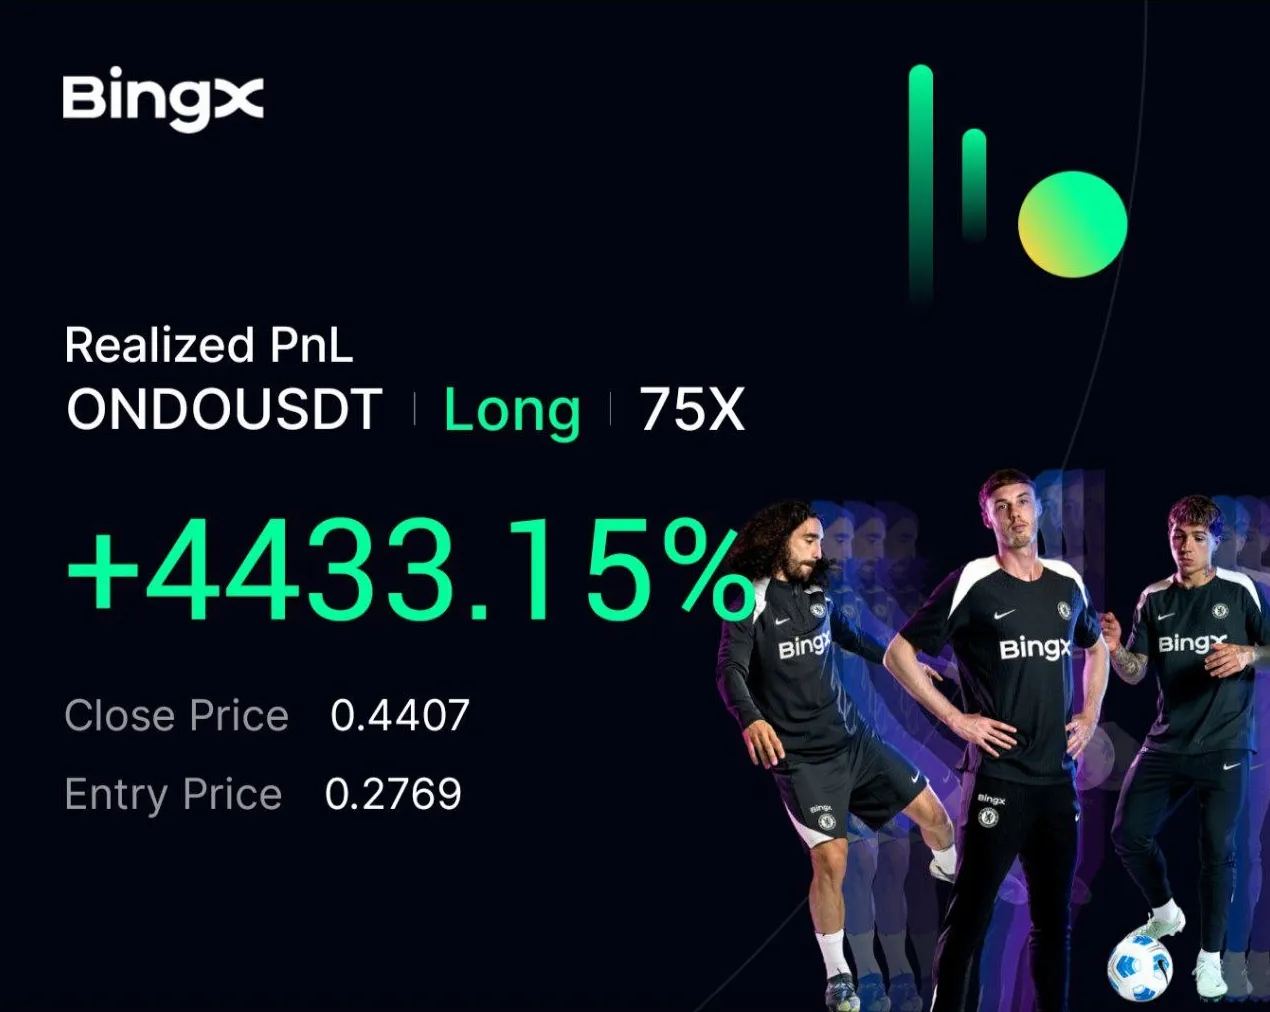
ONDO +4433.15% (Resonance Directional Strategy)

A trade breakdown using the cluster chart, supply and demand analysis, and Resonance analytical tools. We show how market selling, limit buying, delta, and volume balance help identify a deficit phase and find an entry point.
Table of contents

In this trade, the key factor was not simply the fact of a strong decline, but how price began to behave against the backdrop of continued selling pressure. After a fairly sharp drop, the asset stopped making new lows and moved into a stable sideways range.
To assess the situation, Resonance platform tools were used: the cluster chart and the dashboard with aggregated metrics. It was the combination of cluster analysis and volume analysis in trading that made it possible to see not just the presence of pressure, but a shift in the balance between the seller and the buyer.
Entry reasons
Cluster chart: deficit formation
After a prolonged decline of roughly 80%, the trend began to change. The asset moved into a sideways range where a clear dominance of selling was visible (red rectangles).
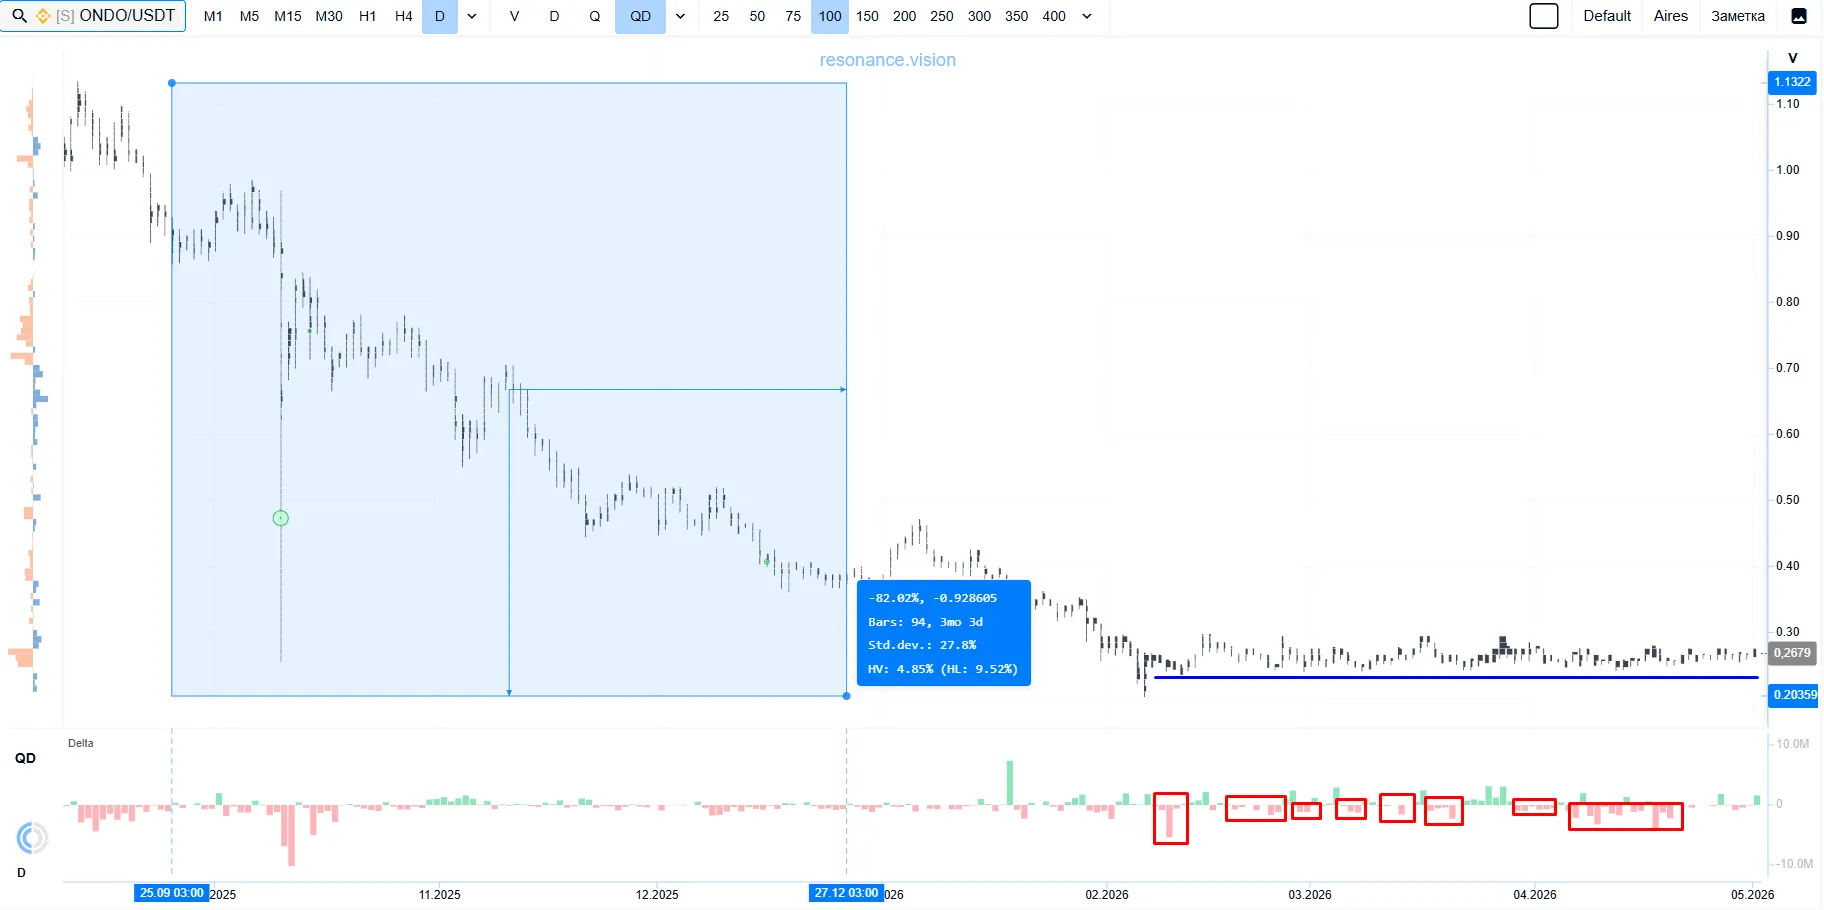
Despite that pressure, local lows were no longer being updated (blue line). This dynamic pointed to the formation of a deficit: the asset stopped declining even in the face of large market sells. That suggested a possible shift in the balance toward buyers.
Dashboard: confirmation through aggregated metrics
Delta / Volume Balance
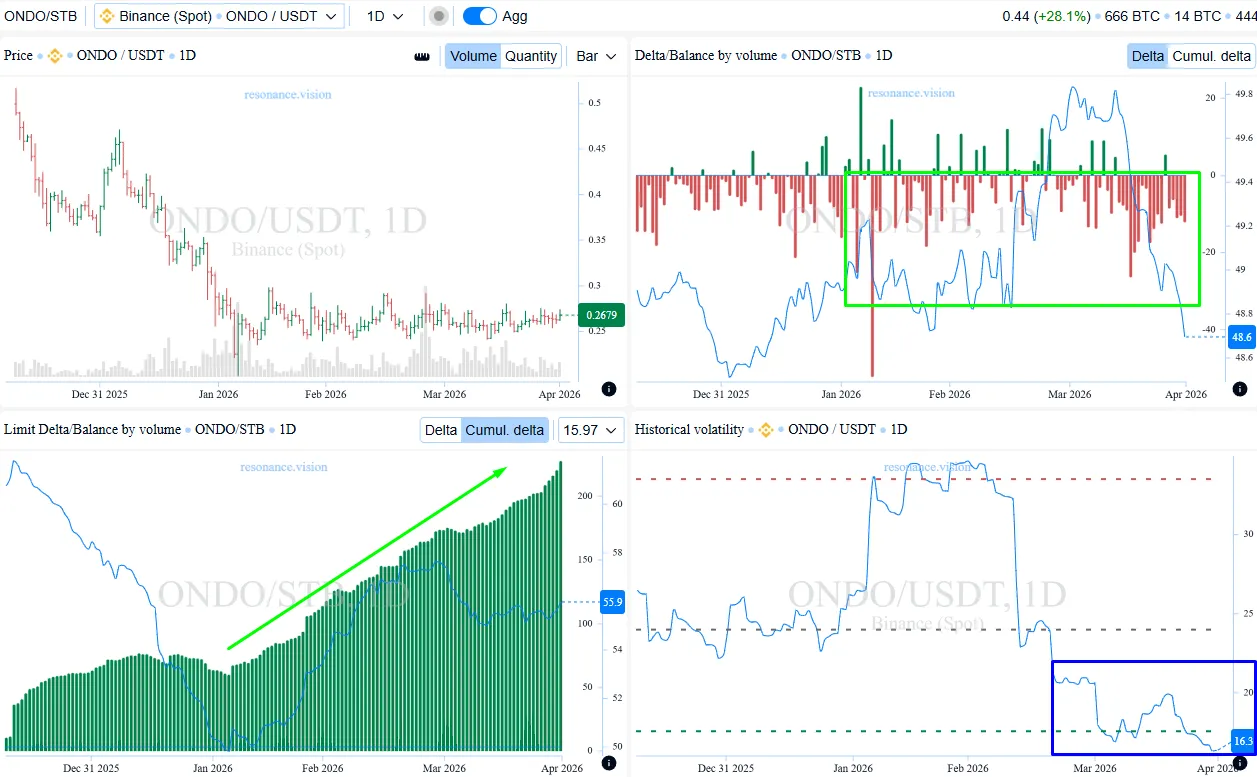
Aggregated data across all pairs and exchanges confirmed the dominance of market sell volume (green rectangle). At the same time, price, by contrast, was holding a stable sideways range.
Limit Delta / Volume Balance
During the asset’s sideways movement, there was a noticeable increase in the activity of limit buy orders (green arrow). The number of buy orders was growing, and this was where support for the current range began to form.
Historical volatility
Historical volatility declined significantly (blue rectangle).
All of these signs pointed to the formation of a deficit and a high probability of a move into its realization phase.
Exit reasons
Cluster chart: declining buyer efficiency
After the entry, price rose by nearly 75%, forming a confident upward move.
Later, the trend began to change: market buying was gradually replaced by a dominance of market selling, which led to the formation of a pullback (red rectangle).
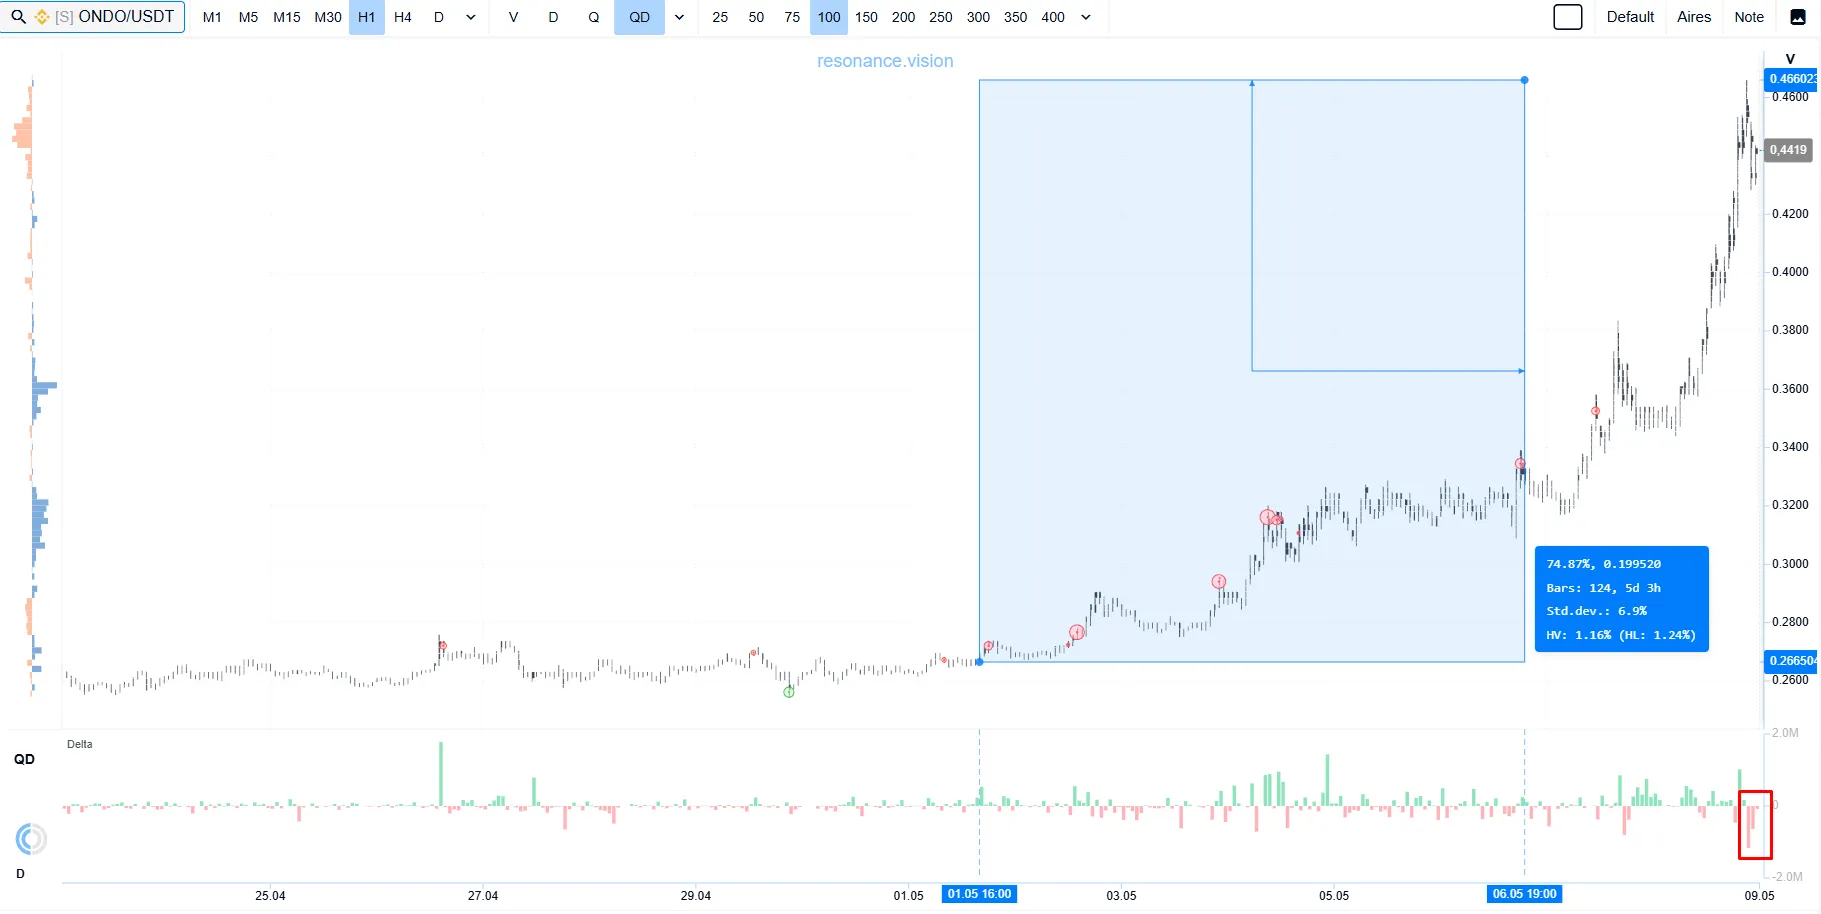
This dynamic indicated a decline in buyer efficiency and the re-emergence of sellers.
That is why taking profits in this zone looked like the most rational and balanced decision from a position management standpoint.
Conclusion
This breakdown shows that in market analysis, the key factor is not the mere presence of volume, but price reaction to that volume and the effectiveness of each side’s actions.
At the stage of identifying the entry point, despite the persistent dominance of market selling, the asset stopped making new lows. This pointed to seller weakening and the active absorption of that volume by limit buyers, which led to the formation of a deficit.
Additional confirmation came from the aggregated dashboard data: stronger limit buy orders, price holding within the range, and lower historical volatility, which is typical of an accumulation phase.
After the entry, the market delivered the expected upward move. However, as the impulse developed, signs of a structural shift began to appear: buyer efficiency was gradually declining, while the seller started to regain initiative, which showed up in the formation of a pullback.
Thus, the entry was based on signs of seller weakening and the formation of a local deficit, while the exit was based on declining buyer efficiency and growing risks of holding the position further. This is exactly what the Resonance approach is about: evaluating the market through the interaction of price and volume rather than through template signals. As a result, trading decisions become more grounded and more systematic over time.
Follow new insights in our telegram channel.
No need to invent complex schemes and look for the "grail". Use the Resonance platform tools.
Register via the link — get a bonus and start earning:
OKX | BingX | KuCoin.
Promo code TOPBLOG gives you a 10% discount on any Resonance tariff plan.
Recommended articles


