PEOPLE +21.9% (Resonance Directional Strategy)

📊 Trade on signs of local shortage: market selling dominates without breaking new lows, volume is absorbed by limit buyers, and an exit occurs after a statistically significant movement and increased volatility.
Table of contents

Asset: PEOPLE/USDT
Risk: medium
Level of understanding: beginner
Entry reasons
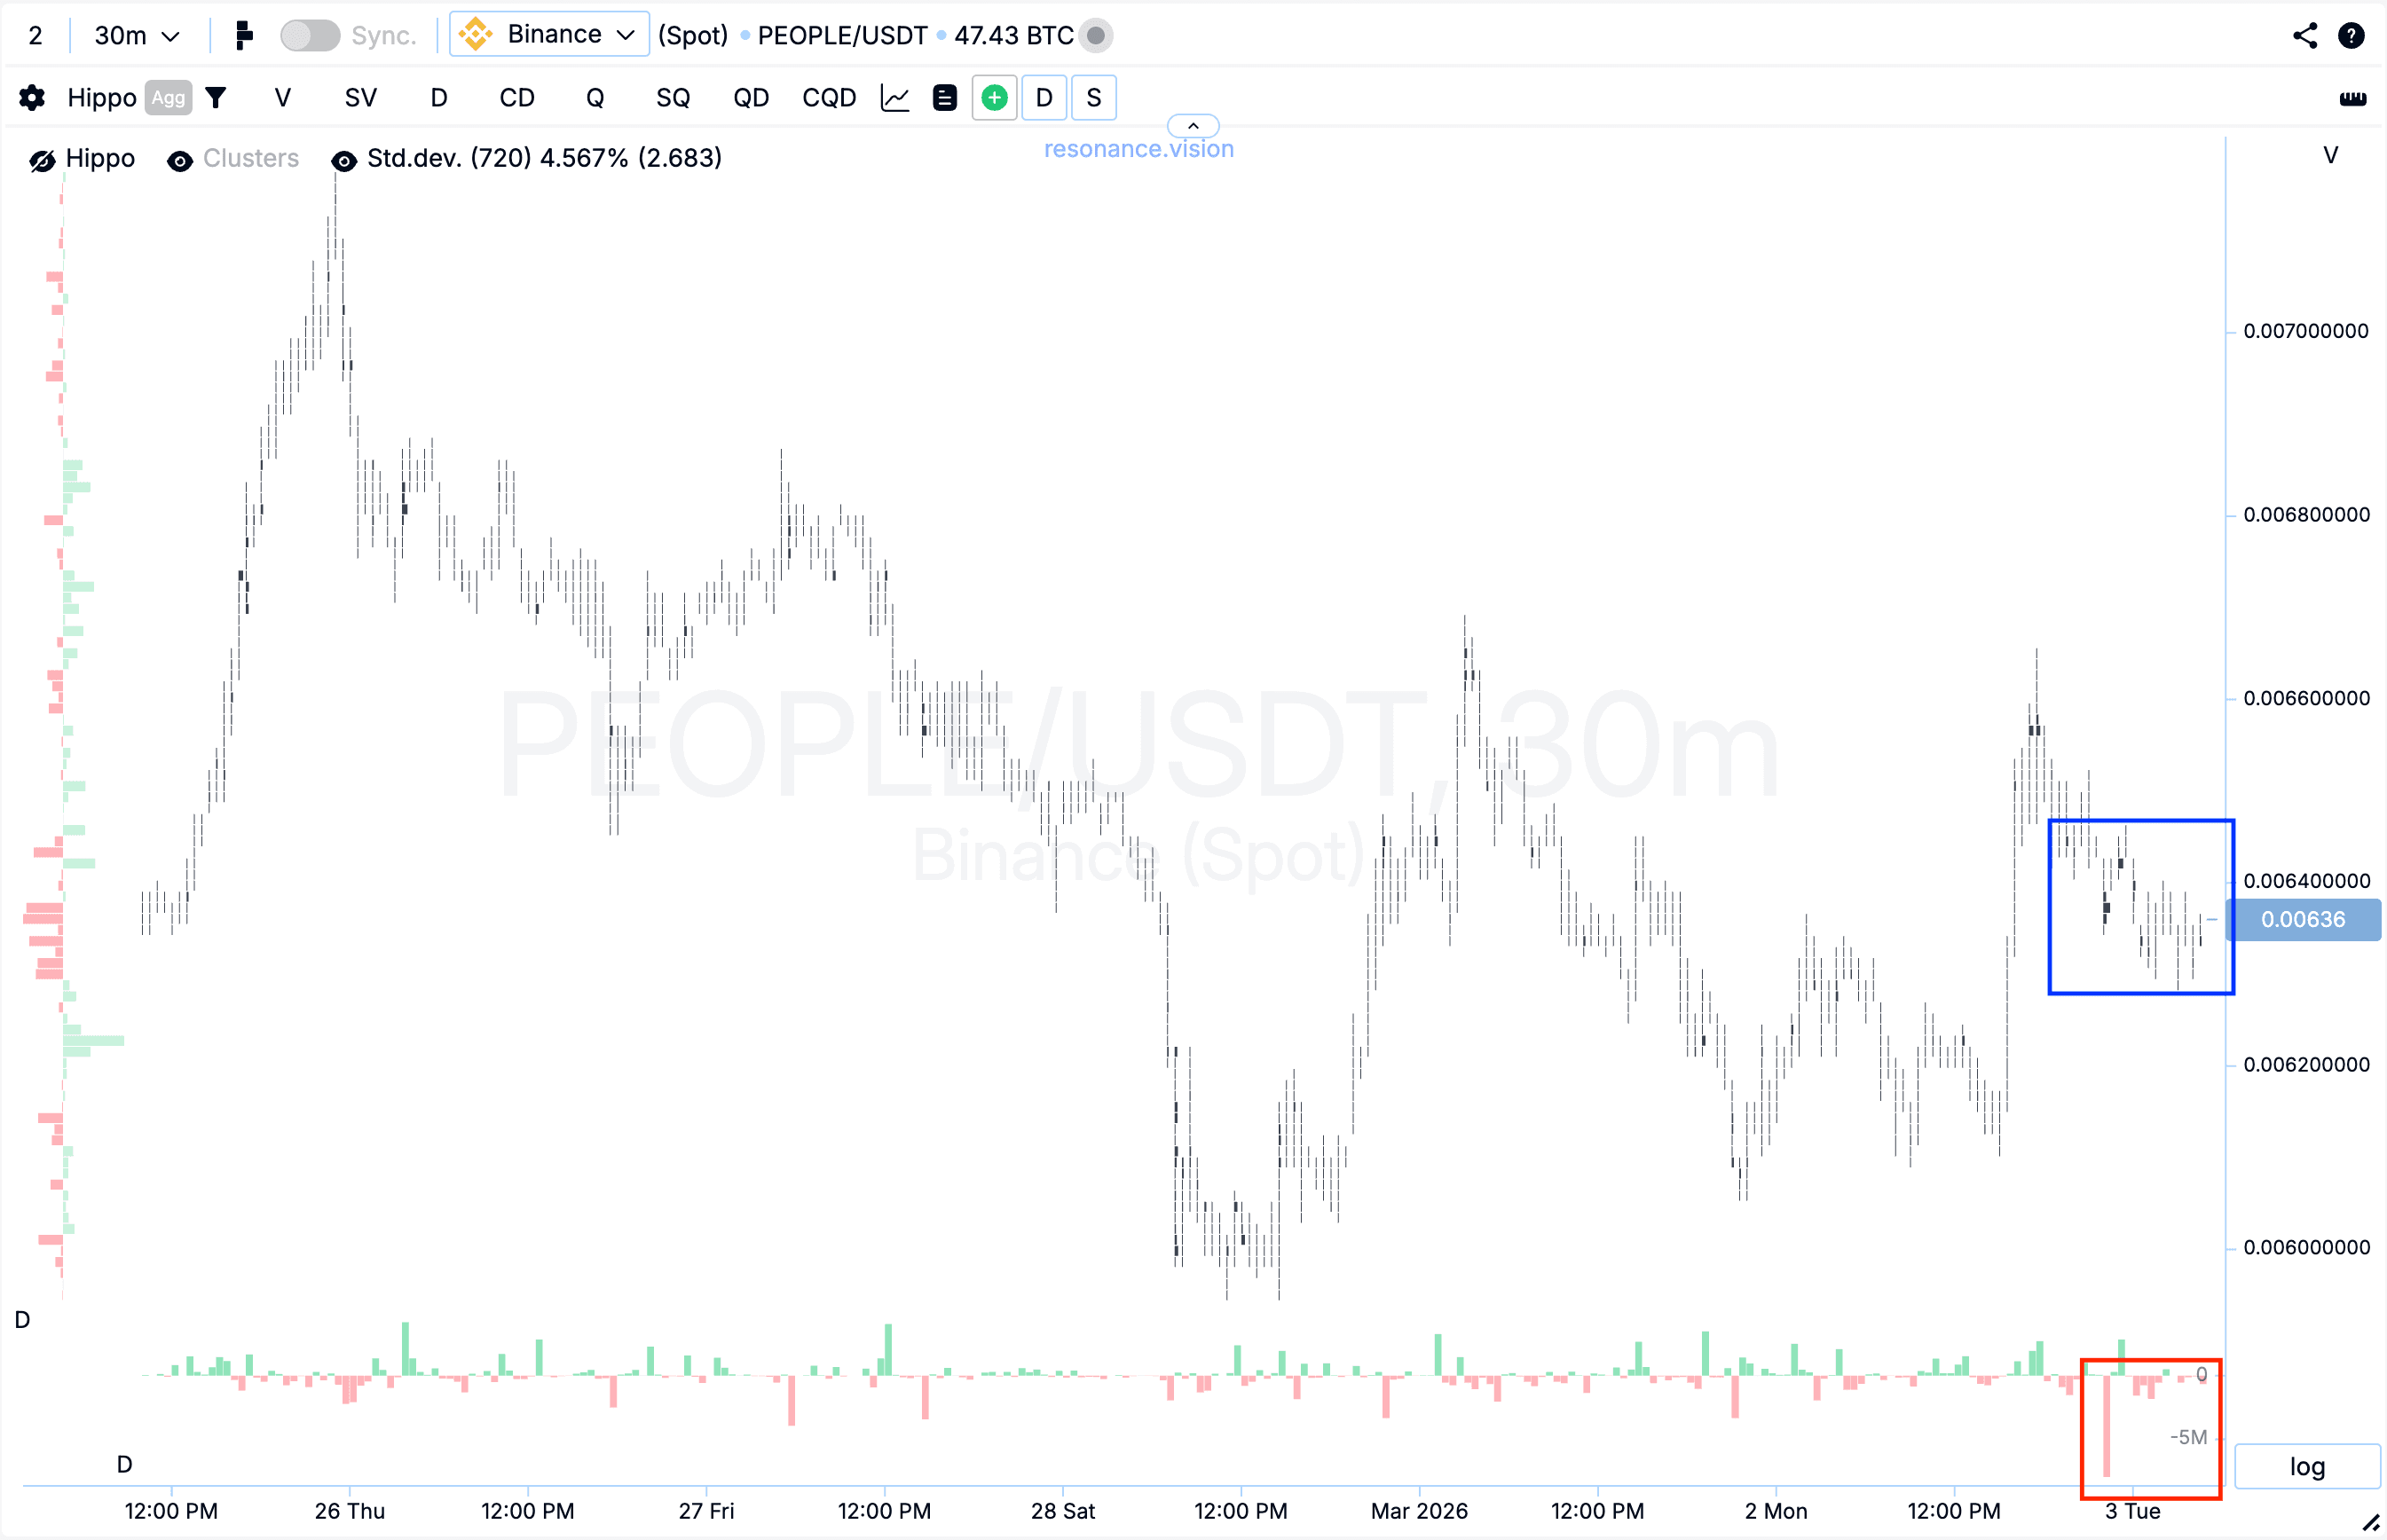
Cluster chart: during the final stage of the decline, relatively large volume clusters began to form (blue rectangle). Within these clusters, market sell orders clearly dominated (red rectangle).
However, despite the pronounced pressure from sellers, their efficiency noticeably decreased — the price stopped reacting with further decline.
Such a reaction indicates the formation of signs of a local deficit and weakening seller initiative. When significant selling volume stops pushing the price lower, it often becomes a signal of a possible shift in initiative.
In the Dashboard
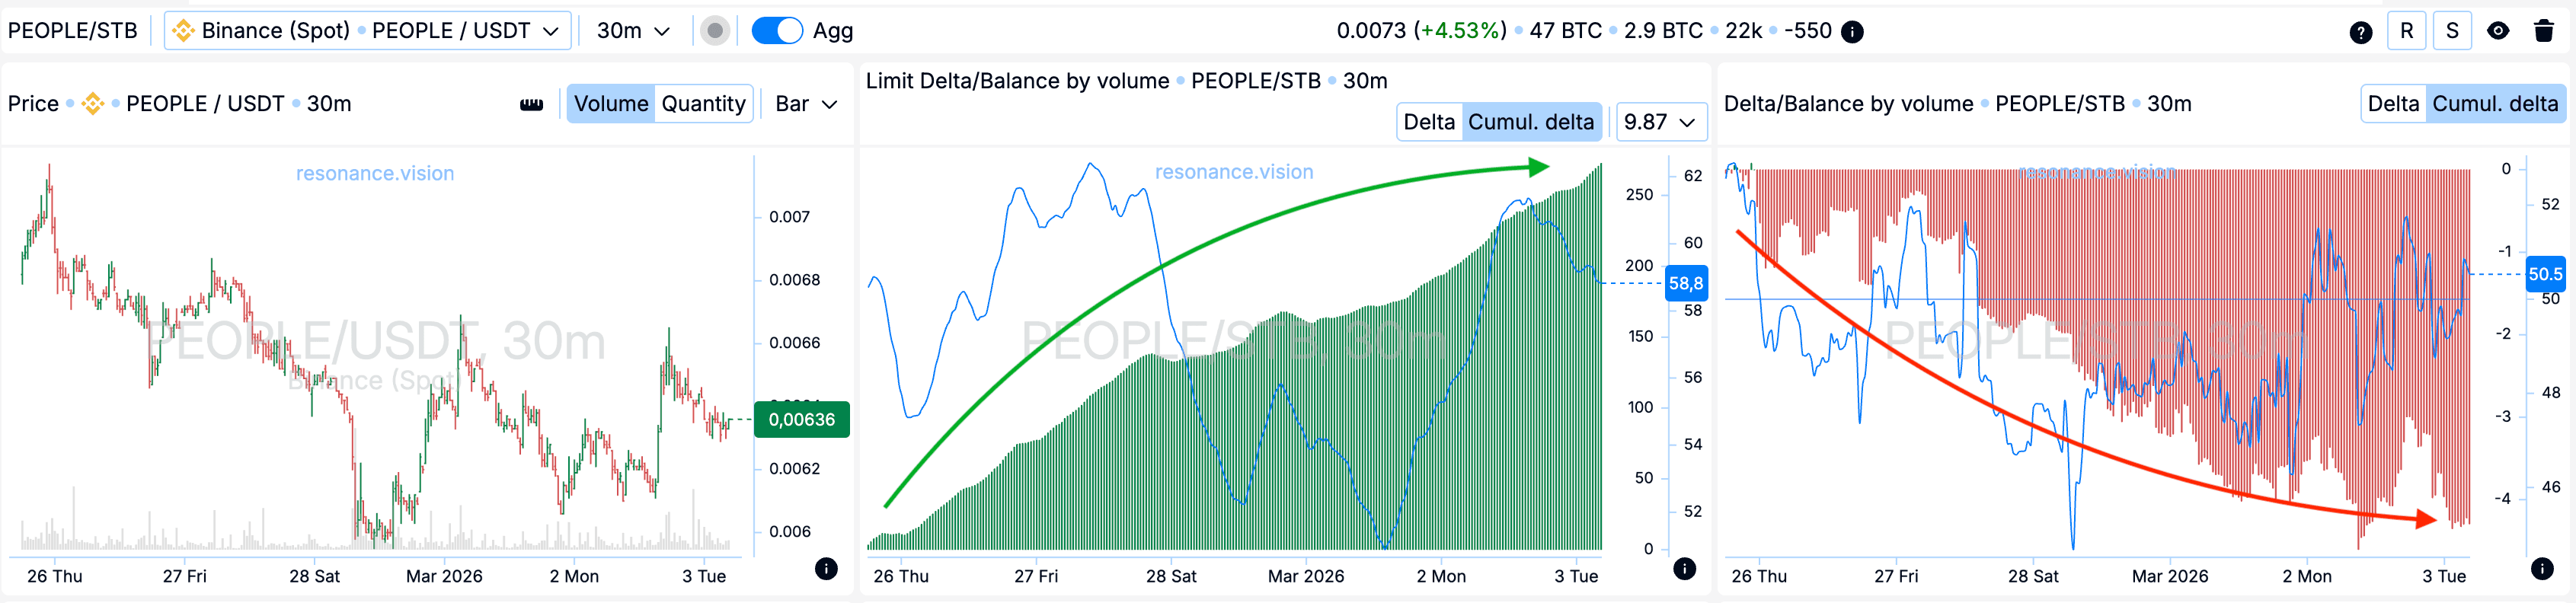
Delta / Volume balance and limit delta: during the analyzed period the market was under strong cumulative pressure from market sell orders, which is clearly visible on the cumulative delta histogram (red arrow).
At the same time, the limit delta shows a sustained cumulative increase in limit buy orders (green arrow). This combination indicates active absorption of incoming market sell volume by limit buyers.
As a result, local support is formed within the current price range, which further confirms the signs of a supply deficit.
Exit reasons
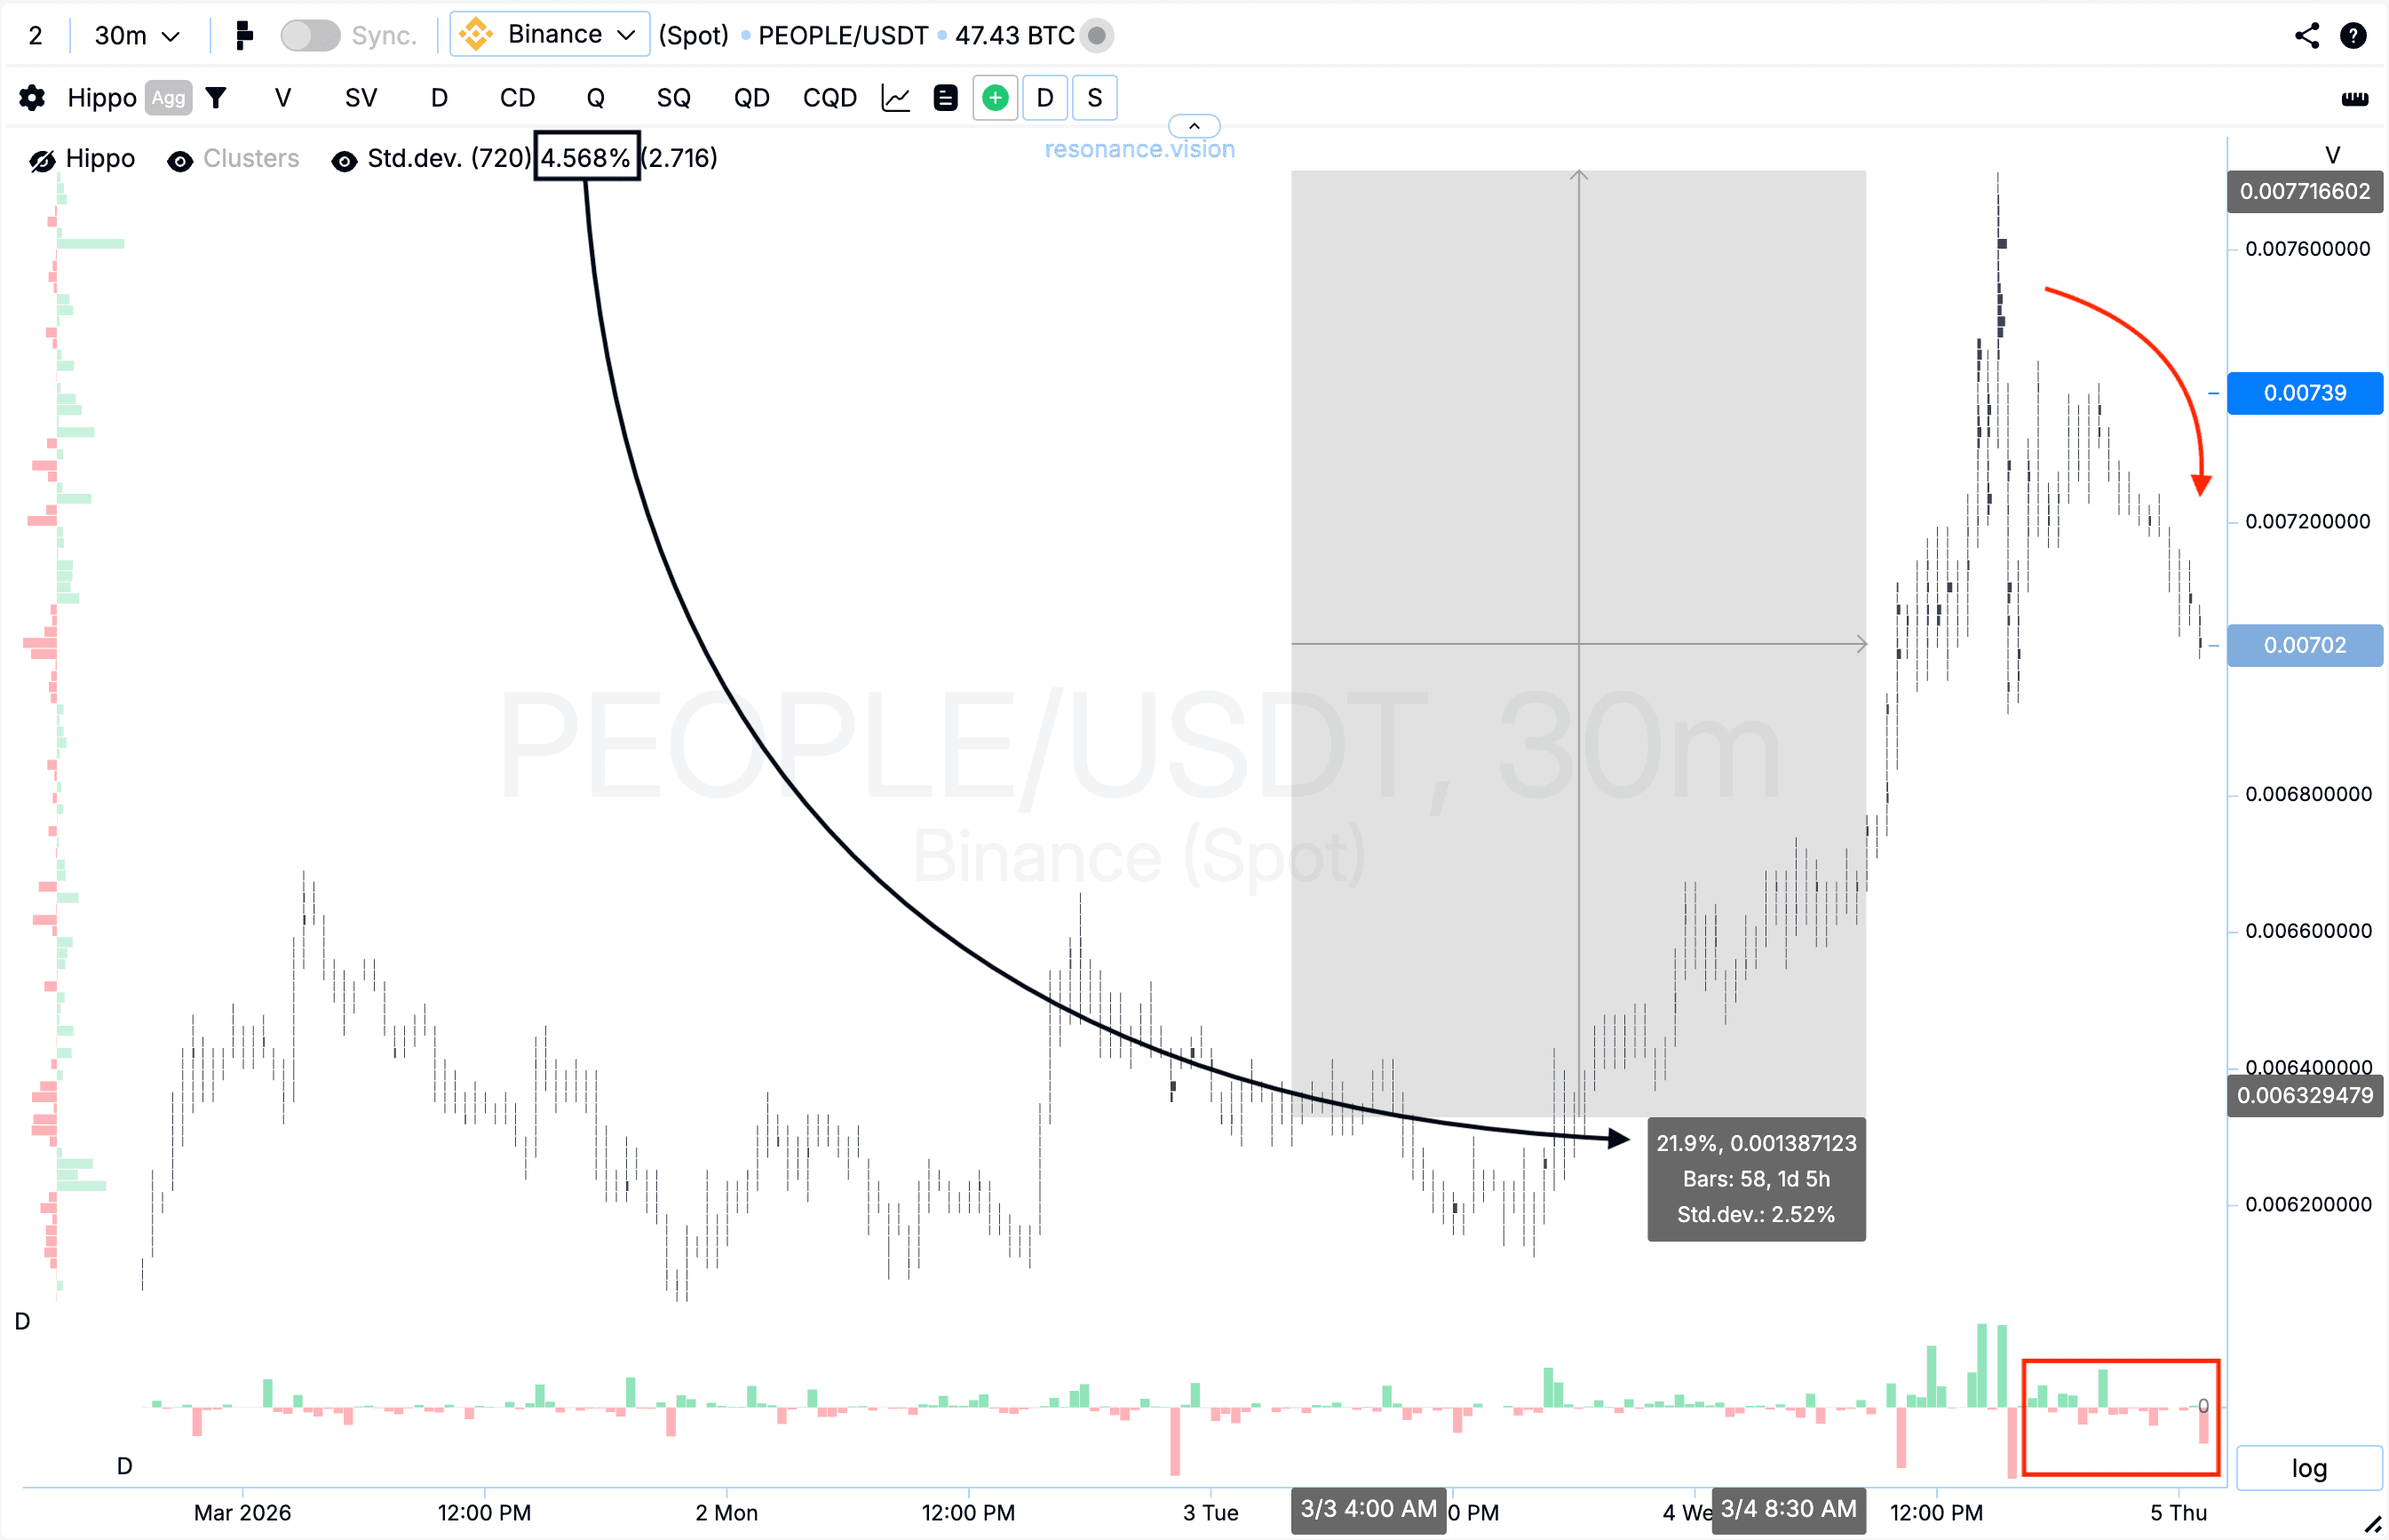
Cluster chart: from the entry point, the price moved more than 20%, which corresponds to nearly five standard price movements (black rectangle and arrow).
Against the backdrop of this move, volatility increased noticeably, after which a gradual pullback formed. At the same time, the delta shows that buying activity gradually shifted toward dominant market sell orders (red rectangle and arrow).
Such dynamics indicate decreasing buyer efficiency and growing market uncertainty. Under these conditions, further holding the position would involve increased risk, making profit-taking a logical and justified decision.
Conclusion
In this case, the key factor was not the magnitude of market selling itself, but the price reaction to that volume. Despite the dominance of market sell orders, the price stopped declining, indicating a decrease in seller efficiency and the formation of signs of a local deficit.
Additional confirmation came from aggregated market data, where growing market sell pressure was accompanied by a cumulative increase in limit buy orders. This structure indicated active absorption of incoming market volume and the formation of local support.
Such an approach allows traders not only to react to price movements but to systematically evaluate the interaction between volume and price, which significantly improves the quality of trading decisions.
Follow new insights in our telegram channel.
No need to invent complex schemes and look for the "grail". Use the Resonance platform tools.
Register via the link — get a bonus and start earning:
OKX | BingX | KuCoin.
Promo code TOPBLOG gives you a 10% discount on any Resonance tariff plan.
Recommended articles


