PEOPLE +27.2% (Resonance Directional Strategy)

A deal analysis based on supply and demand analysis using volumes. This article examines how signs of local shortages and the absorption of market sales by limit buyers allowed us to determine the entry point, while changes in the effectiveness of price action allowed us to lock in profits in a timely manner.
Table of contents

Asset: PEOPLE/USDT
Risk: medium
Level of understanding: beginner
Entry reasons
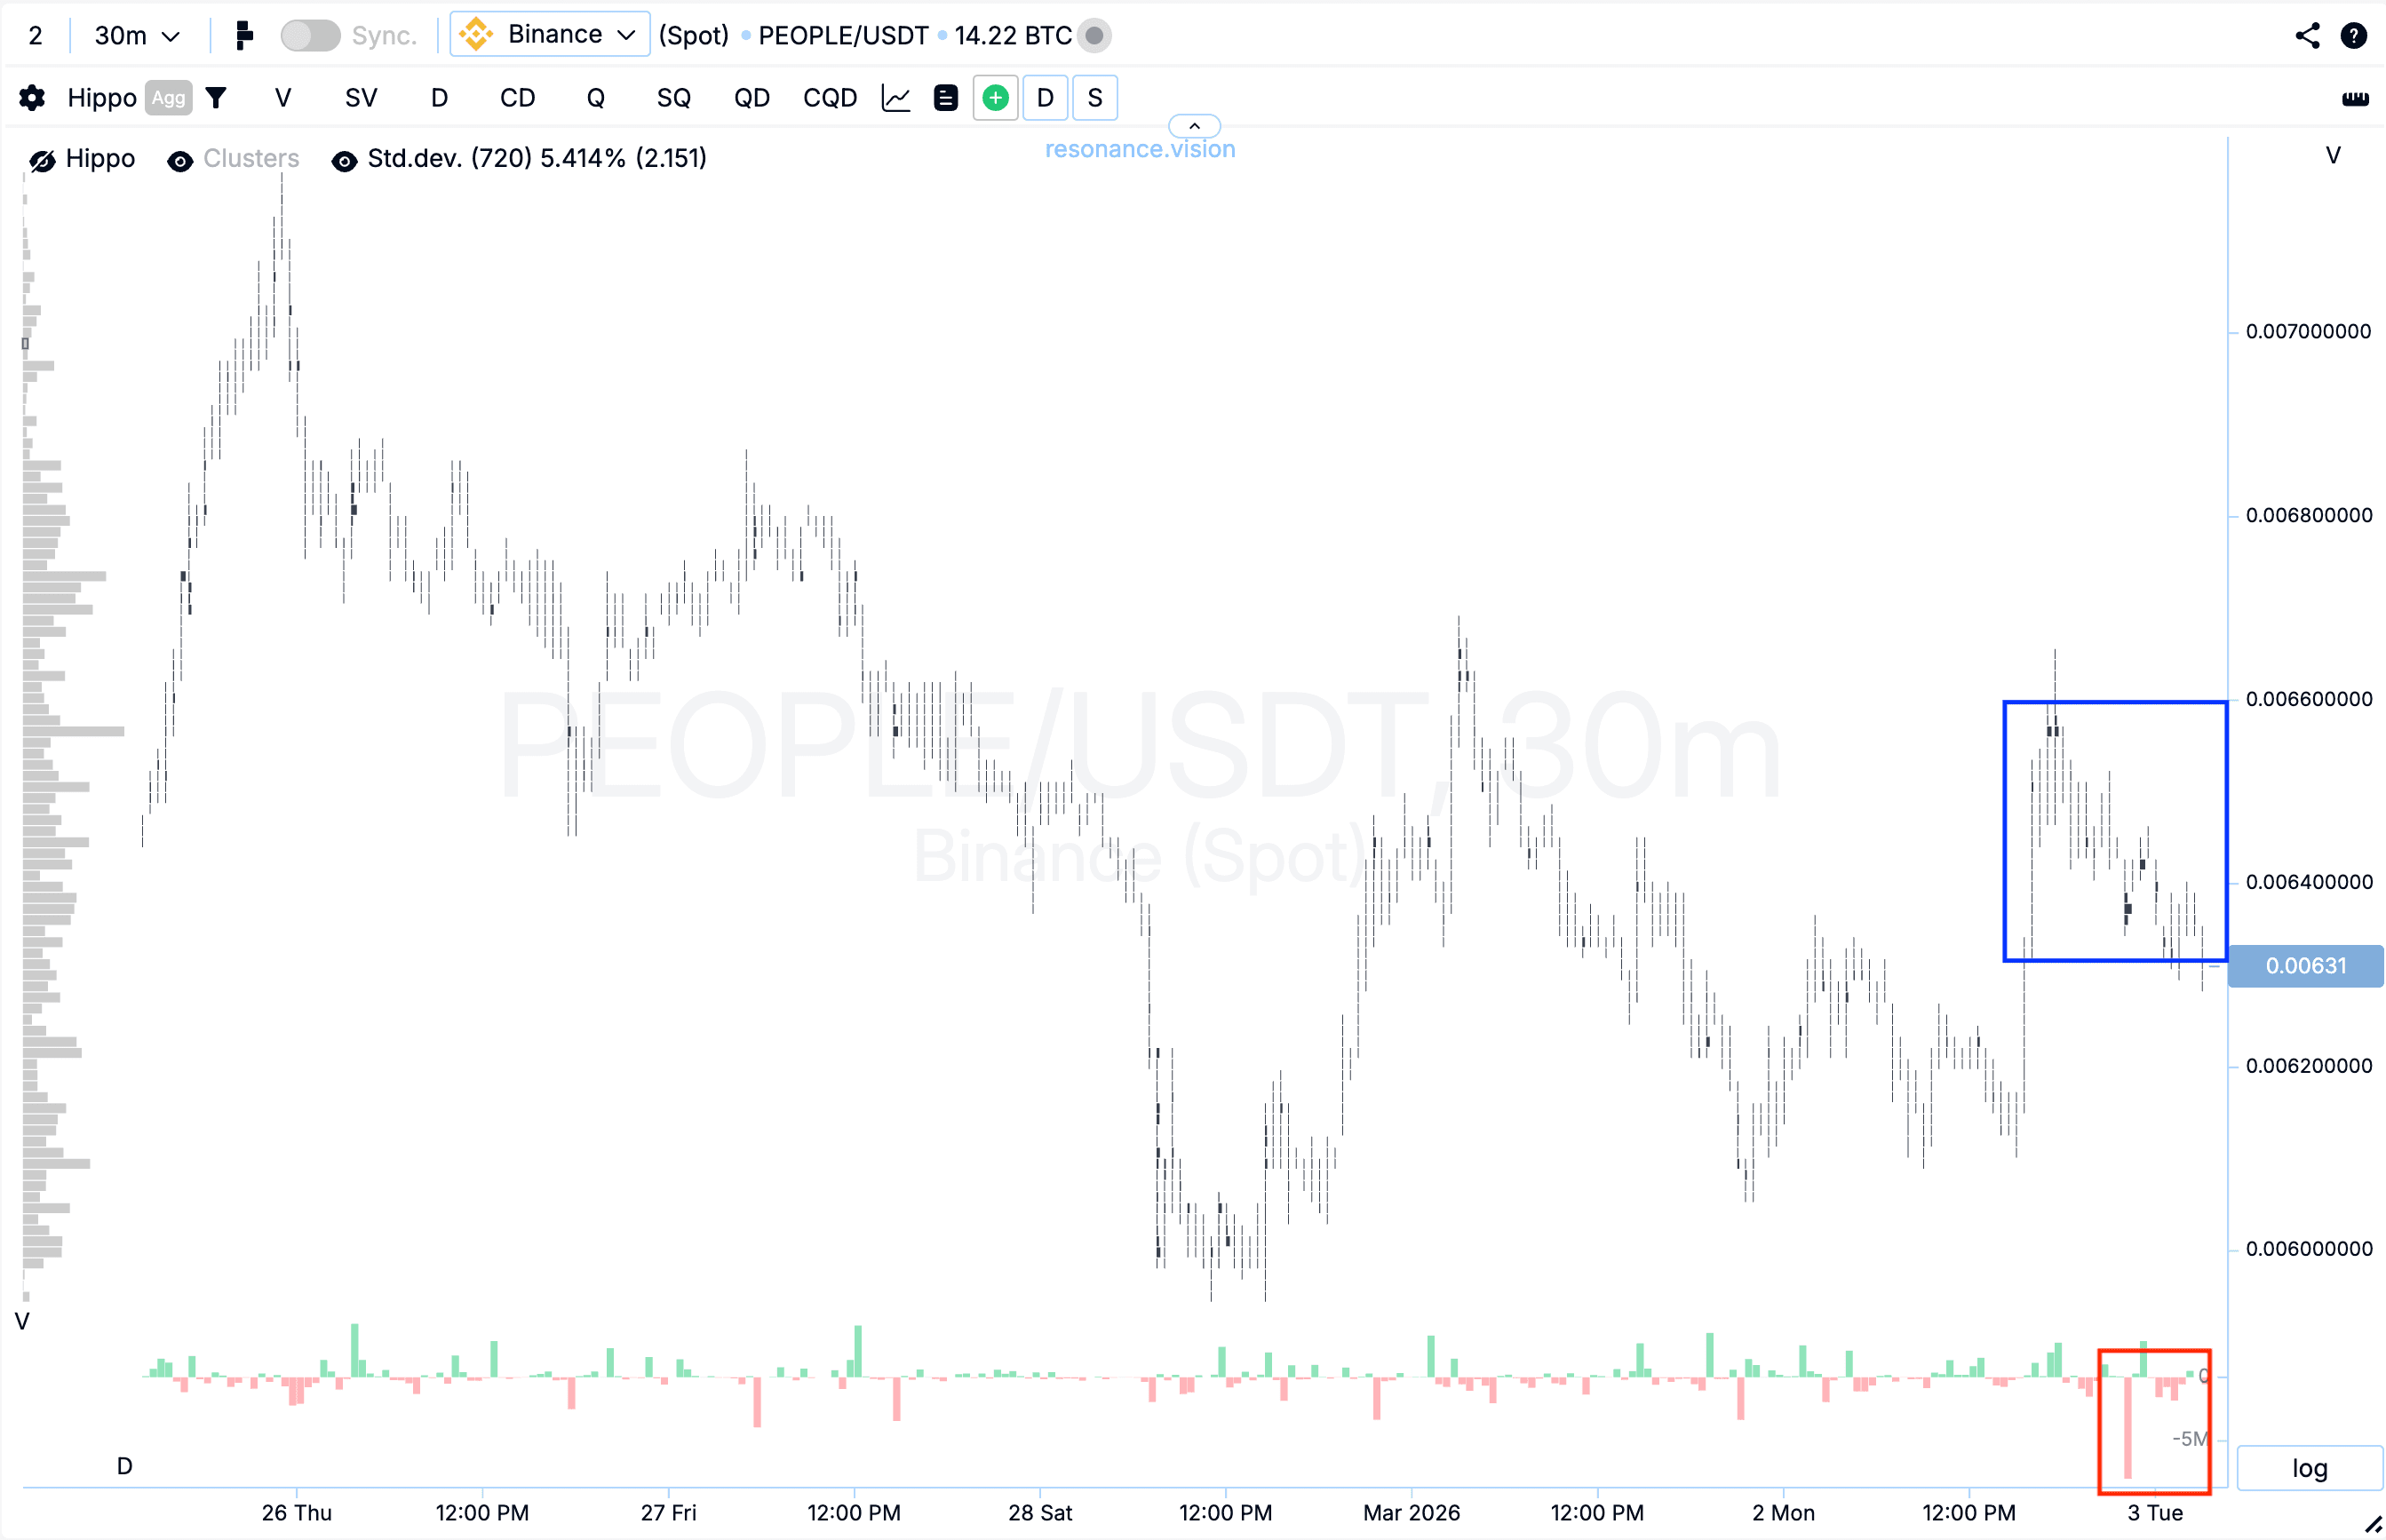
Cluster chart: within a sideways range, relatively large volume clusters began to form (blue rectangle). Inside these clusters, market sell orders clearly dominated (red rectangle).
However, despite the pronounced pressure from sellers, their efficiency gradually decreased — the price stopped reacting with further downside movement.
Such market behavior indicates the formation of signs of a local deficit and weakening seller initiative. When significant volumes of market selling stop pushing the price lower, it often acts as an early signal of a possible shift in initiative or the formation of a local reversal.
In the Dashboard
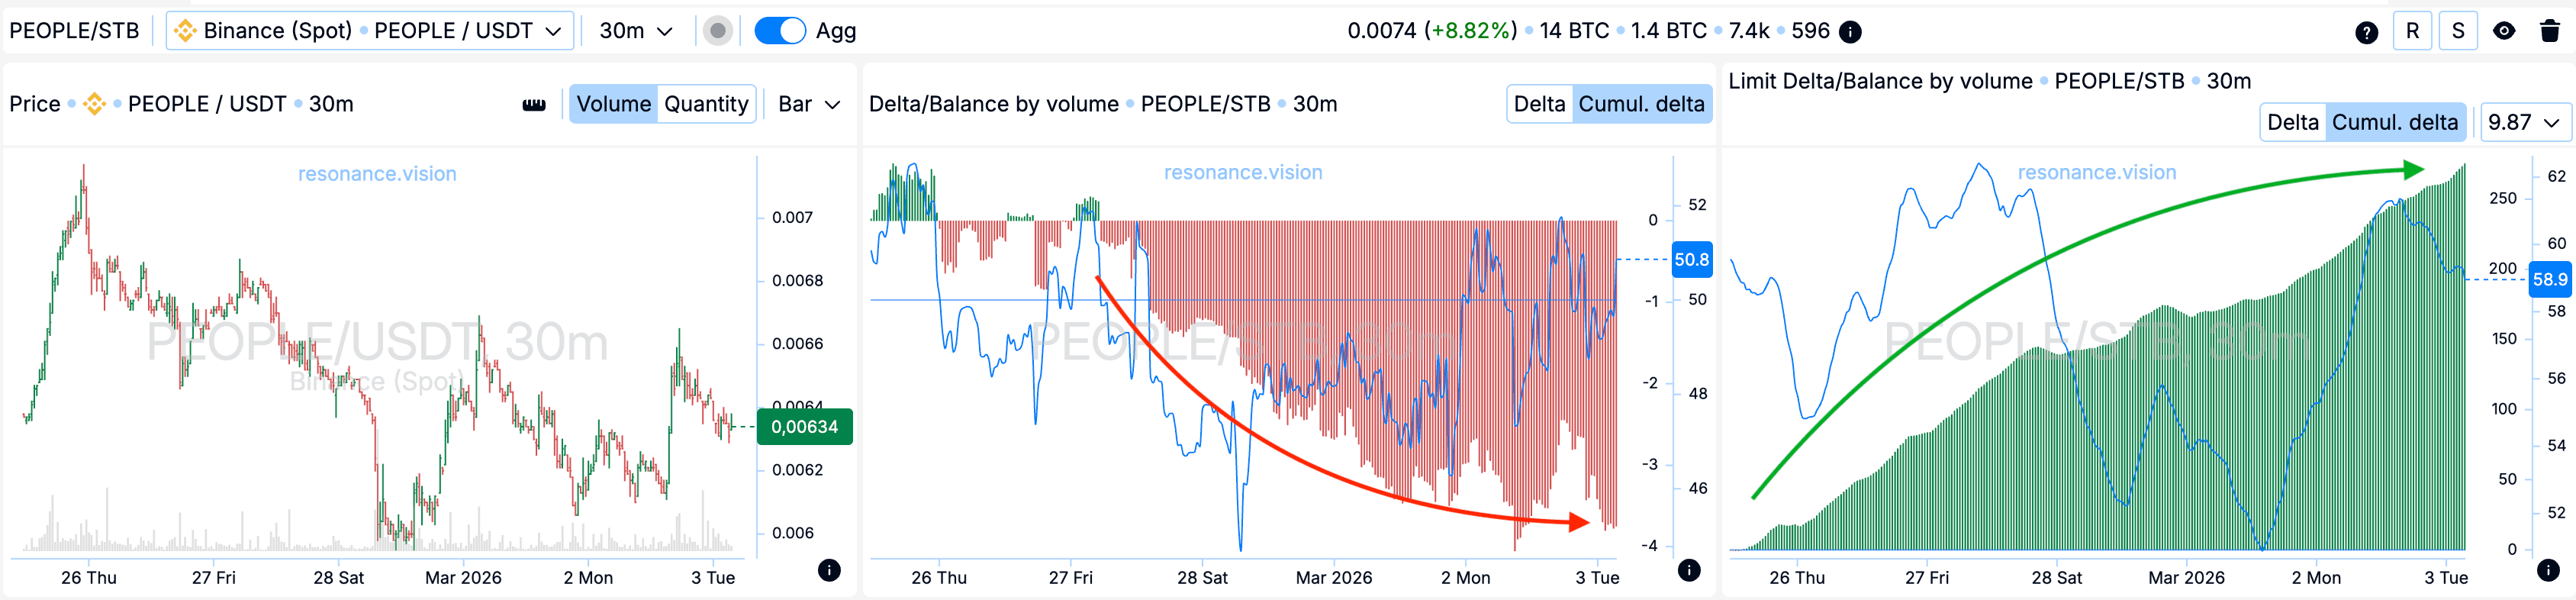
Delta / Volume balance and limit delta: data aggregated across all pairs and exchanges also confirms the observations from the cluster chart. During the analyzed period, the market was under sustained cumulative pressure from market sell orders, which is clearly reflected in the cumulative delta histogram (red arrow).
At the same time, the limit delta showed a prolonged cumulative increase in limit buy orders (green arrow).
Such a combination indicates active absorption of incoming market sell volume by limit buyers. As a result, local support is formed within the current price range, which further confirms the emergence of signs of a deficit.
Exit reasons
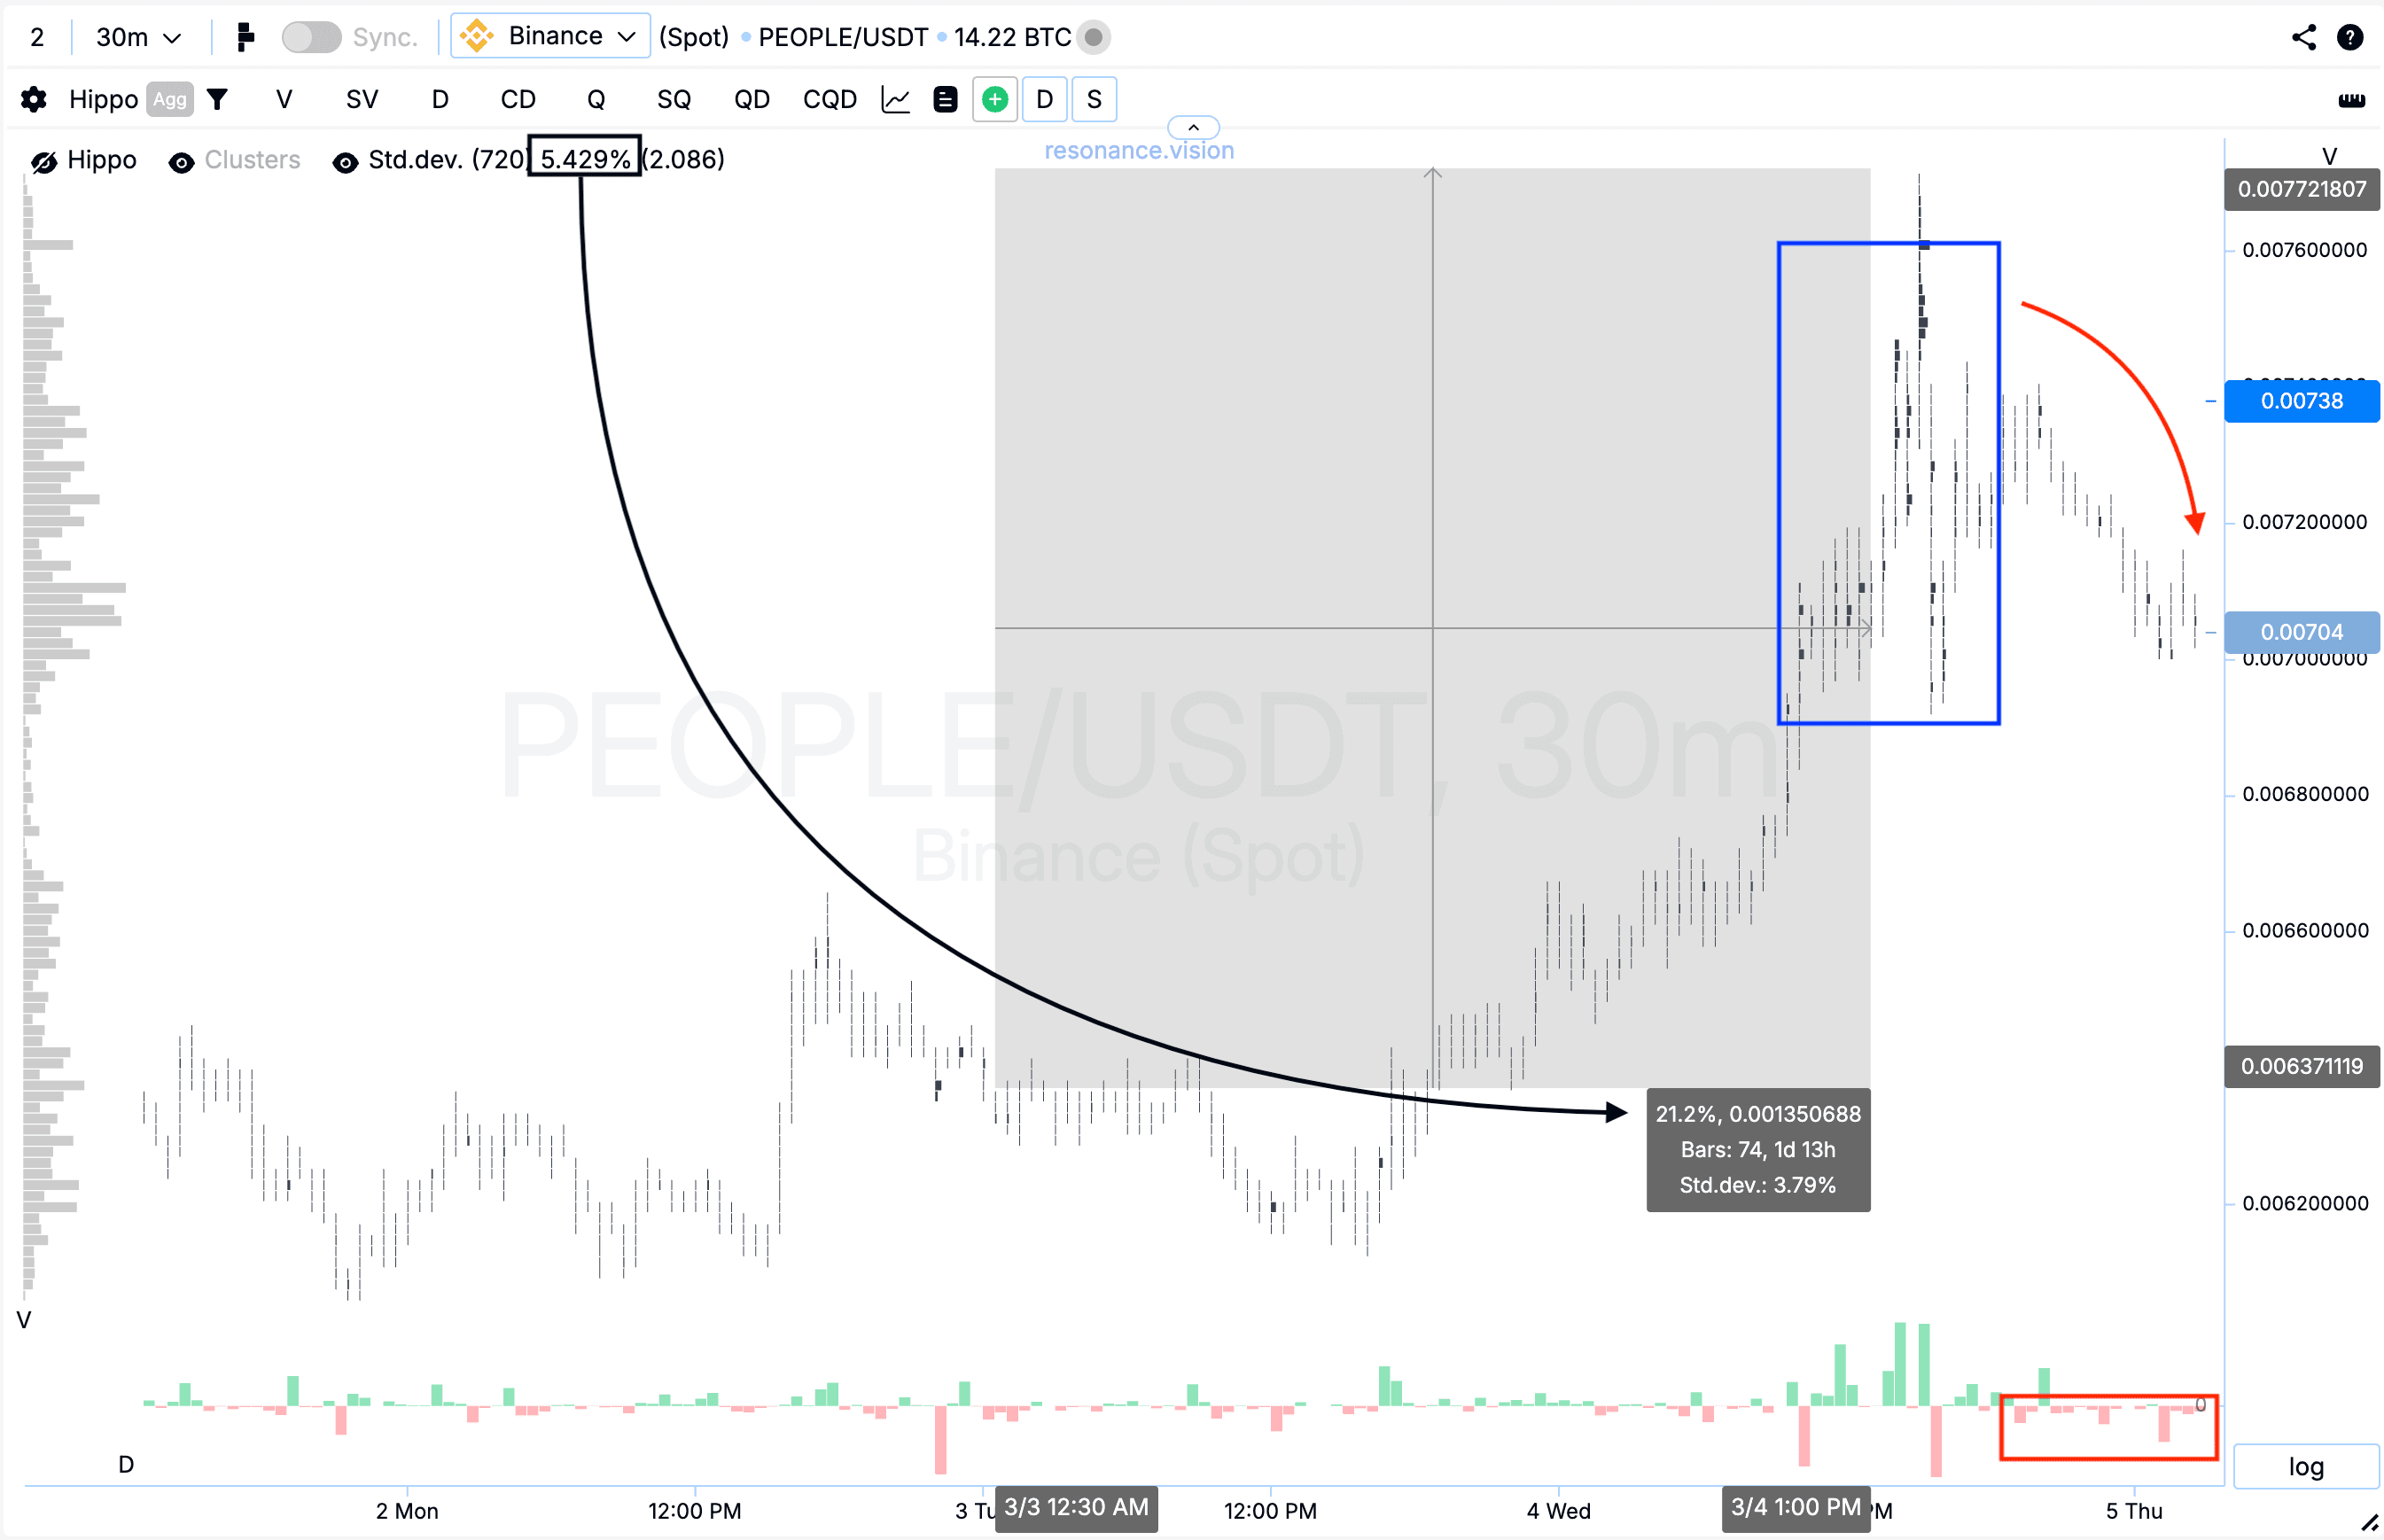
Cluster chart: from the entry point, the price moved more than 20%, which corresponds to nearly four standard price movements (black rectangle and arrow), considering that one standard movement equals 5.429%.
At this stage of growth, volume clusters began to form and volatility increased noticeably (blue rectangle).
After that, market orders gradually began shifting toward a dominance of selling, and the price started to decline (red rectangle and arrow), indicating the restoration of seller efficiency within the current zone.
Such dynamics indicate decreasing buyer efficiency and increasing risk of further position holding. Under these conditions, profit-taking appears to be a logical and justified decision.
Conclusion
The situation considered clearly demonstrates how the analysis of supply and demand through volume allows traders to identify changes in market structure even before they become obvious on a regular price chart.
Despite significant pressure from market sellers, the price stopped reacting with further declines. This indicated the emergence of signs of a local deficit and active absorption of market sell orders by limit buyers. Additional confirmation came from dashboard data, where persistent market sell pressure was combined with a cumulative increase in limit buy orders.
After the entry, the price realized the expected movement, forming a growth of more than 20%. As the move developed, signs of decreasing buyer efficiency began to appear: volatility increased, new volume clusters began to form, and market orders gradually shifted toward a dominance of selling. This indicated growing seller activity and increased risks of further holding the position.
Thus, monitoring changes in the efficiency of market orders and the price reaction to volume allows traders to timely identify both the formation of a deficit and signs of its exhaustion. Such an approach helps to systematically work with states of deficit and surplus by evaluating not just volume itself, but its impact on price, which significantly improves the quality of trading decisions over the long term.
Follow new insights in our telegram channel.
No need to invent complex schemes and look for the "grail". Use the Resonance platform tools.
Register via the link — get a bonus and start earning:
OKX | BingX | KuCoin.
Promo code TOPBLOG gives you a 10% discount on any Resonance tariff plan.
Recommended articles


