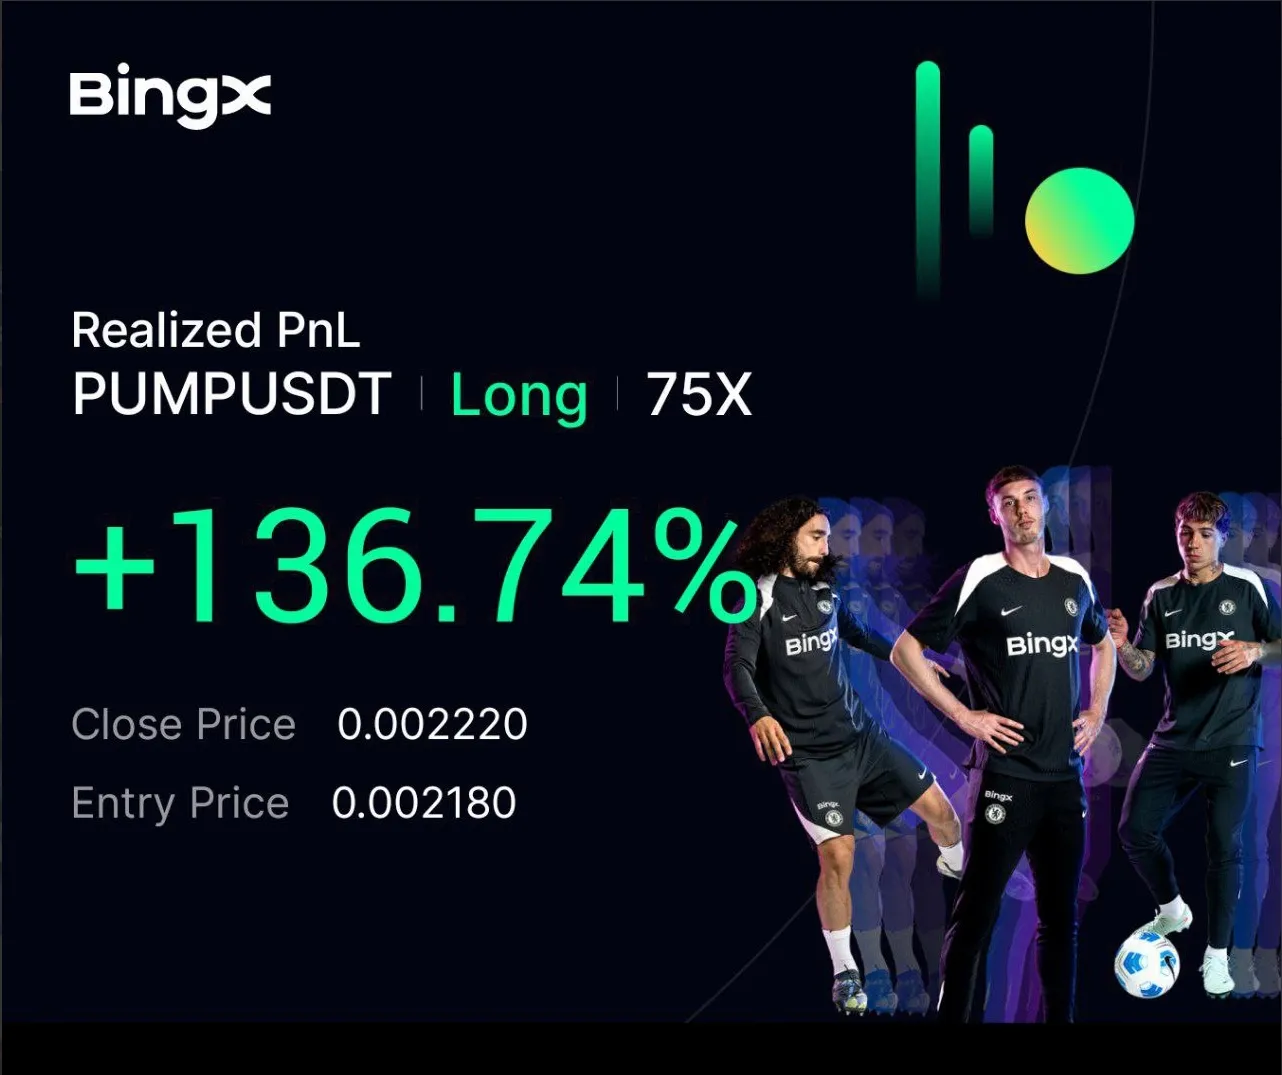
PUMP +136.74% (Resonance Directional Strategy)

How supply/demand analysis helps in day trading: instead of guessing reversals, we measure how volume impacts price and validate the idea with reliable data.
Table of contents

Let’s look at a day trading case study built on supply and demand analysis — a short intraday trade in PUMP. The main goal was to capture a local move. The key trigger was selling on the 30-minute timeframe that stopped pushing price lower.
Entry reasons
Cluster chart
On the 30m timeframe, there were large market sells (red rectangle), yet price stopped reacting with further downside.
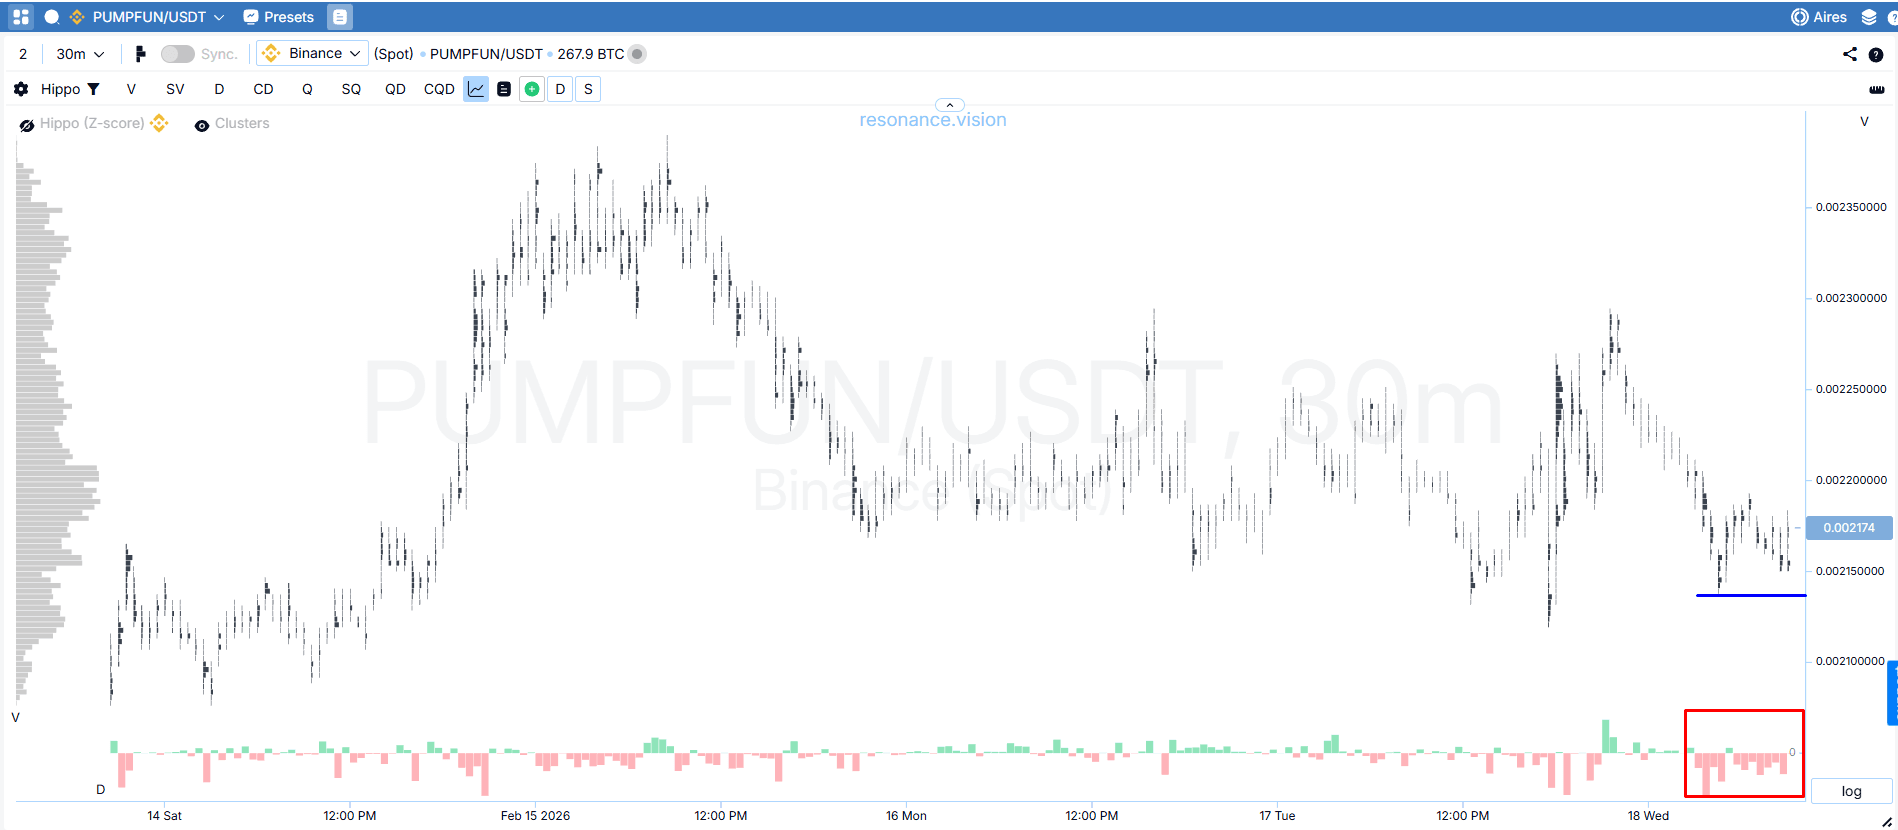
This points to the presence of a limit buyer absorbing opposing supply. When aggressive selling fails to produce follow-through lower, it often signals that the seller is weakening and the odds of a local bounce increase.
Using crypto cluster analysis, we evaluate how price reacts to traded volume — an edge that many other crypto analysis methods simply don’t provide.
Now let’s move to the m5 timeframe. Here you can see that market sells stop printing new local lows (red rectangles).
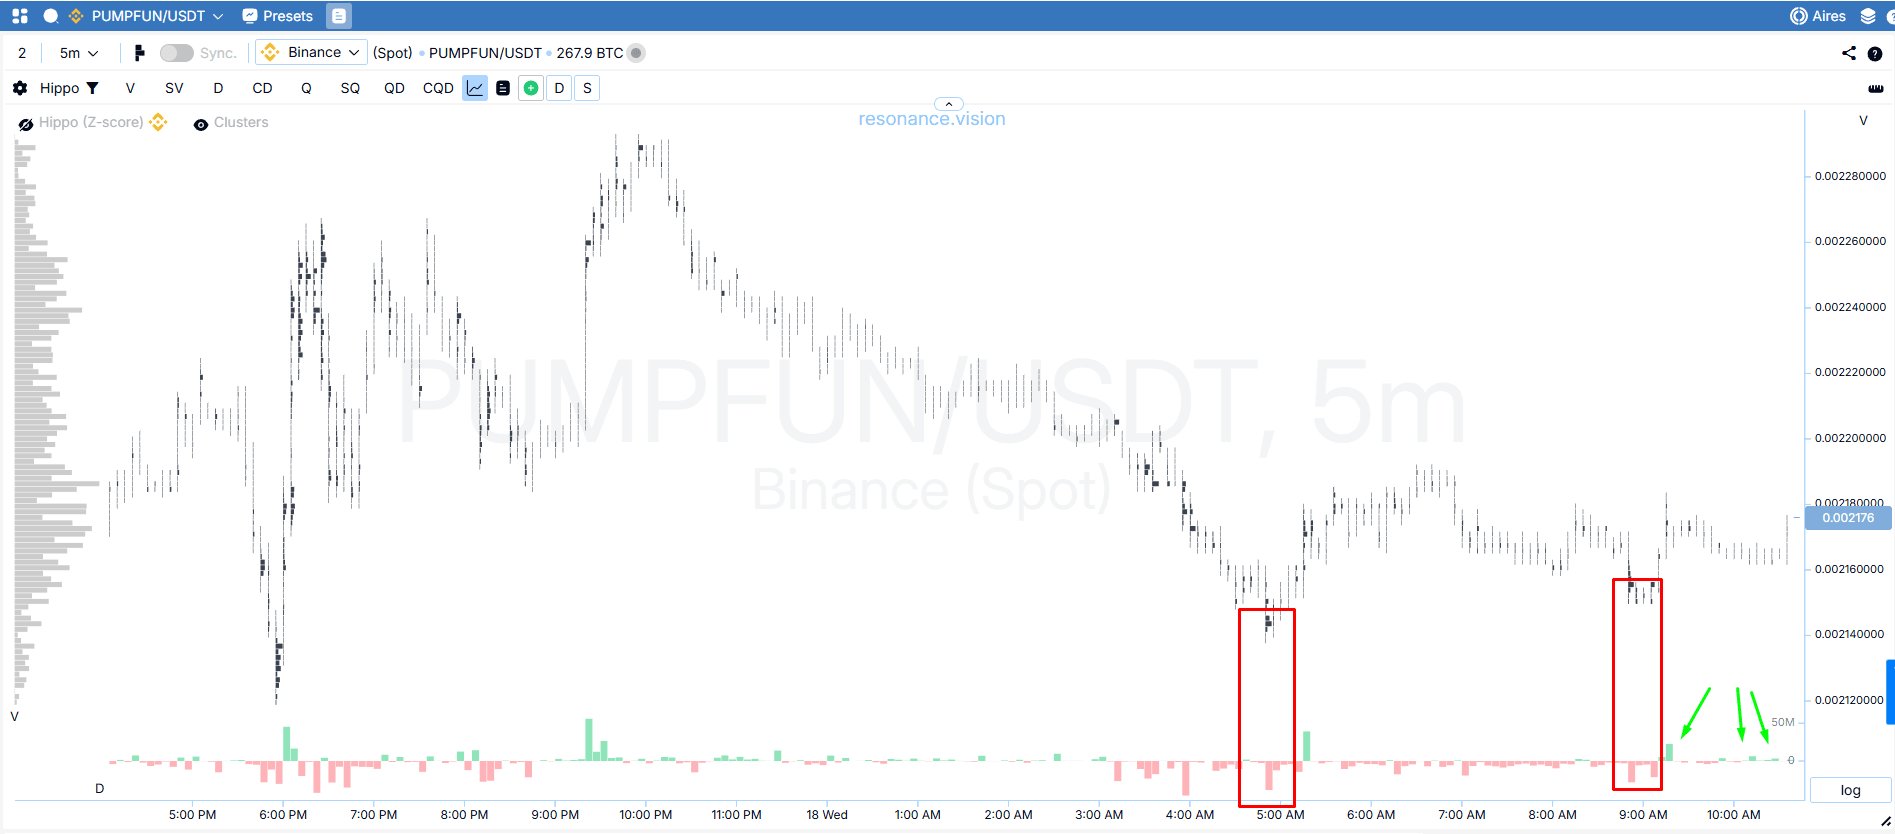
At the same time, small buys start appearing, and price responds by moving higher (green arrows). This confirms that initiative is gradually shifting to the buyer.
That’s what a local deficit looks like: selling is present, but price is no longer falling.
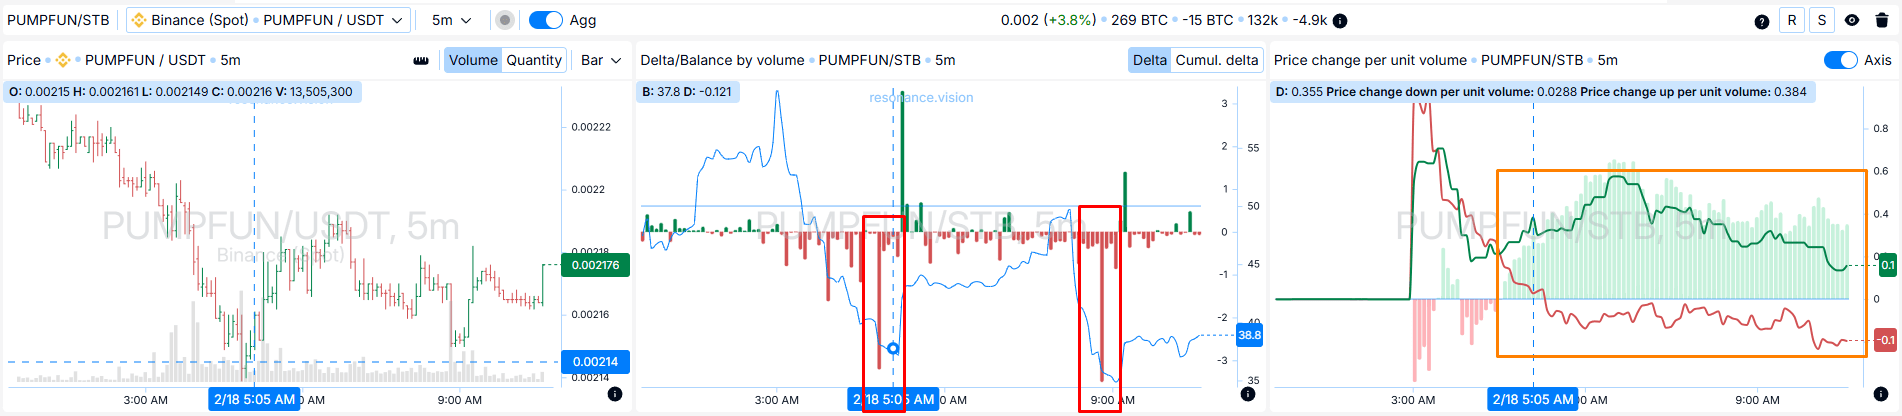
Dashboard: aggregated metrics
Delta / volume balance:
Across aggregated data for all pairs, supply is being absorbed by a limit buyer (red rectangles). Seller pressure remains, yet price stops responding with a drop.
Price change per unit of volume:
The impact efficiency of market orders shifts in favor of buyers (orange rectangle). This indicates improving buy efficiency.
In practice, aggregated metrics are part of volume analysis in trading: price responds better to market buys than to sells.
Exit reasons
Cluster chart: the efficiency of the buyer’s market volume (green arrow) starts to decline. Buys are still coming in, but price isn’t moving higher. Dense volume clusters begin to appear (blue rectangle).
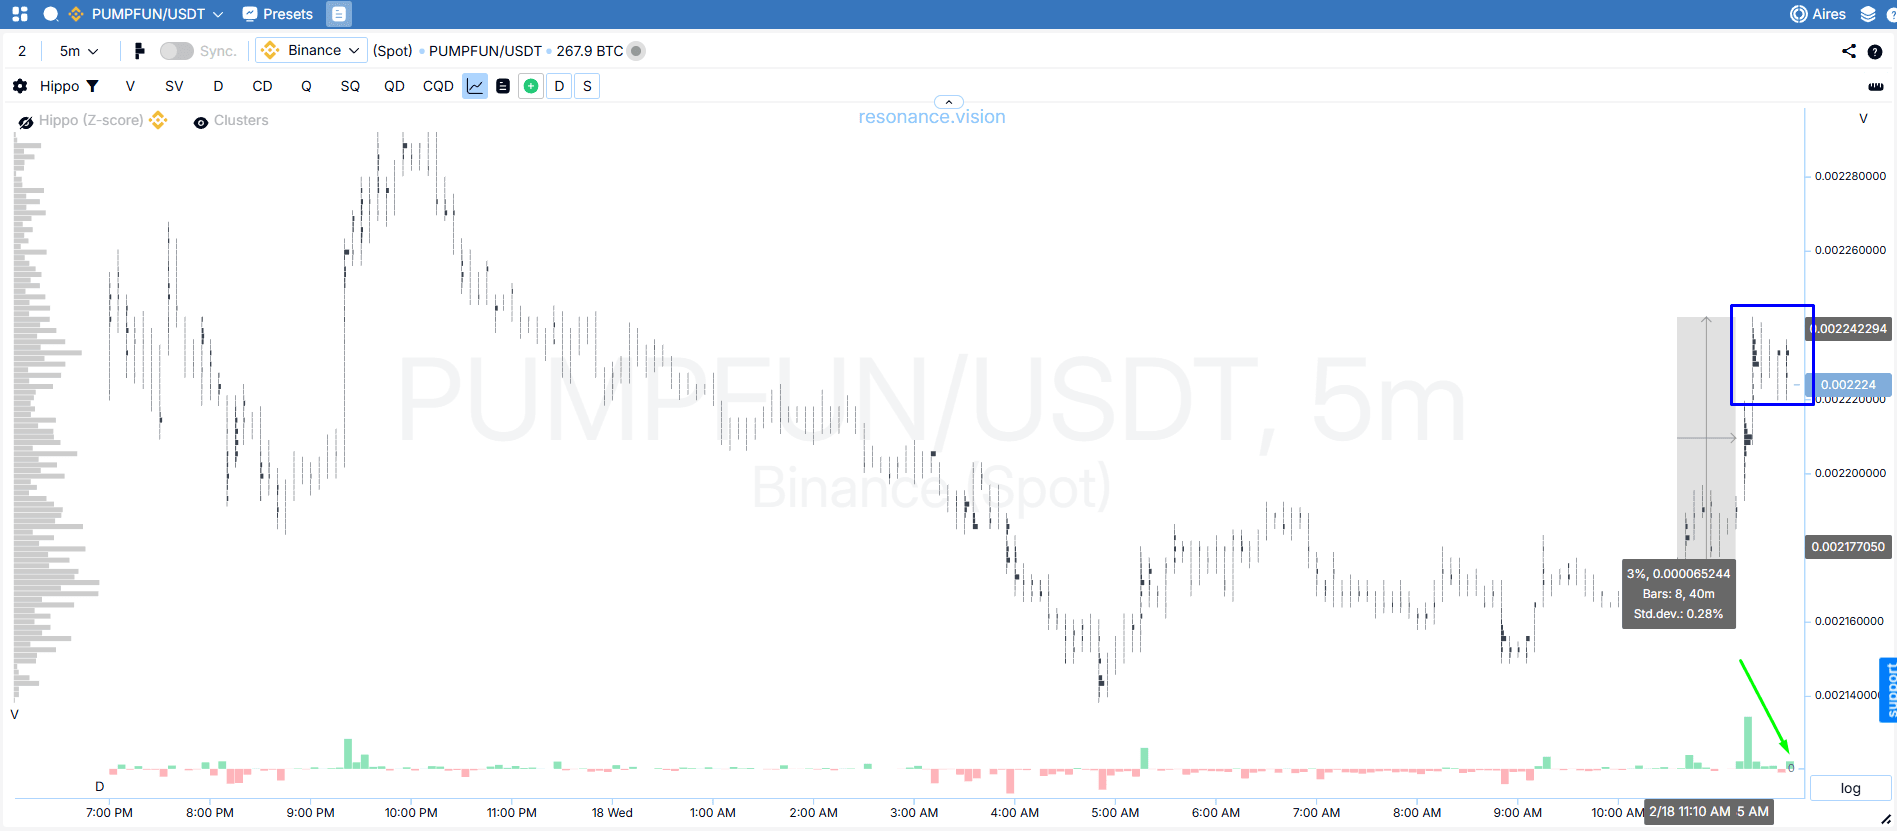
After the rise, opposing supply starts to form, which increases the likelihood of a stall or a correction — so the decision was made to take profit and close the position.
Summary
The core idea was to trade the moment when aggressive selling stopped pushing price down while buy efficiency began to improve. As a result, we captured roughly a 2% intraday move.
This case highlights the advantage of supply and demand analysis over typical technical “signals”: we weren’t guessing a reversal or hunting for a pattern — we were measuring how effectively volume was impacting price.
Resonance helps you quickly and credibly determine whether there are solid reasons to open a position. With the combined use of tools (clusters + aggregated metrics), your entry and exit decisions become well-grounded:
- Objectivity over interpretation. You rely on volume data rather than subjective patterns. This reduces emotions and “storytelling” in your decisions.
- Testing the idea, not believing it. Any hypothesis can be validated with a set of signals (pressure efficiency, level holding, activity distribution) to separate a real edge from a random spike.
- Clear risk and disciplined execution. When you know where the trade logic breaks, it’s easier to choose protection levels and profit-taking rules. That makes trades repeatable and the process manageable.
That’s why the supply/demand approach — together with the platform’s tools — is so effective for day trading: less guessing, more cause-and-effect reasoning, and higher-quality decisions.
In the end, the platform helps you do more than “see the move” — it helps you understand why it happens.
Follow new insights in our telegram channel.
No need to invent complex schemes and look for the "grail". Use the Resonance platform tools.
Register via the link — get a bonus and start earning:
OKX | BingX | KuCoin.
Promo code TOPBLOG gives you a 10% discount on any Resonance tariff plan.
Recommended articles


