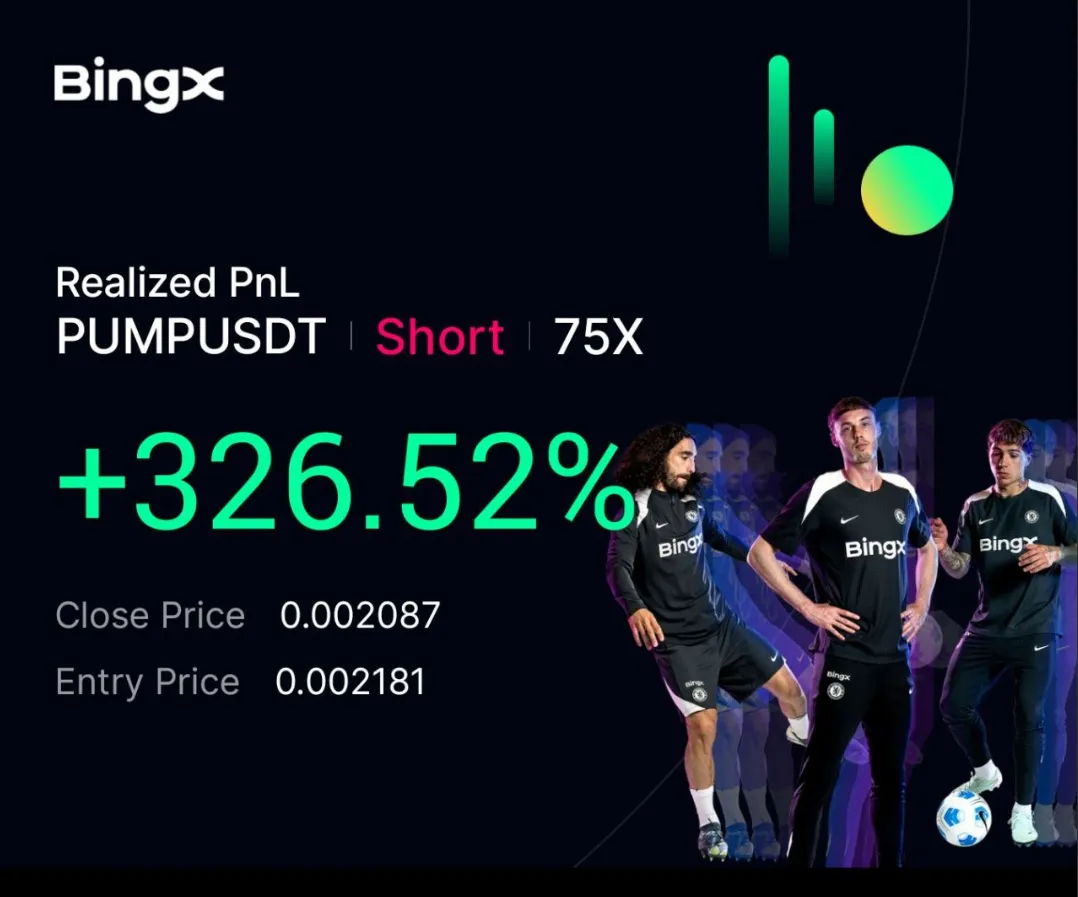
PUMP +326.52% (Resonance Directional Strategy)

A breakdown of a short trade after an impulsive rally: how to use the cluster chart and aggregated metrics to spot weakening buyer efficiency, identify the formation of surplus, and lock in the position with clear justification.
Table of contents

After a strong impulse move, the market often looks as if the rally could continue: the buyer is active, volume is going through, and price is holding near the highs. But in moments like this, the cluster chart and volume analysis often reveal a very different picture. Aggressive buying is still present, yet price no longer confirms its effect. In supply and demand analysis, this is one of the earliest signs that buyer initiative is weakening and a local surplus is beginning to form in the market.
This is exactly the trade setup we are breaking down in this example. On the surface, the asset still looked strong after the impulse, but inside the move, limit supply had already appeared and was capping further growth. Let’s look at how the cluster chart, volume analysis, and aggregated metrics helped identify this shift early and uncover a short idea through the Screener.
Entry reasons
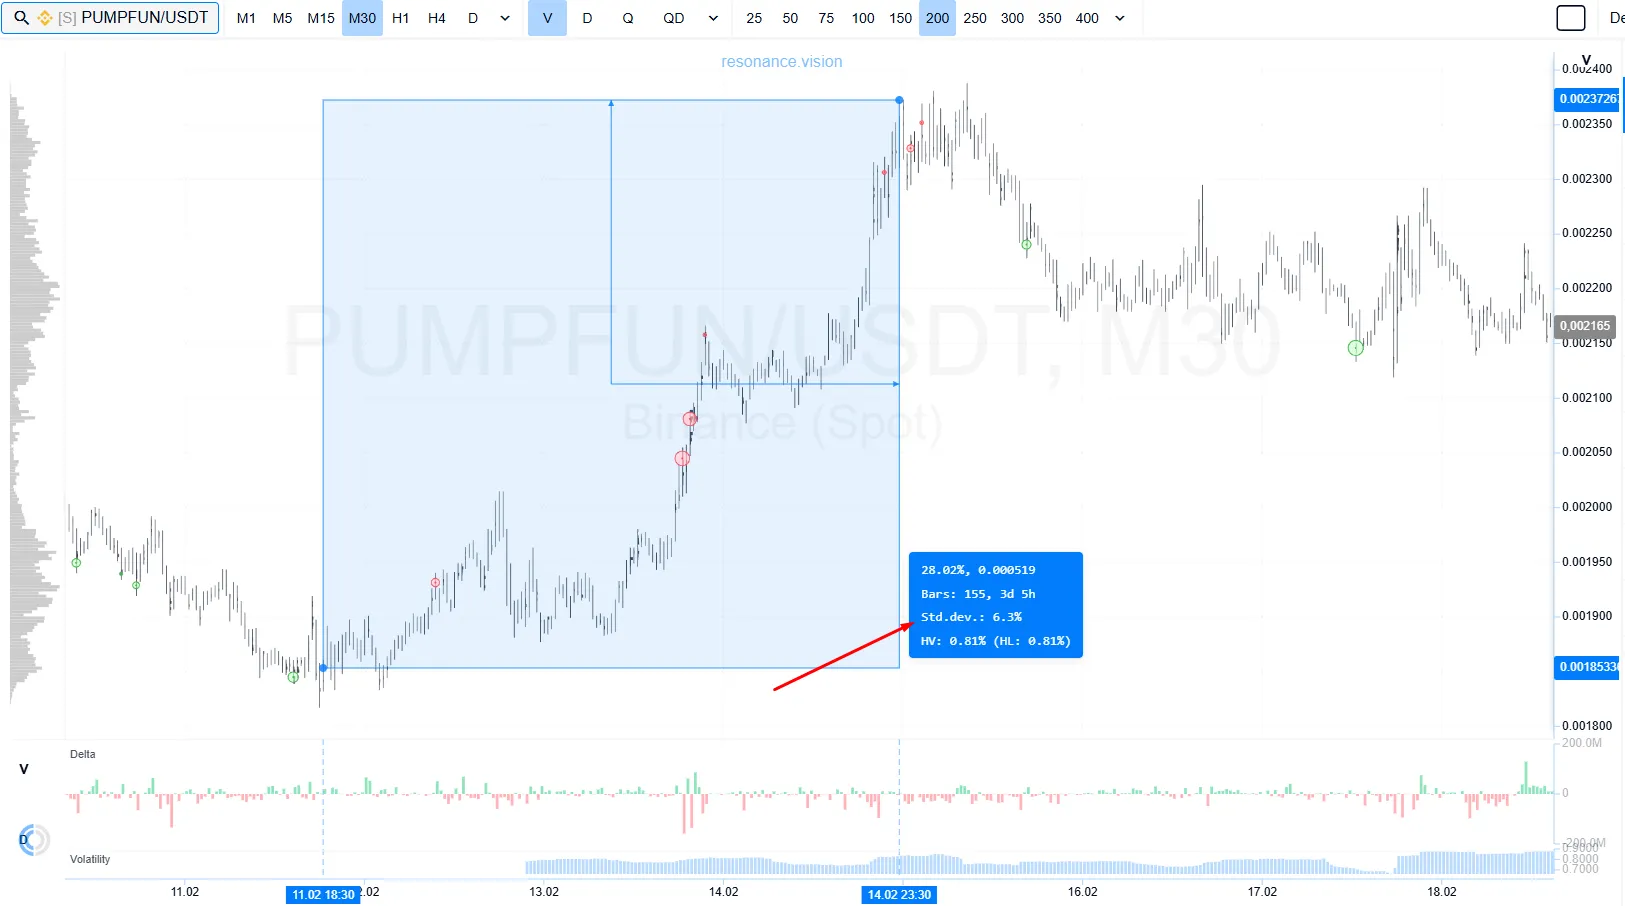
1. Cluster chart: what first stood out was a significant price move of roughly 4 standard deviations (red arrow). This points to the phase where a deficit state is being realized. As is often the case, that phase is followed by consolidation, or surplus. At that stage, the probability of participants locking in profits increases, which can lead to a pause in price movement and a possible correction.
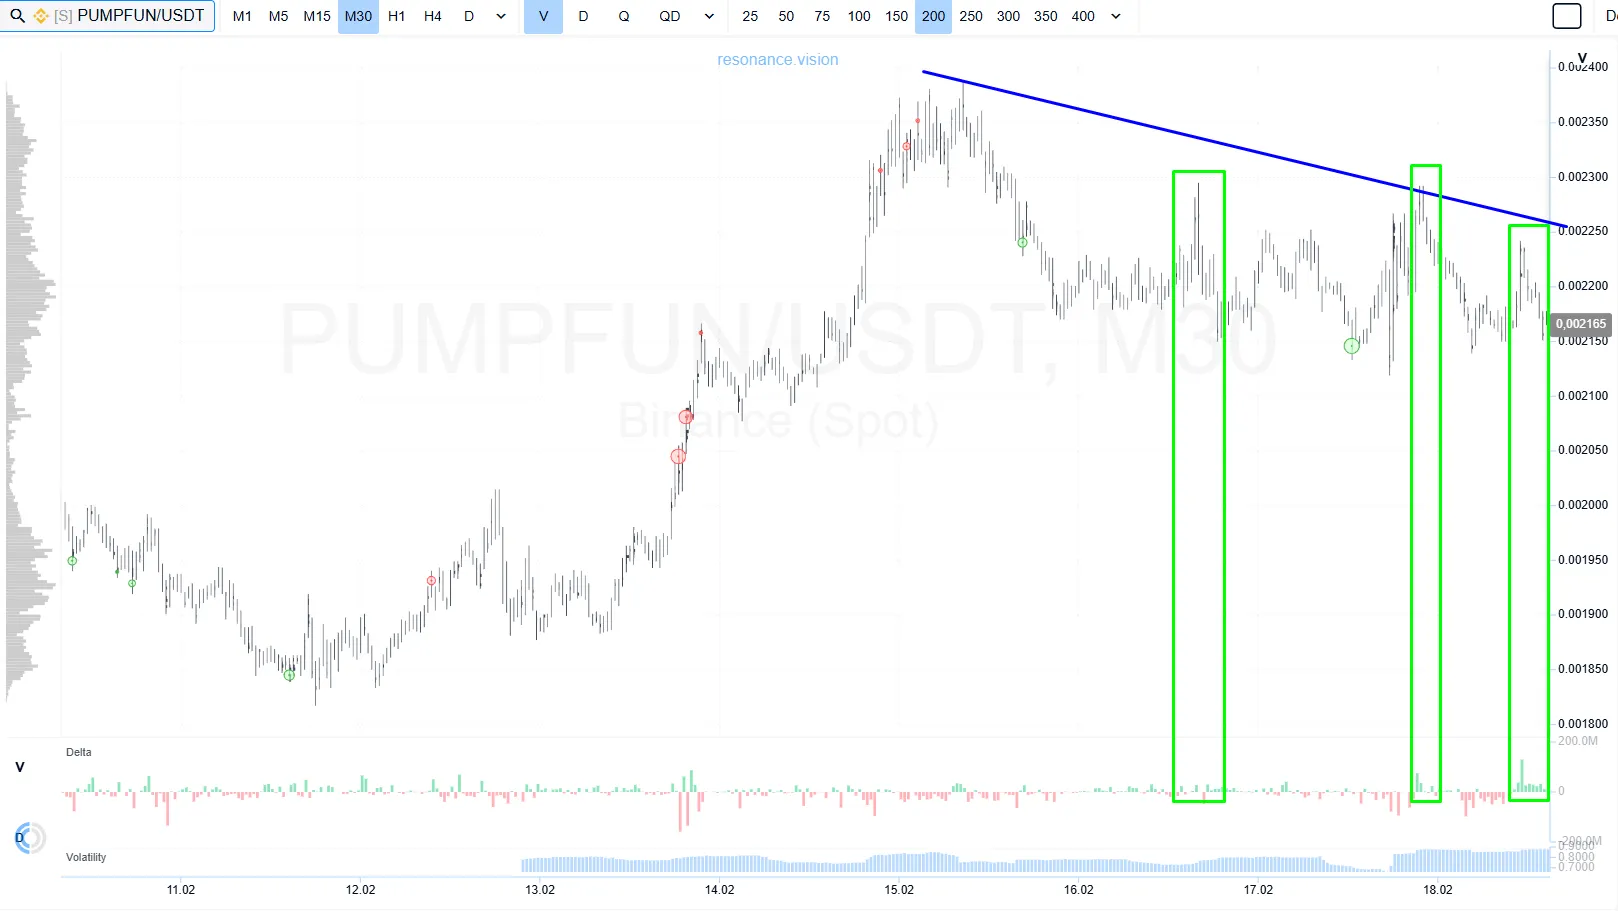
What do we see here? Market buys (green rectangles) stopped pushing price to new local highs (blue line). Buyer activity remained high, but it no longer led to further price growth. These are clear signs of a consolidation phase, or surplus.
This kind of price action points to the presence of strong limit supply: a limit seller is absorbing the buys and holding the market back from moving higher.
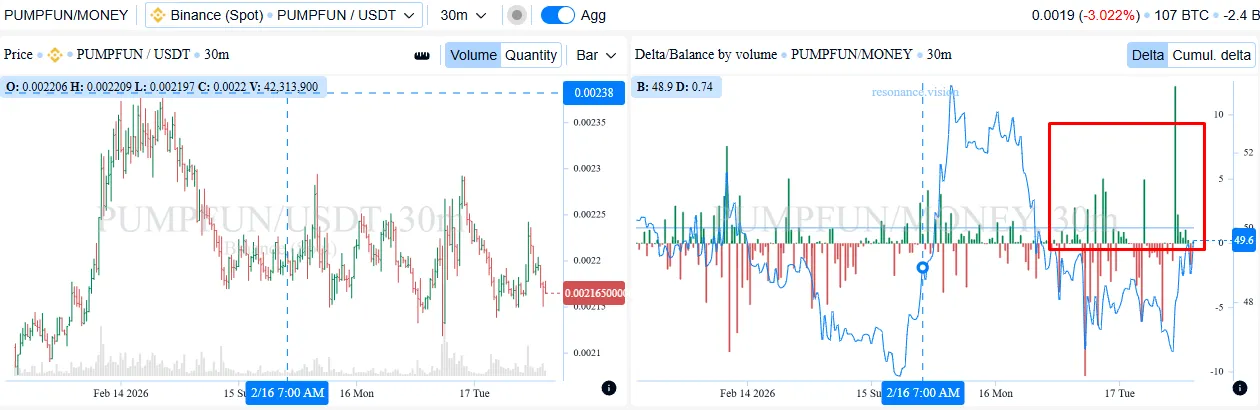
2. Dashboard: aggregated metrics
Delta / volume balance:
The aggregated data shows stronger buyer activity (red rectangle). But price is no longer moving higher. Surplus is forming, and the buys are being absorbed by the seller’s limit orders.
Exit reasons
Cluster chart: participant confrontation
After the drop, dense cluster buildups began to appear (blue rectangle).
Large buys also started coming in (green arrows).
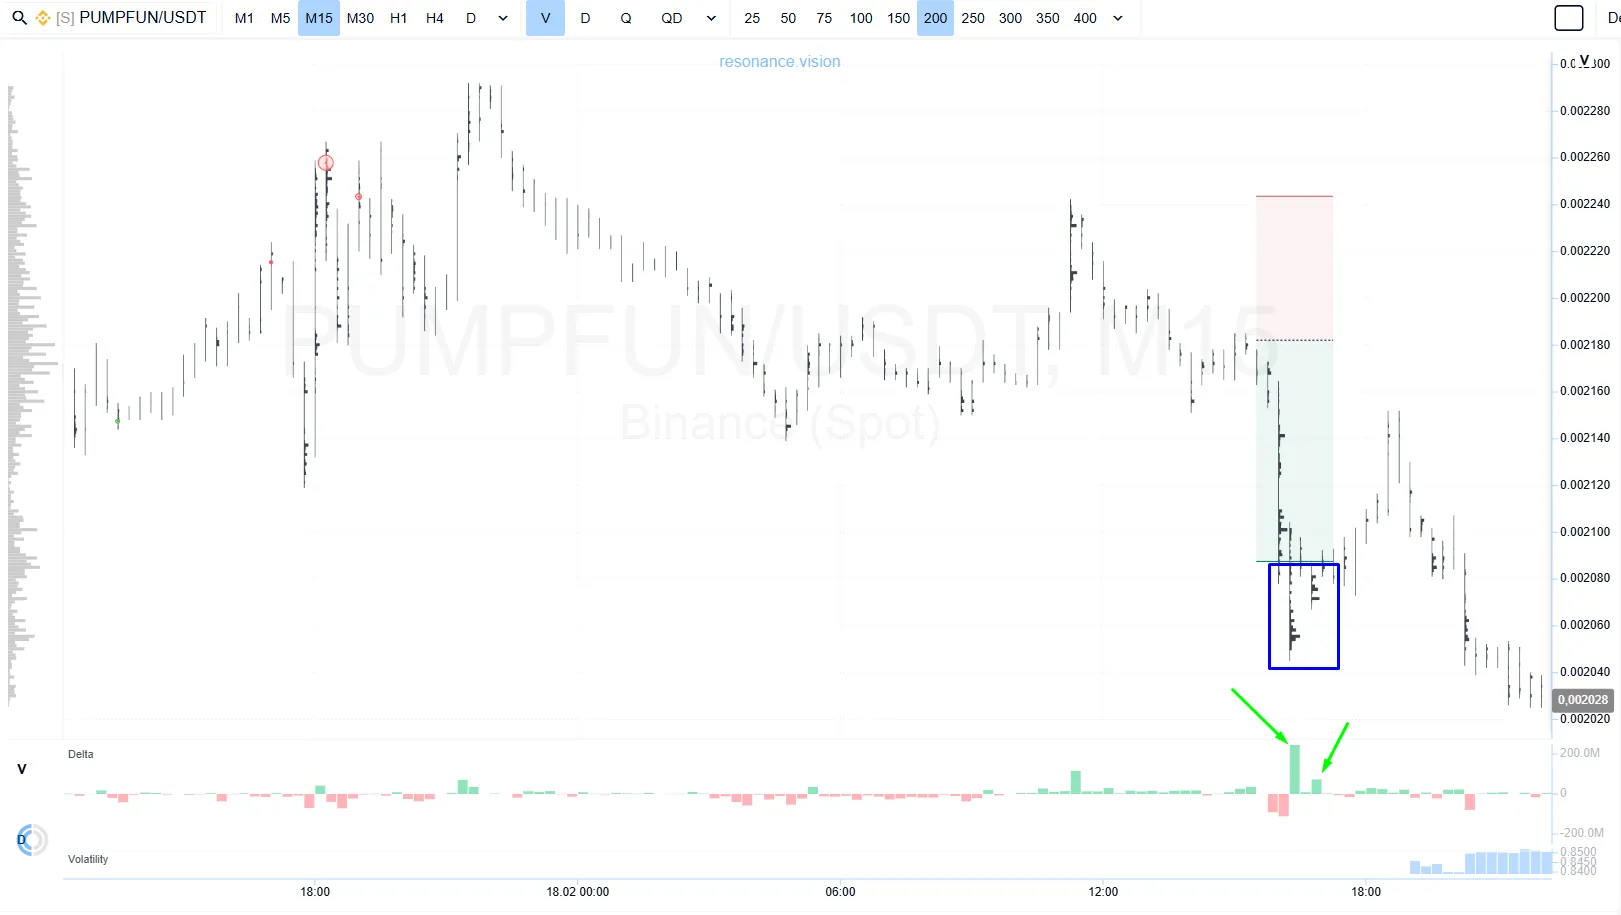
When an aggressive market participant appears during a decline and price stops falling with the same momentum as before, the probability of a pause or a local bounce increases. In that area, closing the position becomes a justified decision. The trade captured a move with a risk/reward ratio of about 1:1.54.
Trade conclusion
This trade showed that for a short setup, what matters is not the impulse itself, but the change in price behavior after it. The cluster chart and volume analysis helped identify the key shift: market buys were still coming in, but they no longer pushed price to fresh highs. From a supply and demand perspective, that meant buyer initiative was starting to fade, while limit supply and local surplus were forming in the market.
Aggregated statistics provided additional confirmation: the buyer was still active, but that effort was no longer producing the same result. It was this divergence between activity and price response that created the foundation for the trade idea.
The exit was logical as well. After the decline, the market began to show responsive demand: dense cluster buildups and aggressive buying started to appear on the cluster chart, while price stopped moving lower with the same momentum. At that point, closing the position was a justified decision.
The main takeaway from this trade is that strong ideas do not appear when a trader tries to guess a top or predict a reversal. They appear when cluster analysis, volume analysis, and price behavior show that one side is losing efficiency. That is exactly the kind of approach that allows decisions to be made based on market mechanics rather than emotion.
Follow new insights in our telegram channel.
No need to invent complex schemes and look for the "grail". Use the Resonance platform tools.
Register via the link — get a bonus and start earning:
OKX | BingX | KuCoin.
Promo code TOPBLOG gives you a 10% discount on any Resonance tariff plan.
Recommended articles


