RIF +104.77% (Resonance Directional Strategy)

A deal analysis using cluster analysis, cumulative delta, limit delta, and price change per unit volume. We demonstrate how signs of local shortages helped determine the entry point, and how a decline in buyer efficiency became a signal to take profits after a rally of more than 100%.
Table of contents

Coin: RIF/USDT
Risk: High
Level: Beginner
Entry Reasons
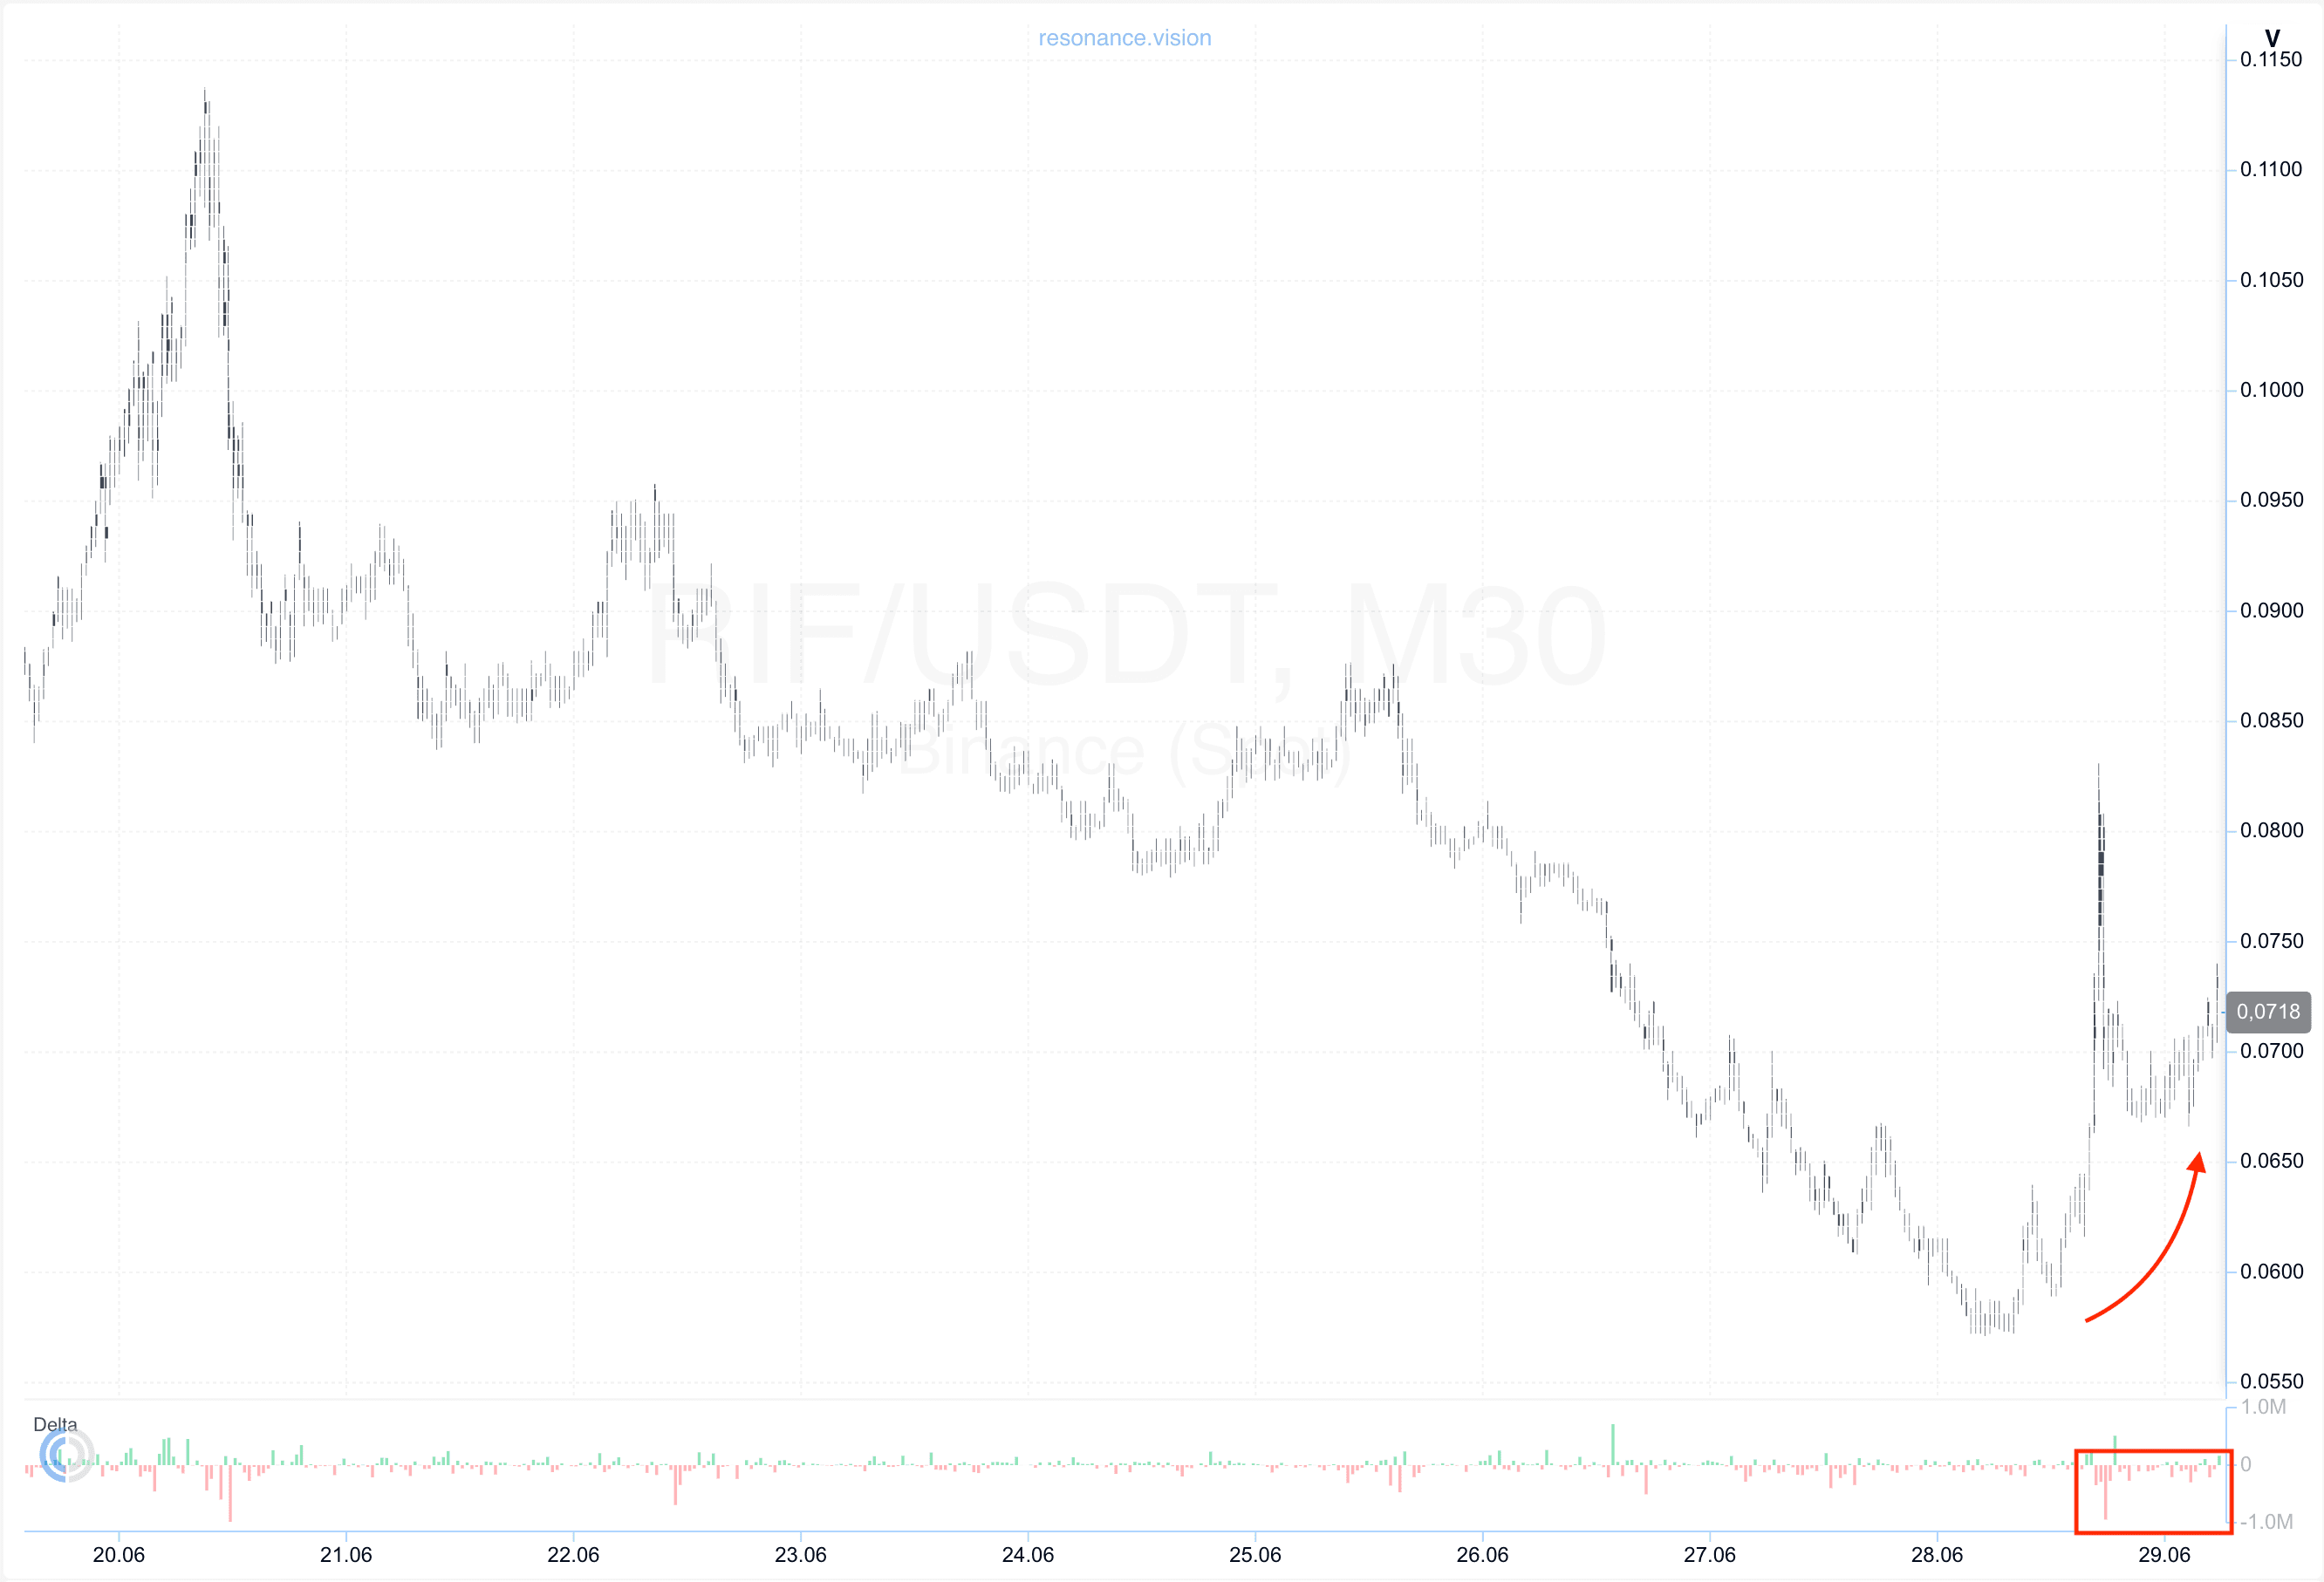
Cluster Chart: After a prolonged downtrend, the market formed a local pullback upward, during which market sell orders continued to dominate (red rectangle and arrow). Despite the continued dominance of sellers, their effectiveness gradually declined, as the price stopped responding with further downside within the current range.
This indicates that sellers continue to commit significant volume, but the incoming market sell orders are being successfully absorbed by opposing demand. In other words, supply is no longer exerting its previous influence on price.
Such price behavior is one of the characteristic signs of a local supply deficit. When large selling volumes no longer result in new lows, it signals weakening seller initiative and a gradual shift in market balance toward buyers. Situations like this often become the foundation for the development of a new bullish move.
In the Dashboard
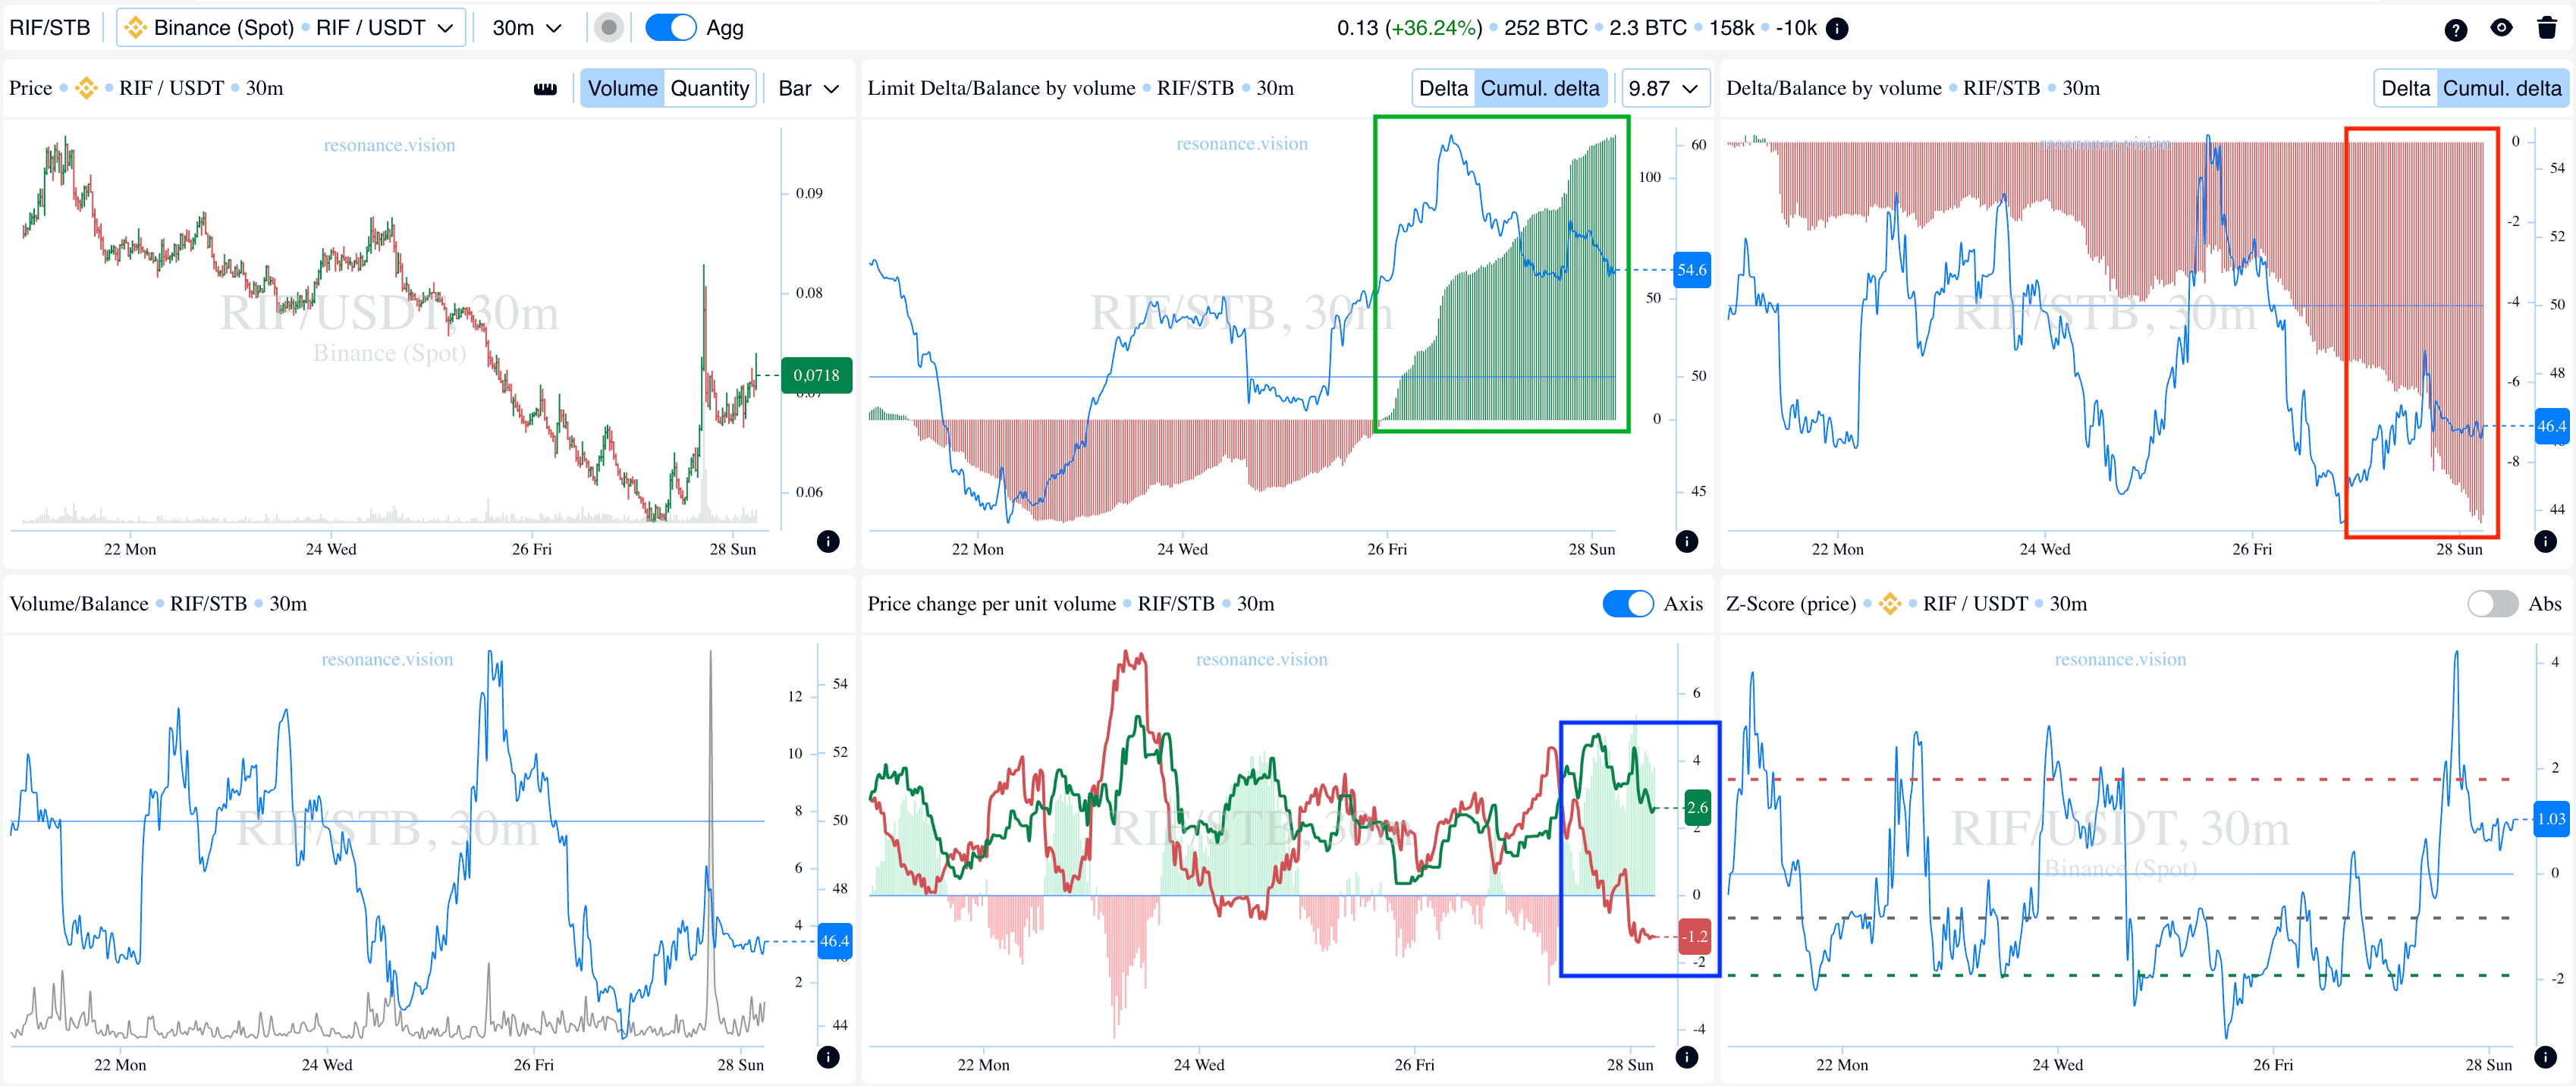
Delta / Volume Balance and Limit Delta: The aggregated data across all trading pairs and exchanges fully confirms the observations from the cluster chart. During the reviewed period, there was a steady cumulative increase in market selling pressure, clearly reflected in the cumulative delta histogram. The most recent selling values continued to rise (red rectangle).
At the same time, the cumulative limit delta showed a consistent increase in limit buy orders, with their dominance becoming even more pronounced during the latest stage of the move (green rectangle).
This combination of signals indicates that incoming market sell volume was being actively absorbed by limit buyers. As a result, local support was formed within the current range, while the market balance gradually shifted in favor of buyers despite the ongoing selling pressure.
Price Change per Unit of Volume: Additional confirmation came from the Price Change per Unit of Volume indicator. During the reviewed period, the effectiveness of volume gradually shifted in favor of buyers (blue rectangle), and this divergence continued to strengthen.
This means that progressively less volume was required to move the price higher, while sellers had to commit increasingly larger volumes to continue pushing the price lower. Such dynamics indicate improving buyer efficiency and provide additional confirmation of a developing local supply deficit, further strengthening the case for opening a long position.
Exit Reasons
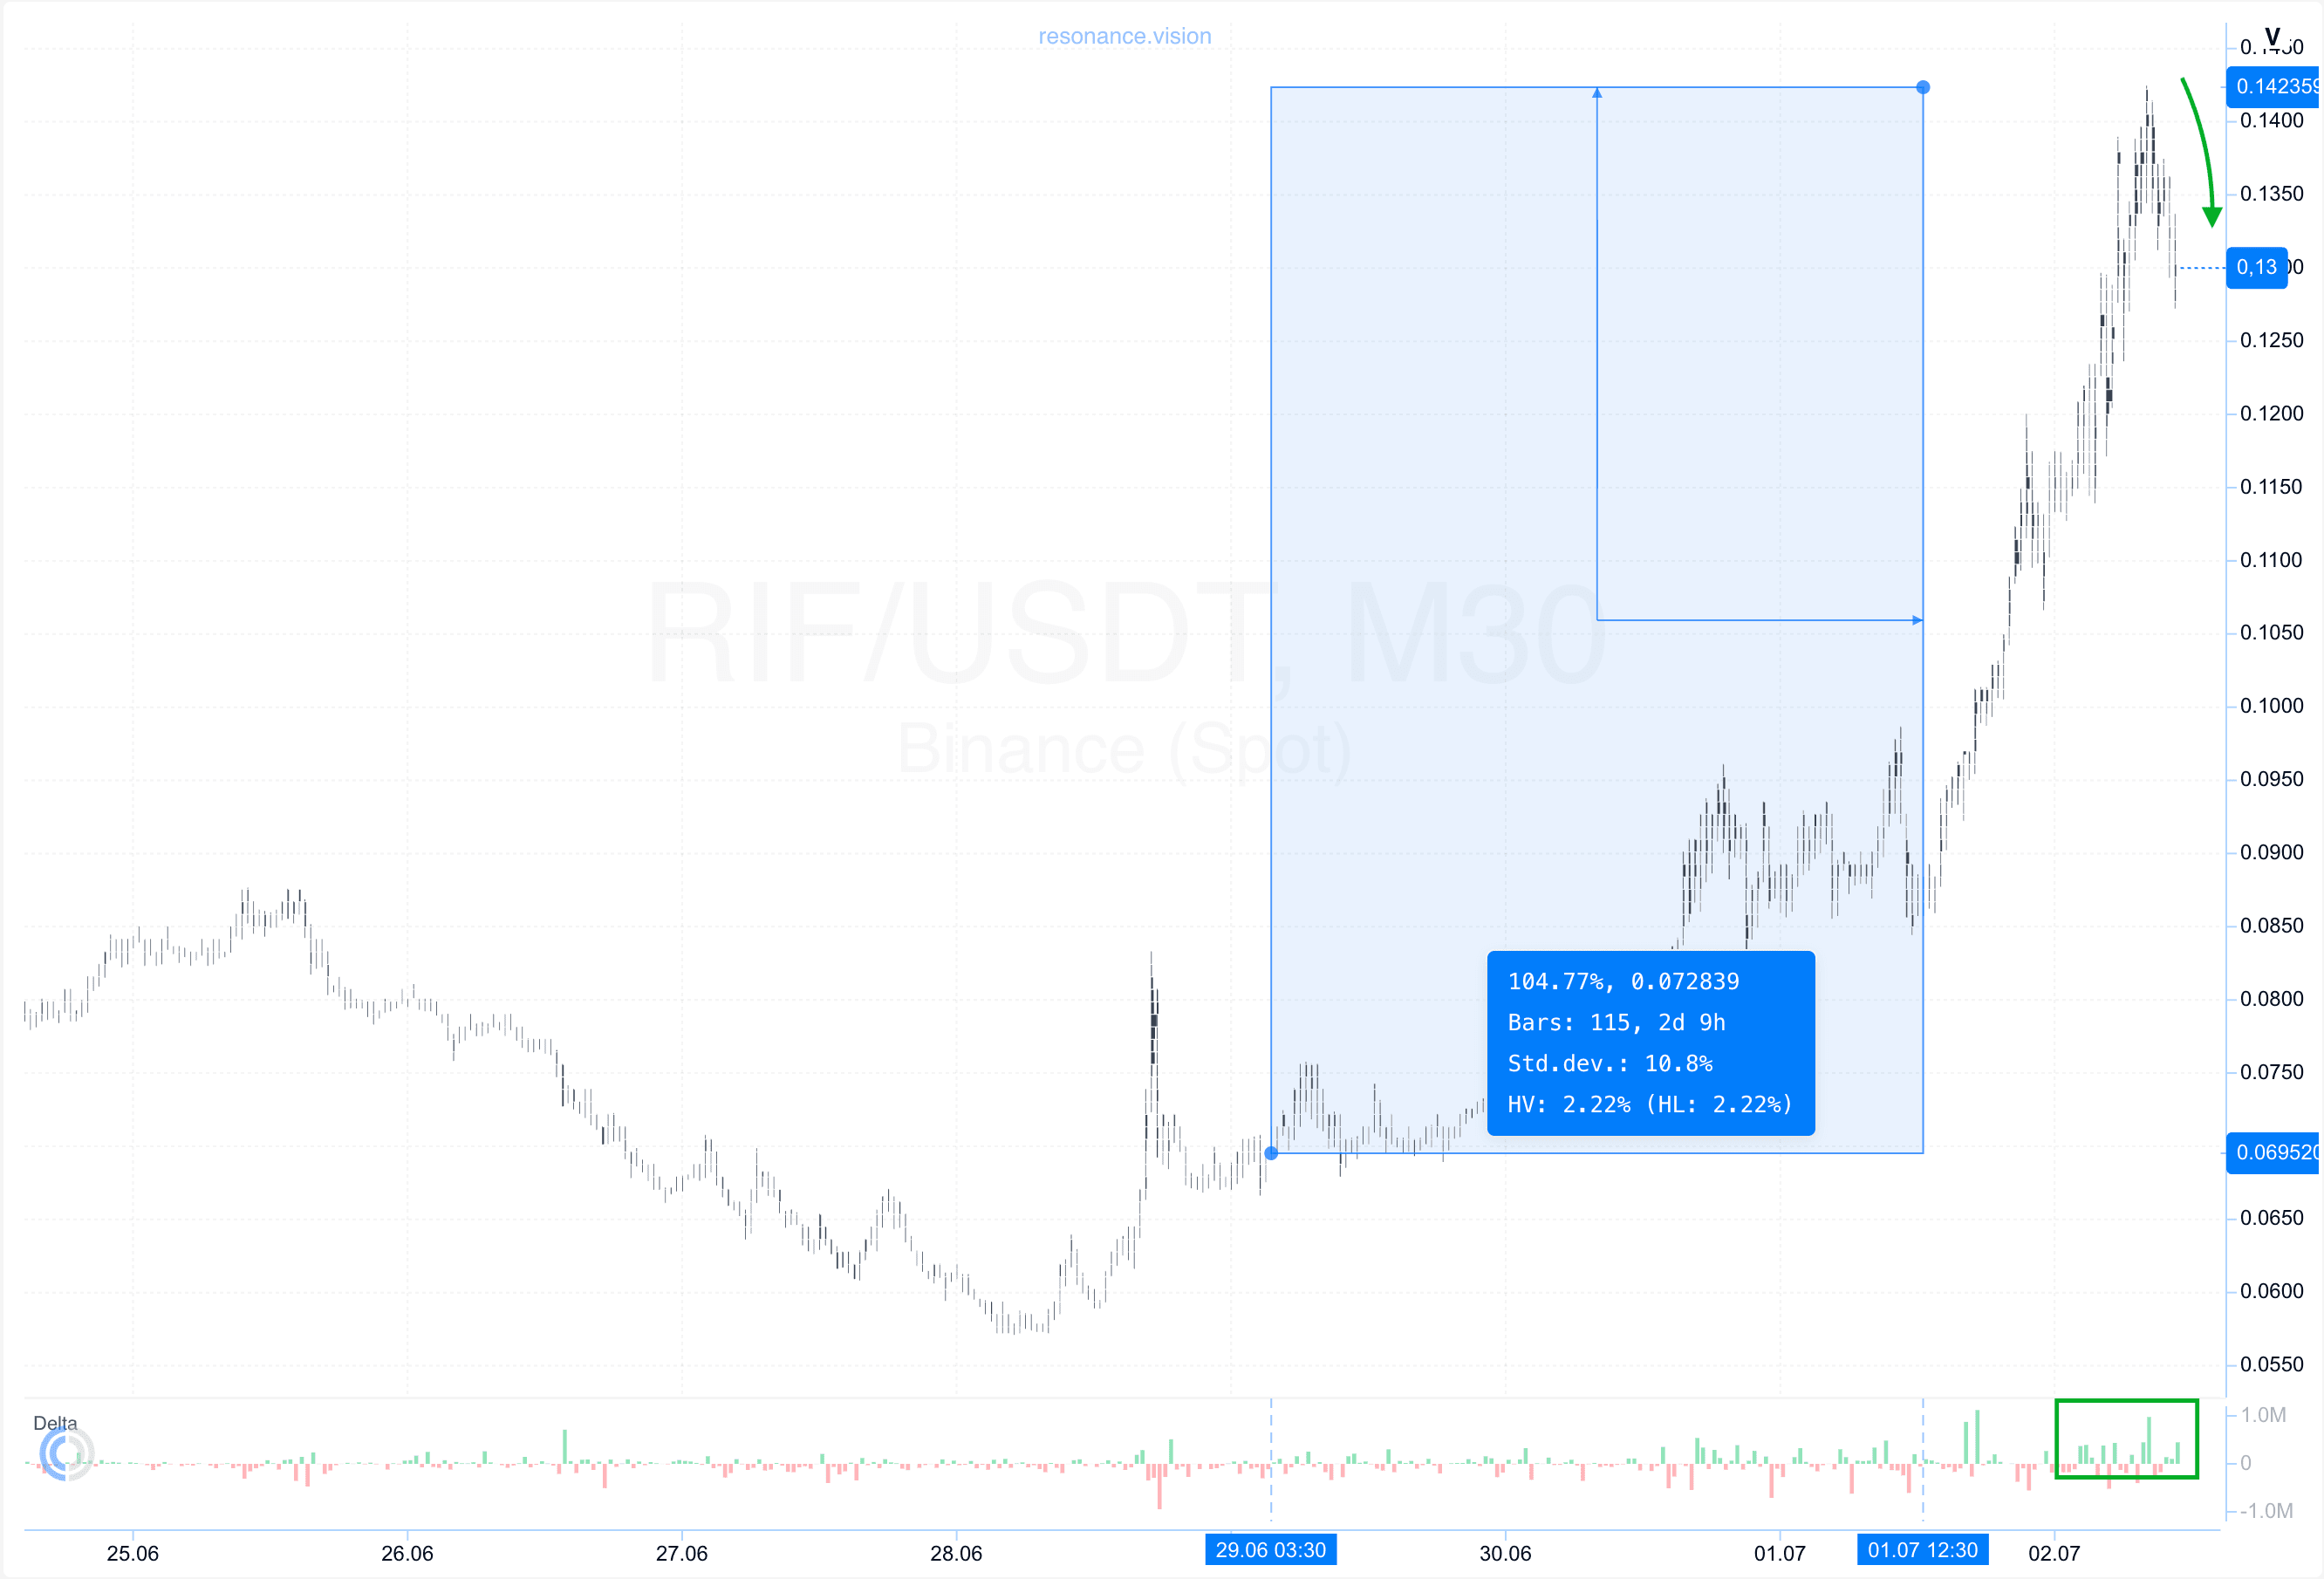
Cluster Chart: From the entry point, the price gained more than 100%, fully validating the original trading scenario and producing a strong directional move.
As the bullish impulse developed, volatility increased significantly, which often signals a transition into a consolidation phase and the search for a new market balance. At the same time, market buy orders continued to dominate, but their impact on price weakened noticeably. Despite continued buying activity, the price stopped advancing and formed a pullback (green rectangle and arrow).
This price behavior indicates a gradual decline in buyer efficiency. Volume continued flowing into the market, but it was no longer capable of sustaining further price appreciation. In essence, this became a mirror image of the conditions observed at the entry, except that signs of weakness were now appearing on the buyer’s side.
Such dynamics point to the formation of signs of a local supply surplus and an increasing probability of either a deeper correction or a transition into a new balance phase.
Under these conditions, continuing to hold the position would have involved significantly greater risk. Therefore, taking profits after a move of more than 100% was a logical and well-founded decision from both a position management and capital preservation perspective.
Conclusion
This trade clearly demonstrates that what matters most is not the volume itself, but its effectiveness. Despite the prolonged dominance of market sellers, the price stopped responding with further downside, indicating active absorption of supply and the formation of signs of a local supply deficit.
The aggregated dashboard data further reinforced this scenario: the cumulative increase in market selling was accompanied by growing limit buy orders, while the Price Change per Unit of Volume indicator gradually shifted in favor of buyers. Together, these factors indicated that market initiative was transitioning to buyers and provided a well-founded entry opportunity.
After the position was opened, the market fully delivered the expected scenario, producing a gain of more than 100%. However, as the trend developed, the market structure began to change: volatility increased, while buyers gradually lost the ability to push prices higher despite continued buying volume. This became an early sign of a developing local supply surplus and an increasing probability of the market transitioning into either a correction or a consolidation phase.
Thus, the entry was based on signs of a local supply deficit and declining seller efficiency, while the exit was driven by the emergence of the same characteristics on the buyer’s side. It is precisely the analysis of the interaction between volume and price reaction that allows traders to identify shifts in market initiative early and make higher-quality trading decisions.
Follow new insights in our telegram channel.
No need to invent complex schemes and look for the "grail". Use the Resonance platform tools.
Register via the link — get a bonus and start earning:
OKX | BingX | KuCoin.
Promo code TOPBLOG gives you a 10% discount on any Resonance tariff plan.
Recommended articles


