STG +79.94% (Resonance Directional Strategy)
Analyzing the deal using cluster analysis, delta, and limit delta. We demonstrate how signs of local shortages and market inefficiency helped determine the entry point, while declining buyer efficiency signaled profit-taking after an 80% rally.
Table of contents

Coin: STG/USDT
Risk: High
Knowledge Level: Beginner
Entry Reasons
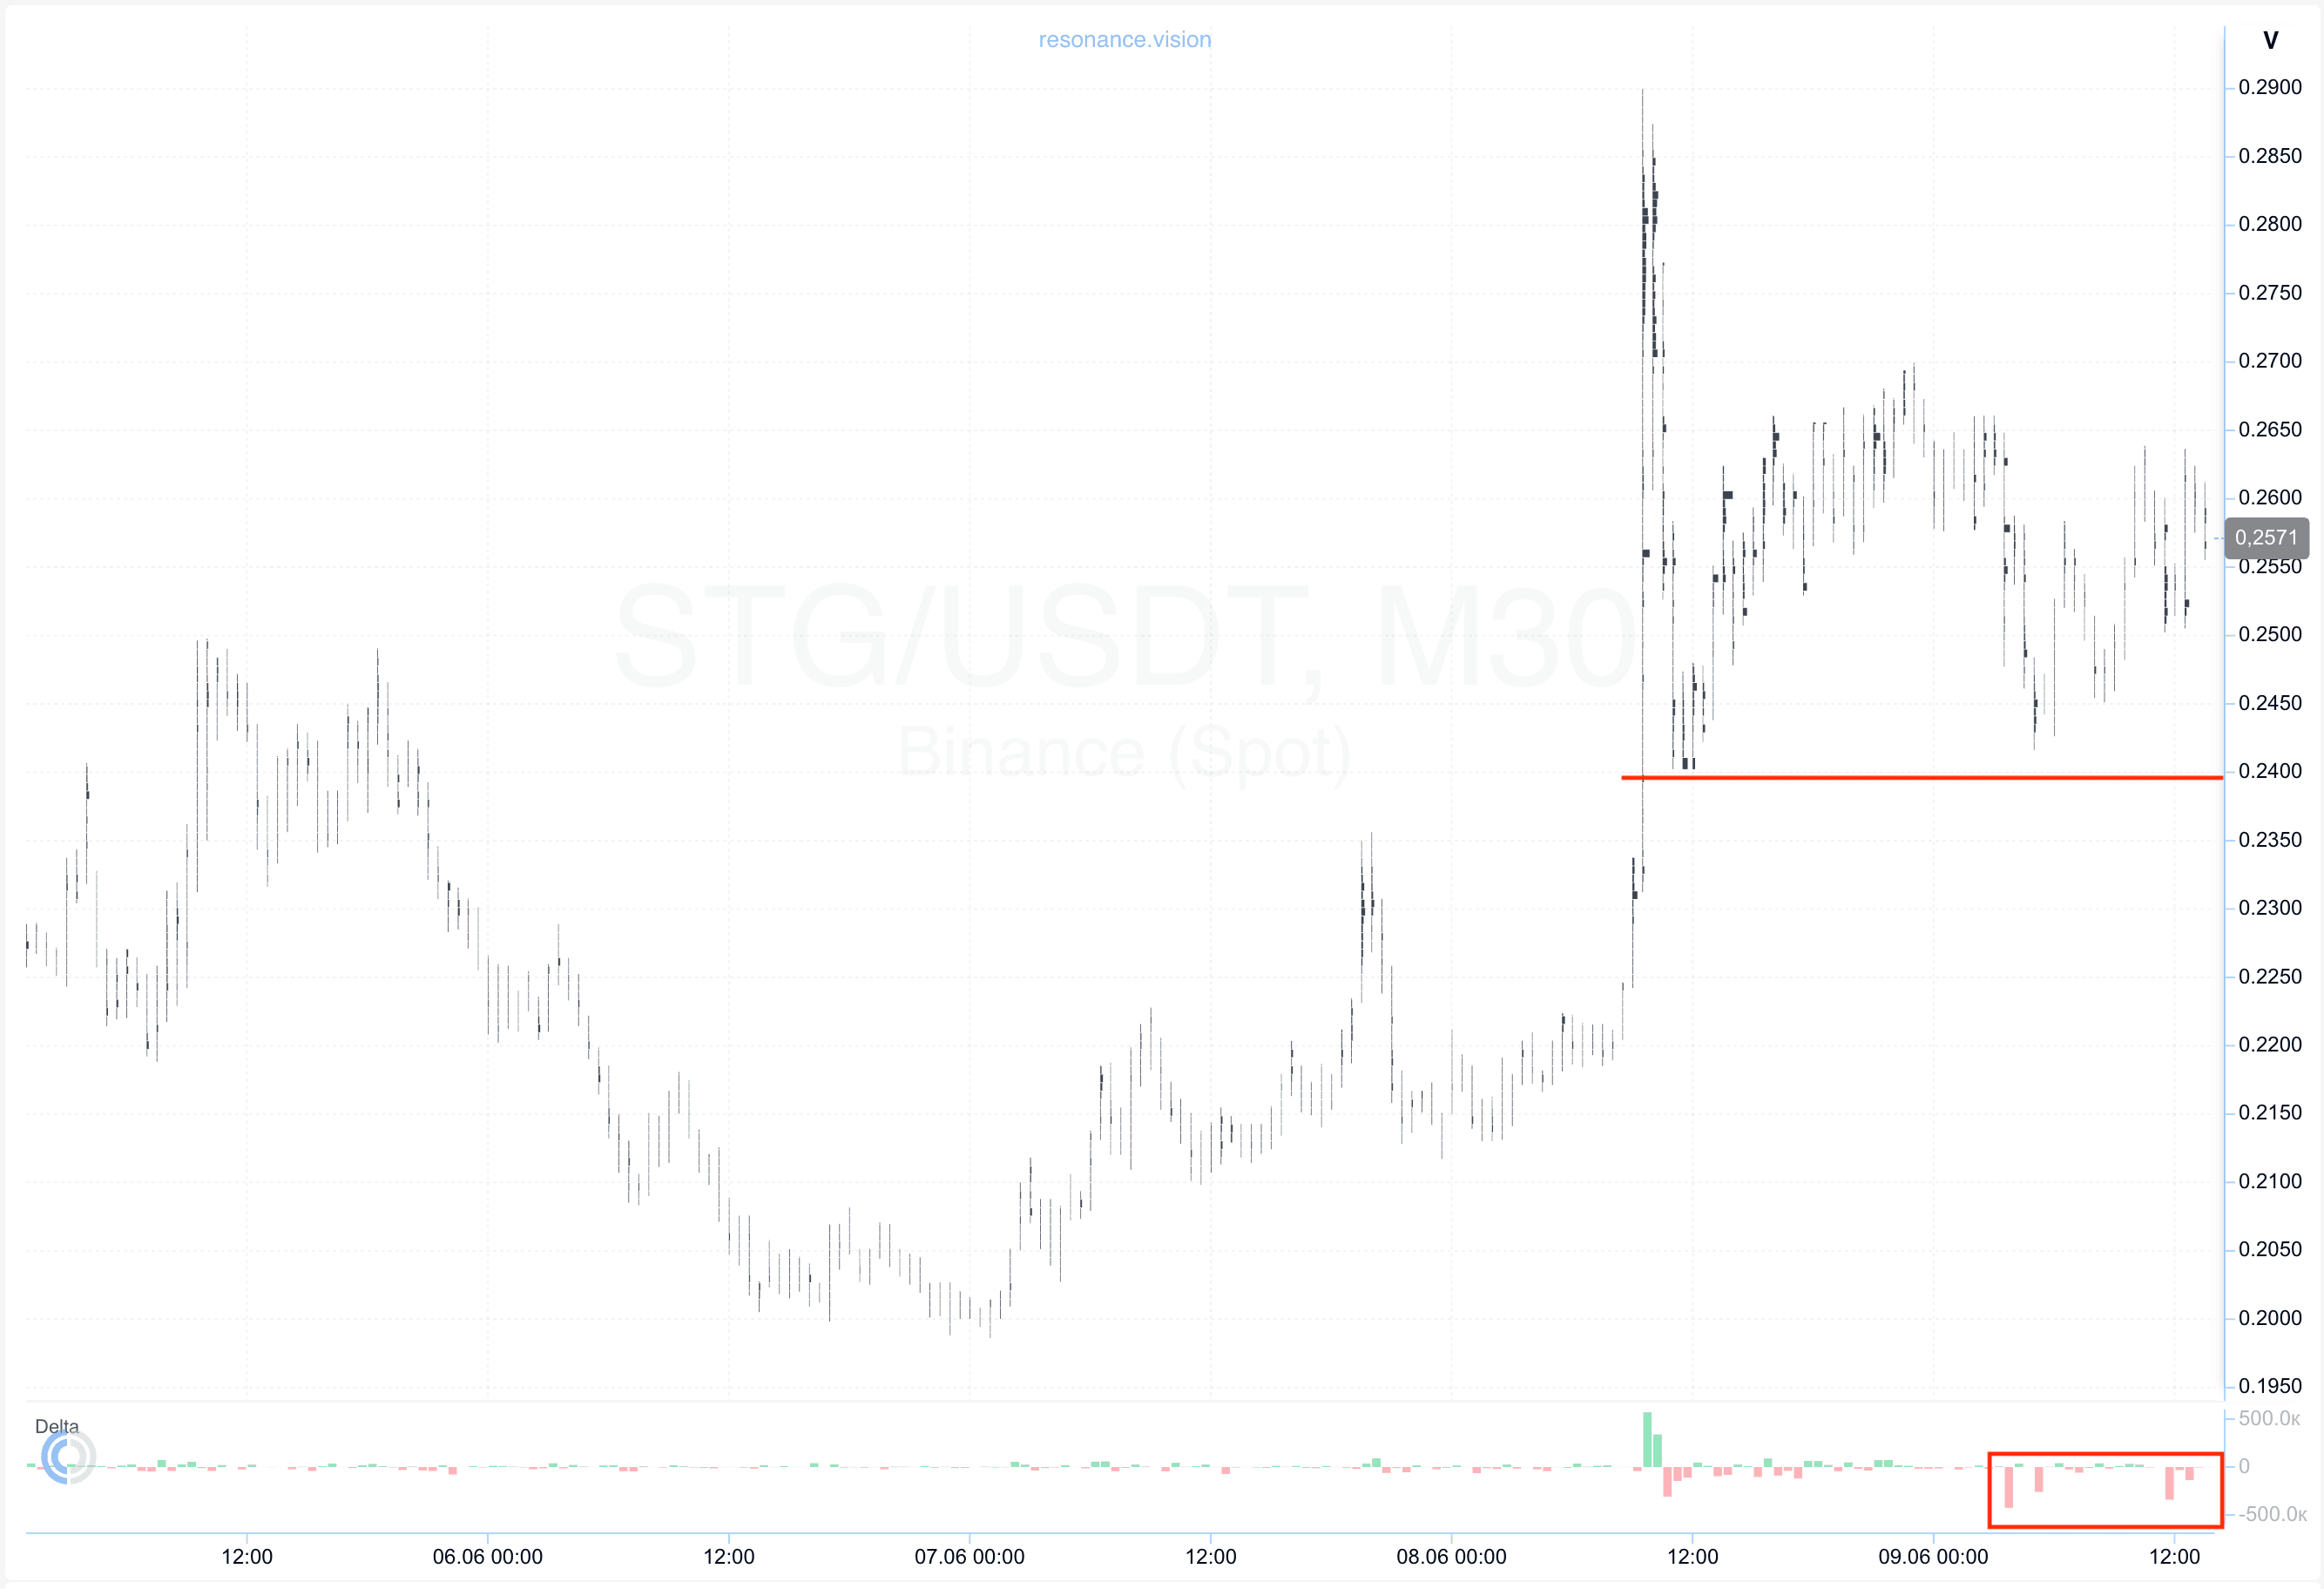
Cluster Chart: Following a strong upward impulse, the market entered a pullback and then transitioned into a sideways consolidation phase. During the latter part of this range, market sell orders began to dominate significantly (red rectangle), indicating high seller activity and attempts to push the price lower.
However, despite the continued dominance of selling pressure, its effectiveness gradually declined. The price stopped reacting by making new local lows and remained within the range without showing any continuation of the downward move (red line).
This divergence between selling volume and price reaction is an important signal of a shift in market balance. Sellers continue to expend volume, yet opposing demand is successfully absorbing the incoming sell orders.
Such behavior indicates signs of a local deficit: the market stops declining despite the dominance of selling activity, suggesting weakening seller initiative and a gradual shift in balance toward buyers.
In the Dashboard
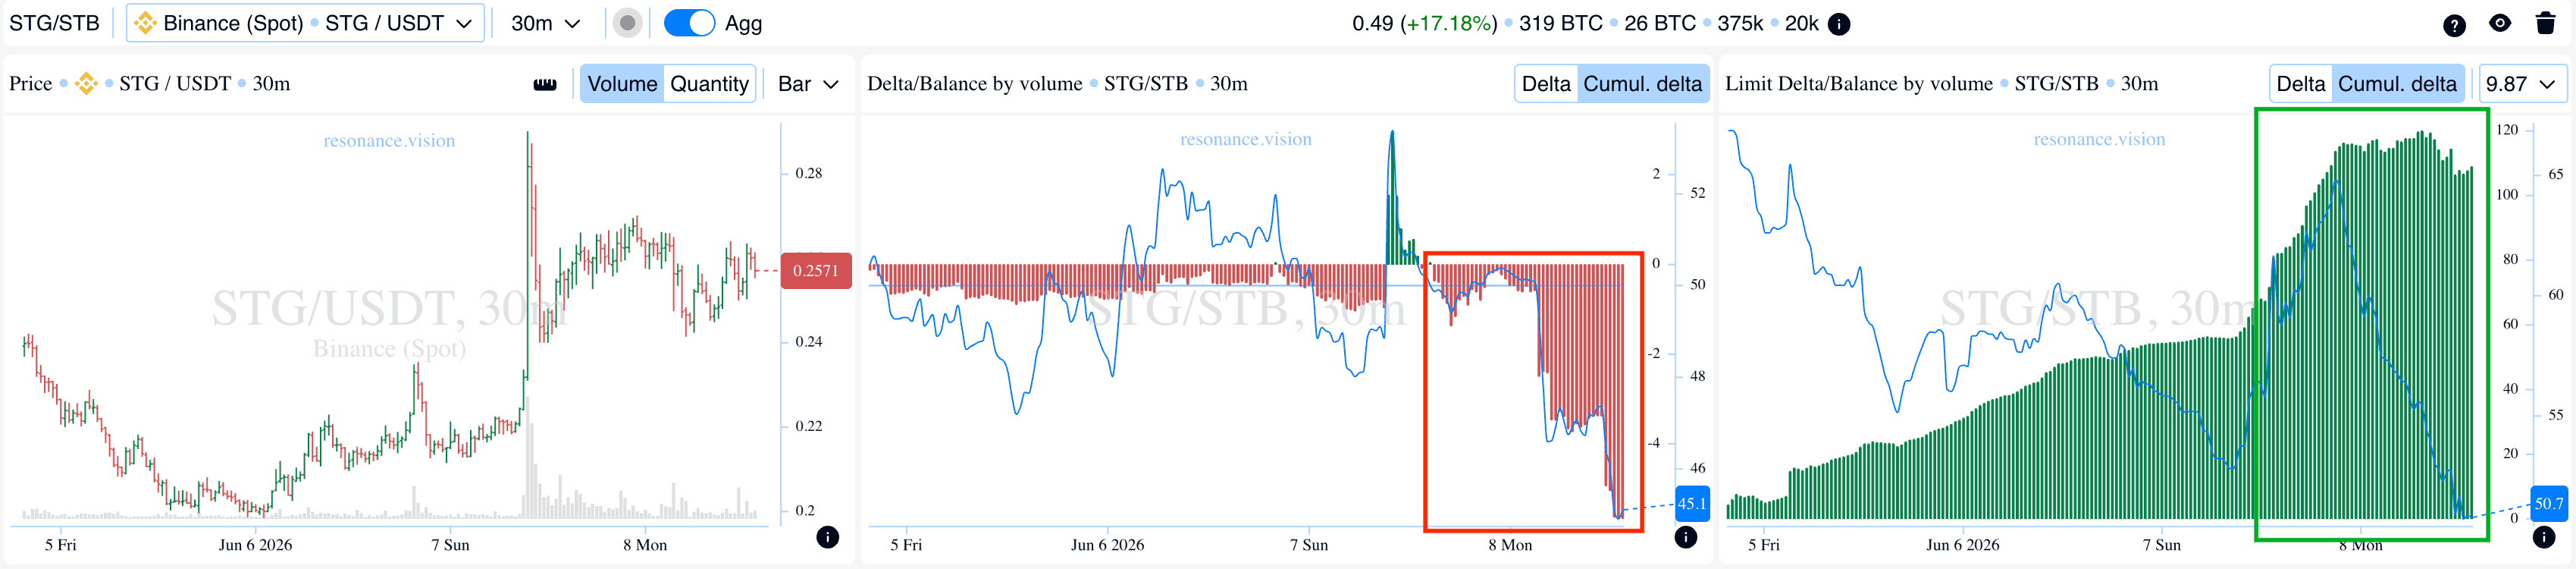
Delta / Volume Balance and Limit Delta: Aggregated data across all trading pairs and exchanges also confirms the observations from the cluster chart. During the analyzed period, cumulative market selling pressure continued to increase steadily, which is clearly reflected in the cumulative delta histogram. Extreme selling values continued to expand (red rectangle).
Despite the increase in market selling activity, the price failed to show a corresponding reaction, further indicating declining seller efficiency and the presence of strong opposing demand.
At the same time, the cumulative limit delta showed a steady increase in buy limit orders, which became even more pronounced during the final stage of the move (green rectangle).
This combination of signals suggests that incoming market sell volume was actively absorbed by limit buyers. As a result, local support was forming while the balance gradually shifted in favor of buyers.
Such conditions often precede a continuation of the upward move, as aggressive selling pressure stops having a significant impact on price while initiative gradually shifts to the demand side.
Exit Reasons
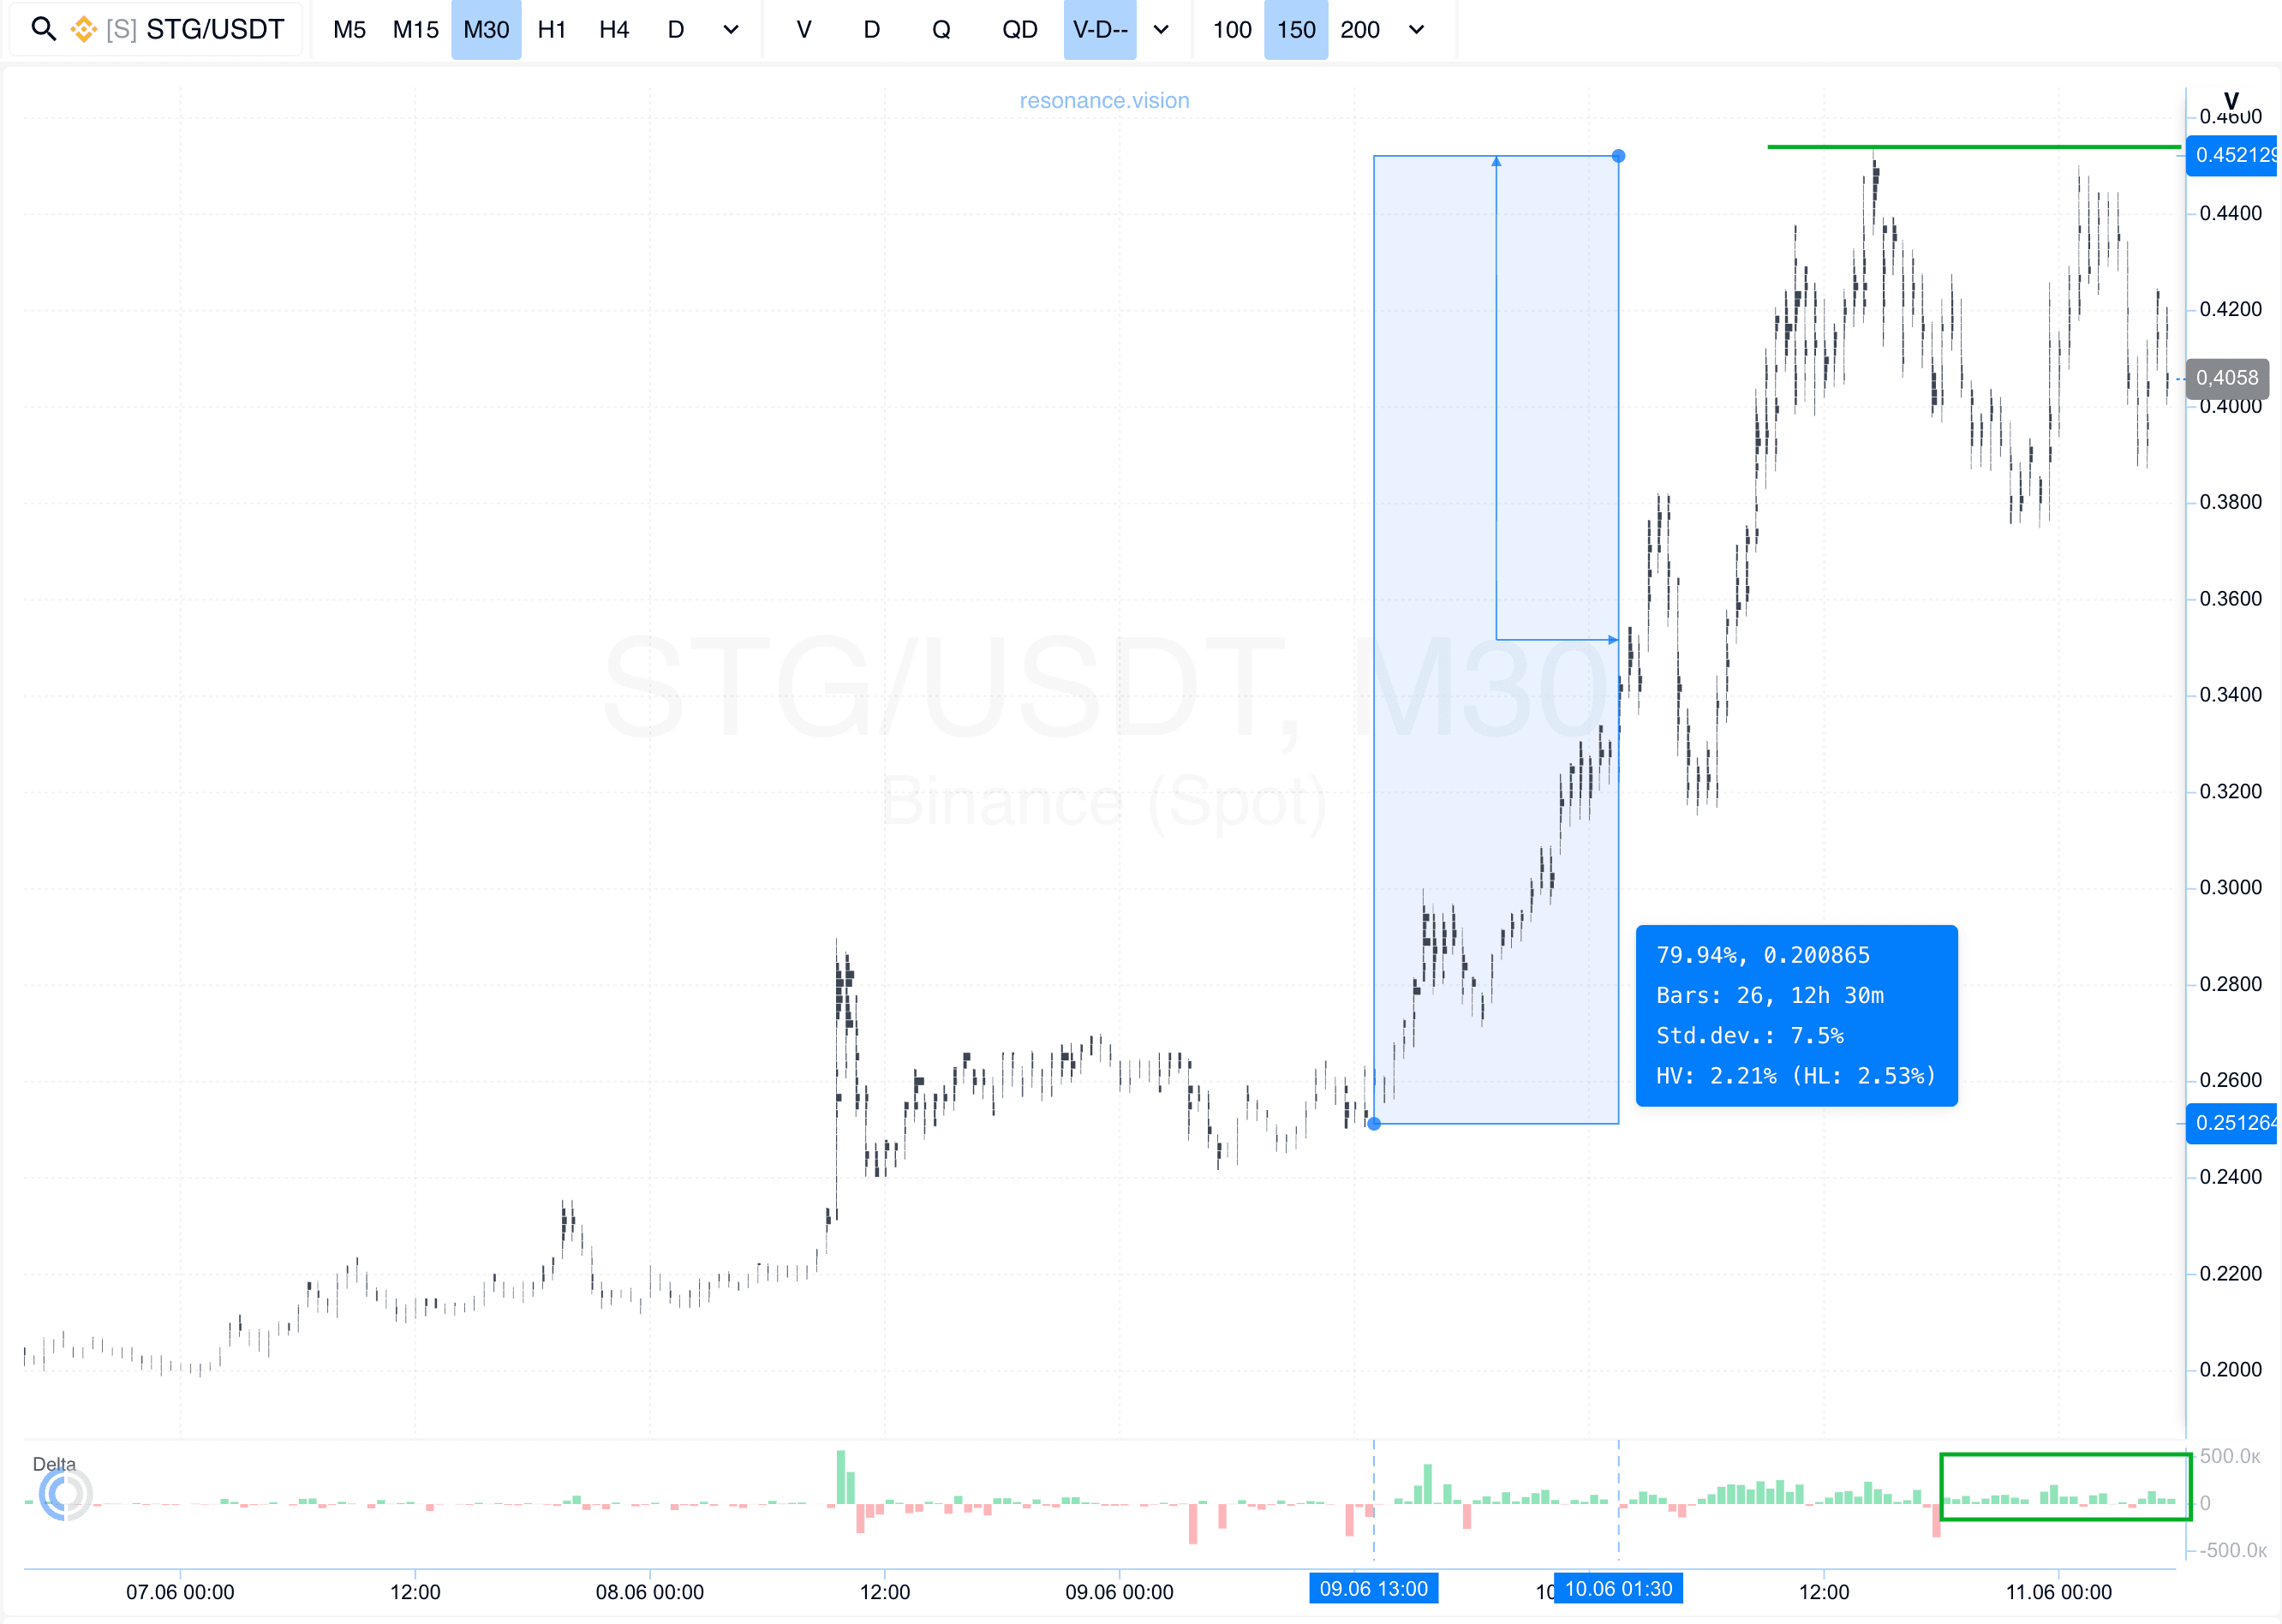
Cluster Chart: From the entry point, the price advanced nearly 80%, representing a strong move for this asset and fully validating the original scenario.
As the uptrend developed, volatility began increasing significantly, which often signals a transition into a consolidation phase. At the same time, an M-shaped formation appeared near the local high, indicating weakening bullish momentum and increasing competition between buyers and sellers.
Particular attention was drawn to the structure of the latest pullback. Although market buy orders continued to dominate (green rectangle), the price no longer responded as it had before and was unable to confidently establish new highs.
This indicates a gradual decline in buyer efficiency: volume remains present, but its impact on price movement is noticeably weakening. This situation is effectively the mirror image of the conditions observed at the entry point, except that signs of weakness are now appearing on the buyers’ side.
Such dynamics indicate the formation of signs of a local surplus and an increased probability of either a deeper correction or a transition into a balanced market phase.
Under these conditions, holding the position further involves a noticeable increase in risk. Therefore, taking profits after such a strong move appeared to be a logical and well-justified decision from both a risk management and capital preservation perspective.

Conclusion
This trade review clearly demonstrates the importance of evaluating not only volume itself, but also its effectiveness. At the entry stage, sellers continued to dominate through market orders, yet their pressure was no longer leading to new lows. This indicated the formation of local deficit conditions and active absorption of selling volume by limit buyers.
After entry, the market followed the expected scenario and delivered approximately 80% growth. As the move developed, the situation began to change: despite the continued dominance of market buy orders, their influence on price weakened noticeably, while the market started showing signs of a local surplus.
Thus, the entry was based on seller inefficiency, while the exit was based on declining buyer efficiency. This approach makes it possible to identify shifts in the balance between supply and demand in a timely manner and make more informed trading decisions.
Follow new insights in our telegram channel.
No need to invent complex schemes and look for the "grail". Use the Resonance platform tools.
Register via the link — get a bonus and start earning:
OKX | BingX | KuCoin.
Promo code TOPBLOG gives you a 10% discount on any Resonance tariff plan.
Recommended articles


