TIA +29.8% (Resonance Directional Strategy)

TIA/USDT 📊 Ineffective market selling in a sideways range and the formation of a local deficit. Volume absorption by limit buyers, a +30% rise, and profit-taking as buying becomes less effective.
Table of contents

Asset: TIA/USDT
Risk: medium
Level of understanding: beginner
Entry reasons
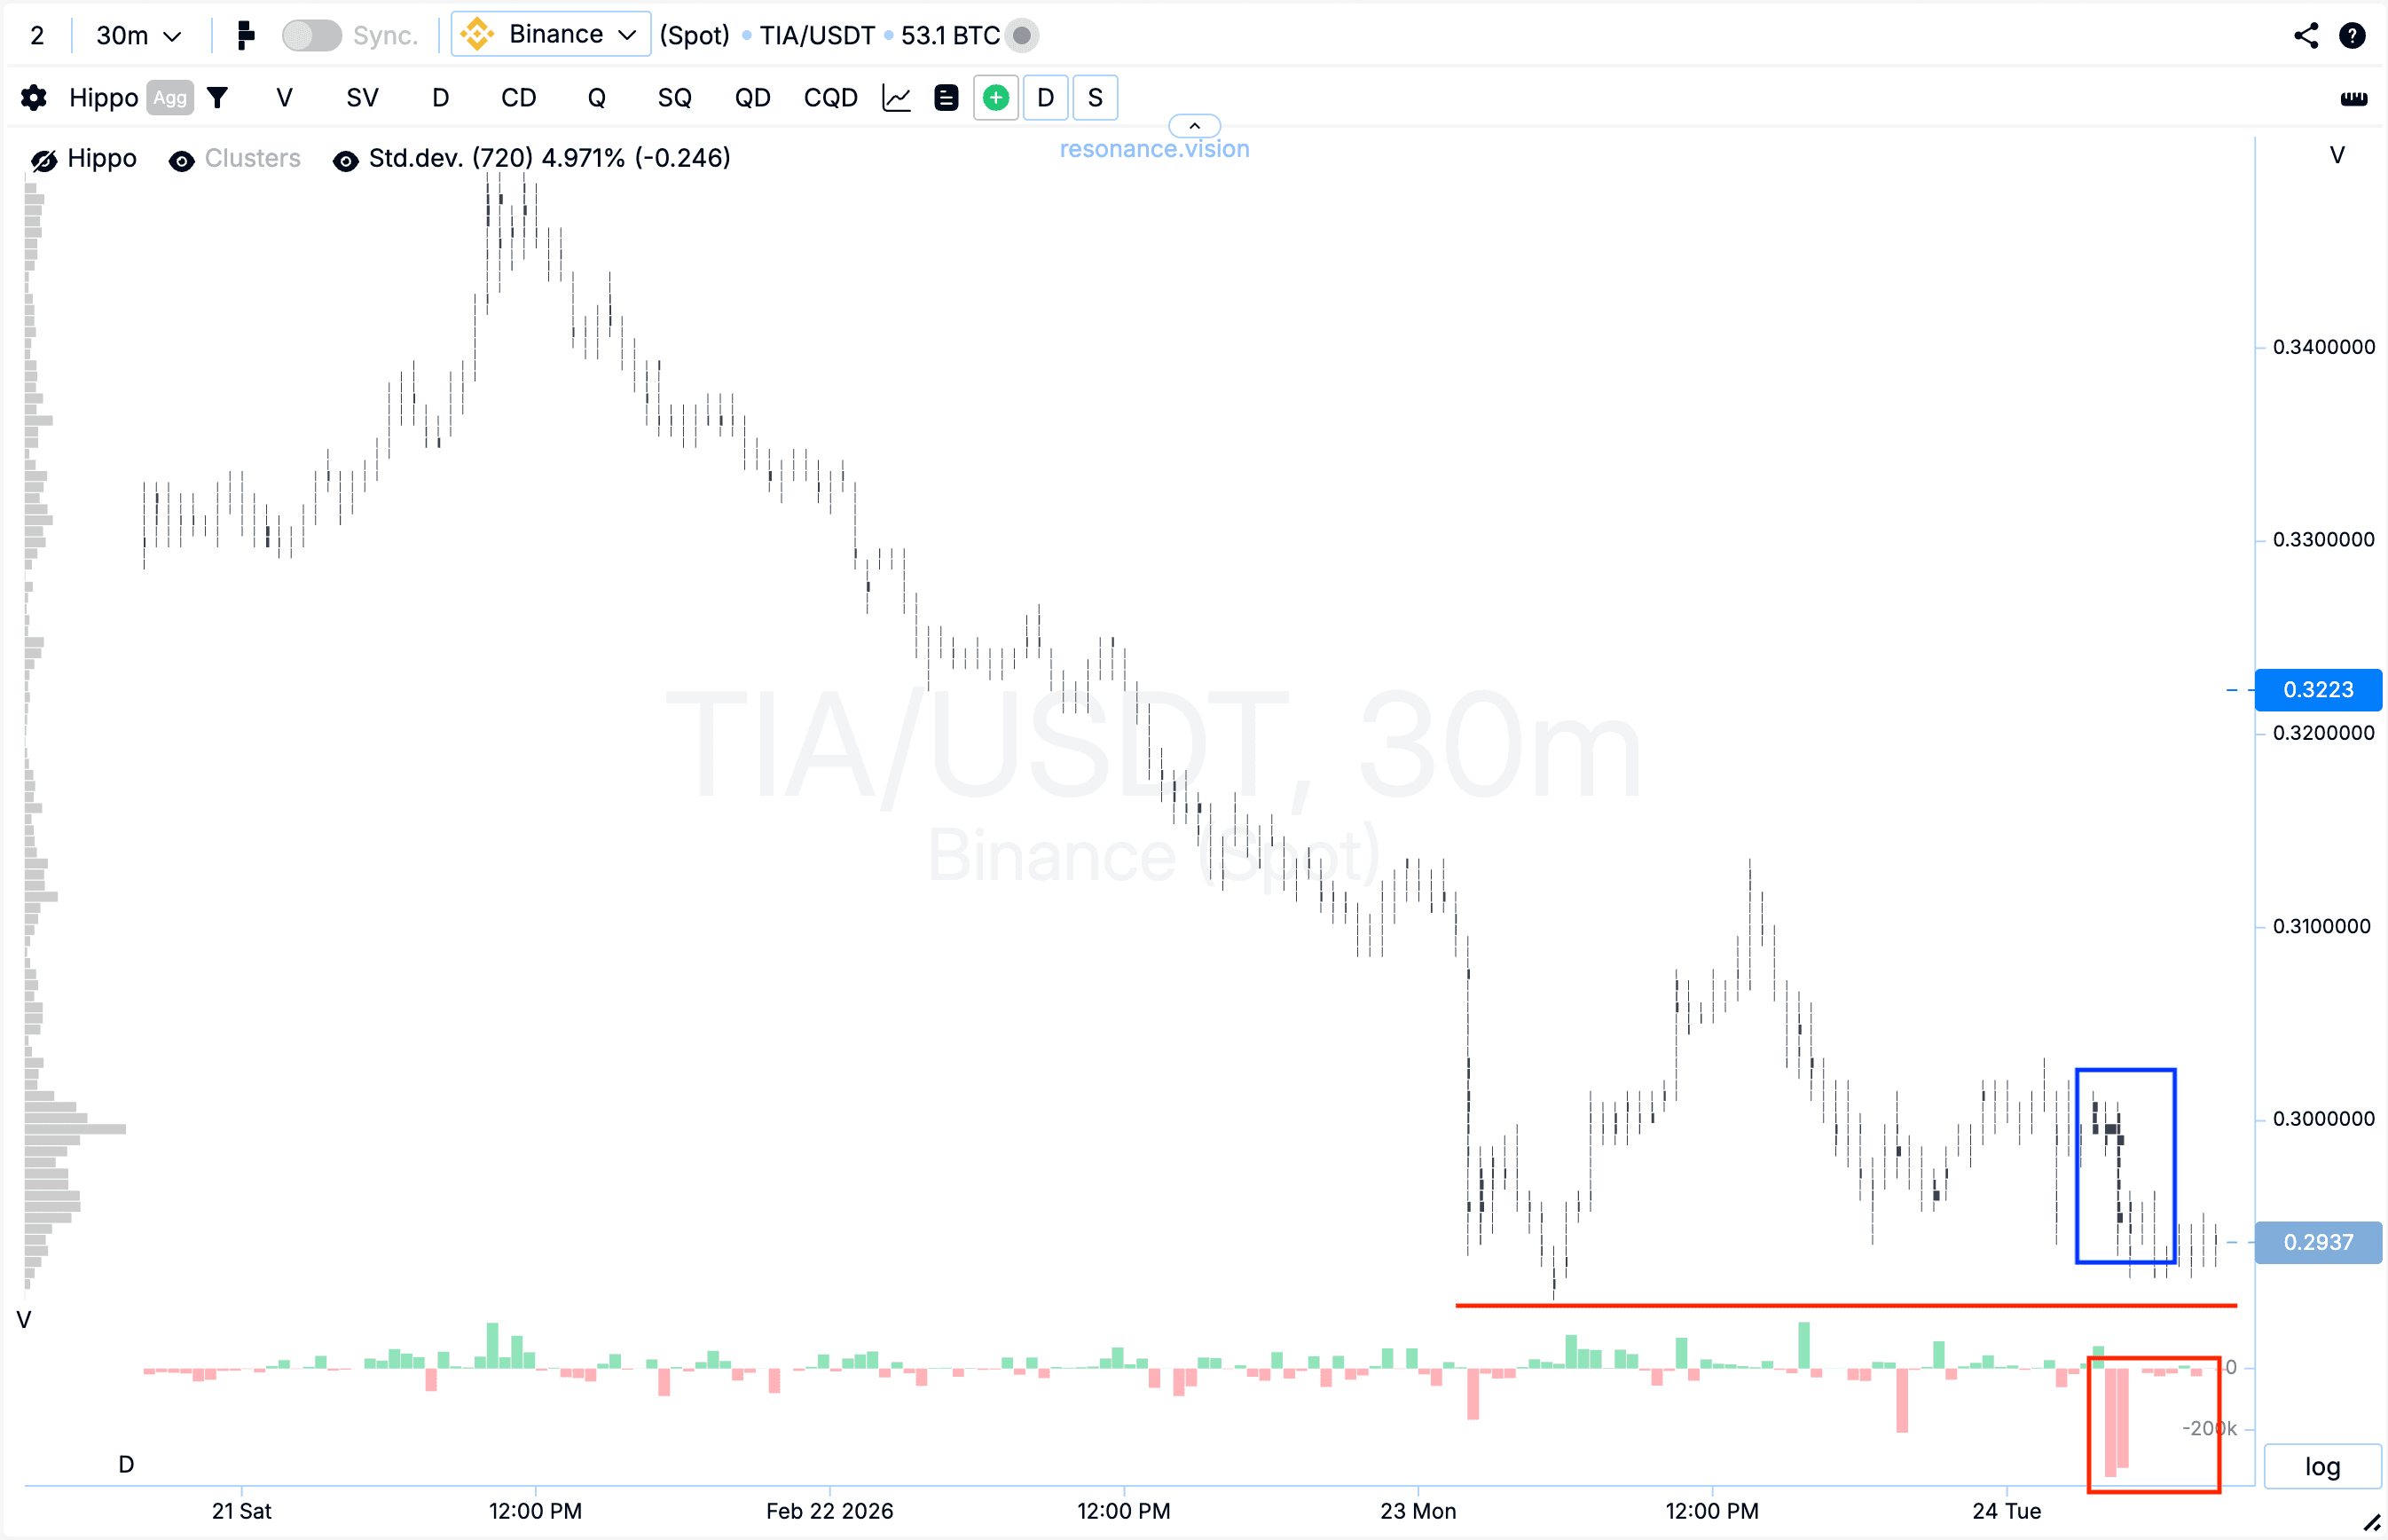
Cluster chart: during a phase of local sideways consolidation, large volume clusters were formed (blue rectangle), within which pronounced pressure from market sell orders was observed. This is clearly visible on the delta histogram (red rectangle).
However, despite the increasing pressure from sellers, the price stopped updating the local minimum (red line). This means that sellers continue to actively expend volume, but their impact on price becomes ineffective.
Such a reaction indicates the formation of signs of a local deficit: the market stops declining even under the dominance of selling. This disproportion between volume and price result often becomes an early signal of a possible shift in initiative.
In the Dashboard
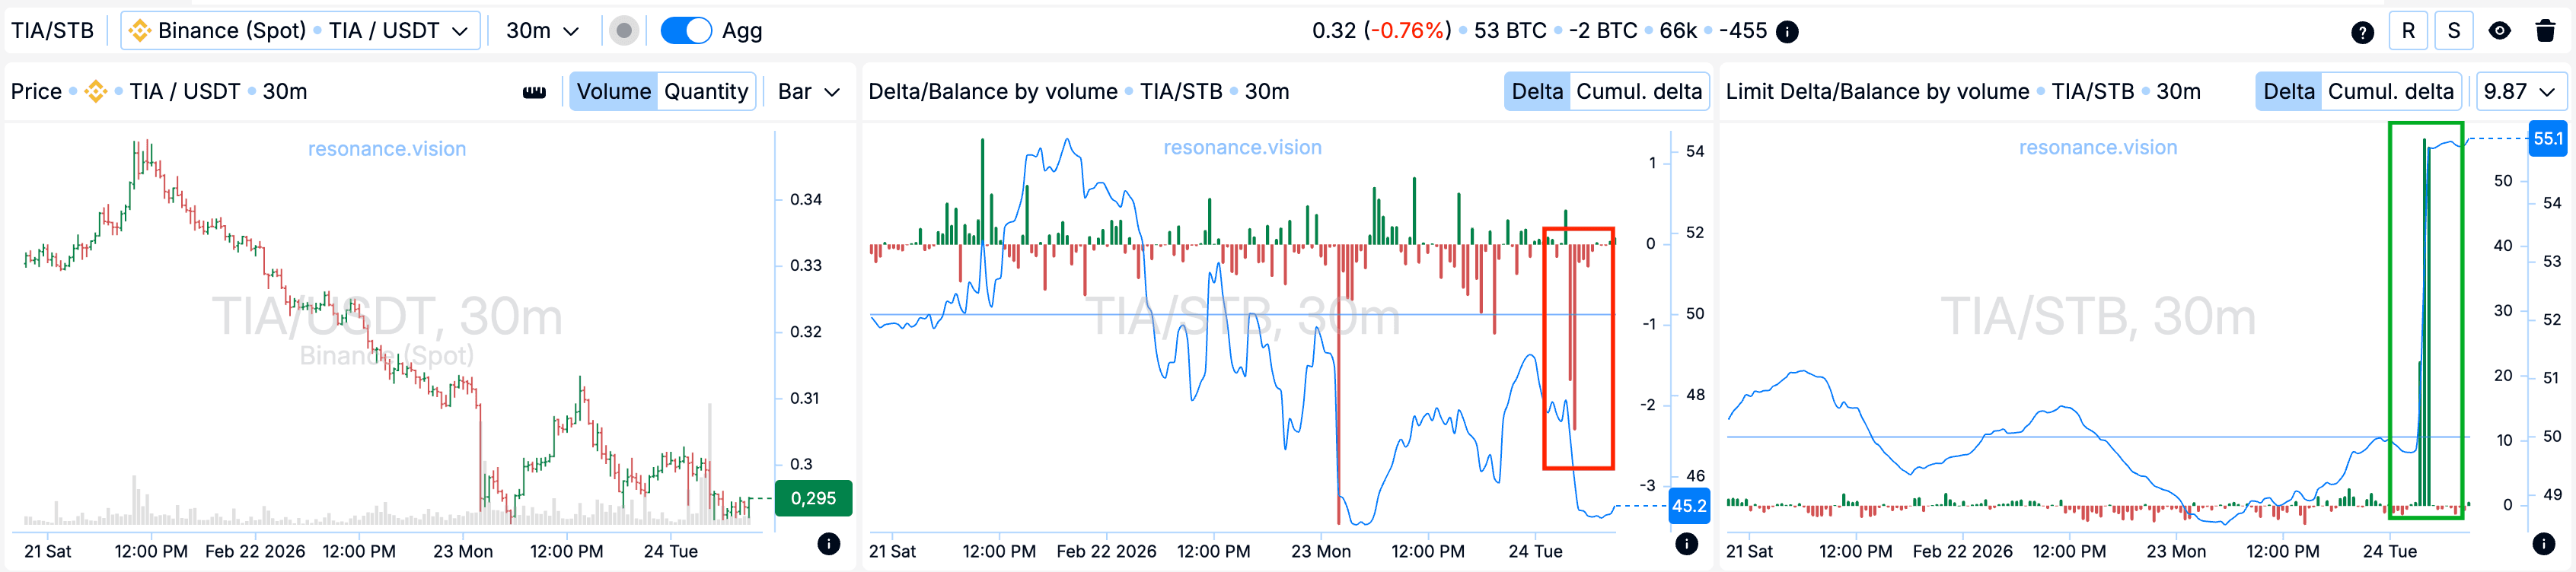
Delta / Volume balance and limit delta: aggregated data across all pairs and exchanges confirms the observations from the cluster chart. During the analyzed period, market sell volumes increased significantly, which is clearly reflected in the delta histogram (red rectangle).
Additionally, during the same period a noticeable dominance of limit buy orders was recorded (green rectangle).
Such a combination indicates active absorption of incoming market sell volume by limit participants. As a result, local support is formed within the current range and the weakening of seller pressure is confirmed.
Exit reasons
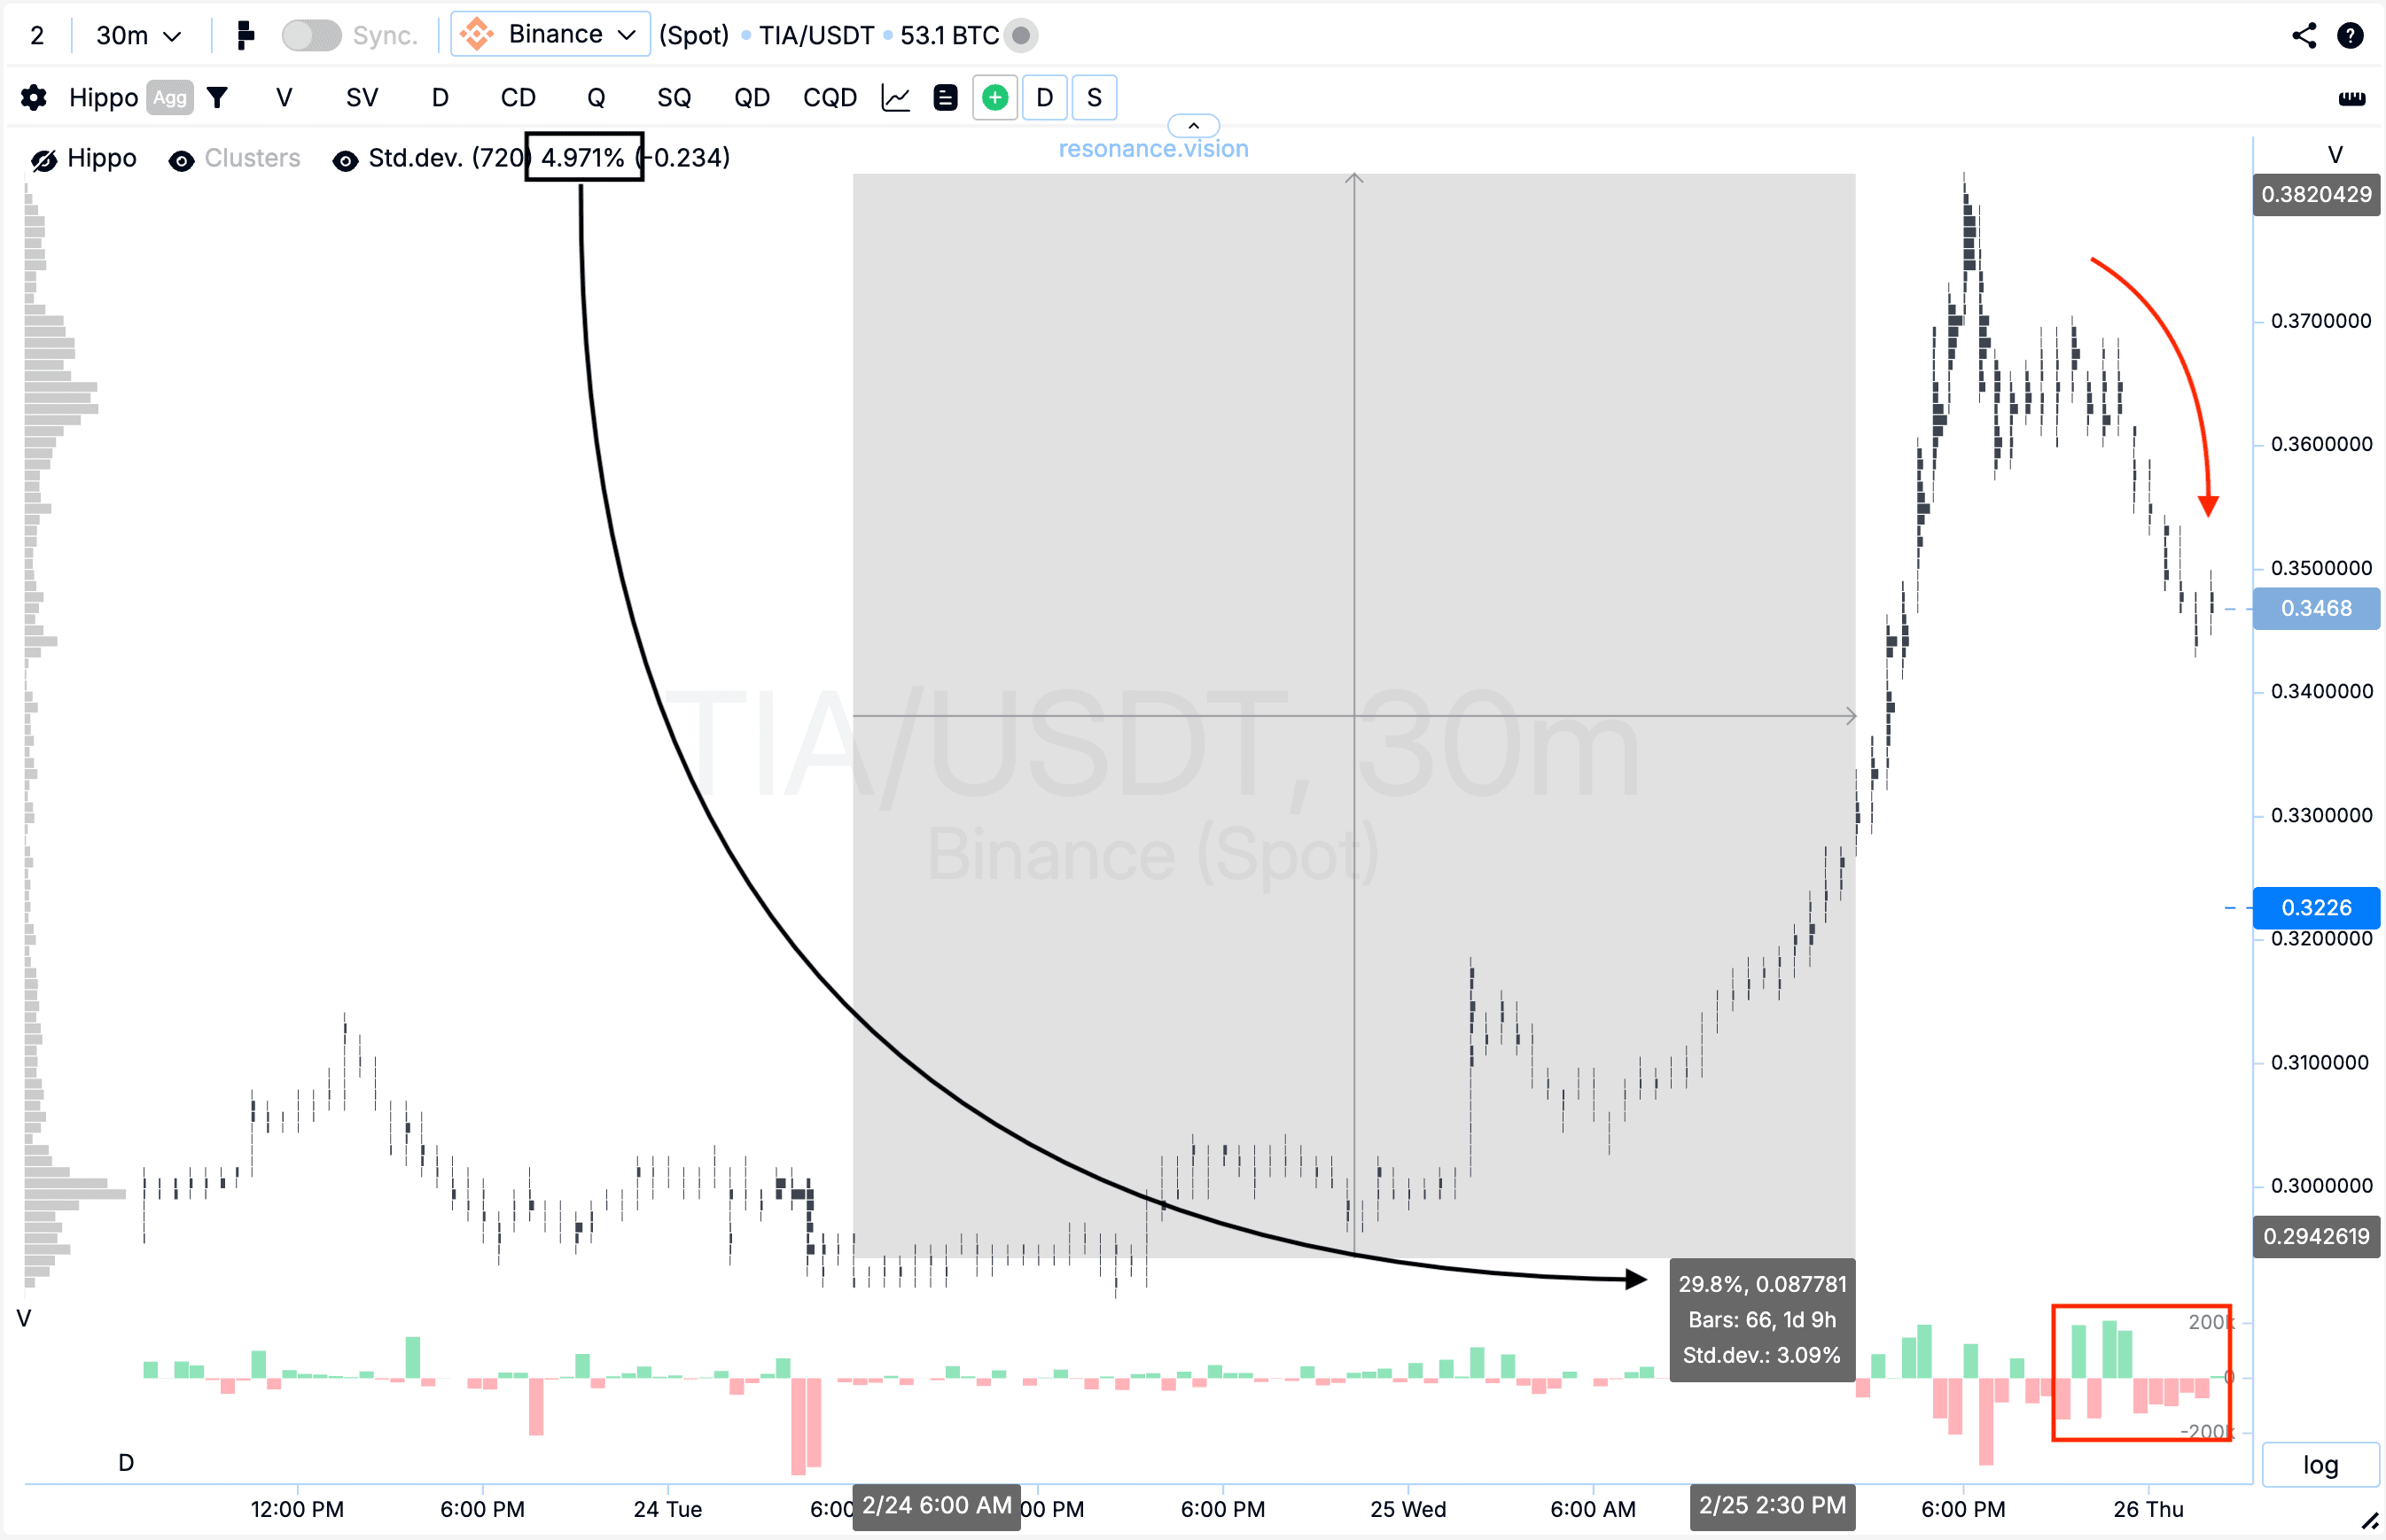
Cluster chart: after the entry point, the price increased by nearly 30%, which corresponds to approximately six standard movements — a statistically anomalous price move (black rectangle and arrow).
Subsequently, market buys stopped leading to new highs and gradually began shifting toward selling. Against this background, the price started to decline (red rectangle and arrow), indicating weakening buyers and a possible takeover of initiative by sellers.
Under conditions of emerging signs of decreasing growth efficiency, further position holding would have been accompanied by increased risk. Therefore, profit-taking in this area appeared to be the most rational and balanced decision from a position management perspective.
Conclusion
Despite the strengthening of market sell orders within the sideways range, the price stopped updating lows, indicating the formation of a local deficit and a gradual weakening of downward initiative.
Confirmation through aggregated data and the dominance of limit buy orders allowed for an objective identification of active supply absorption and a shift in balance toward demand. It was precisely the divergence between delta pressure and price reaction that became the basis for entry.
After the impulse was realized and a statistically anomalous movement occurred, the structure began to change: buying activity stopped demonstrating previous effectiveness, and initiative gradually shifted to sellers. In such a phase, the priority is not attempting to capture the maximum of the move, but preserving the result and controlling risk.
Such an approach allows for systematic work with phases of deficit and surplus, focusing on price reaction and position management rather than expectations of trend continuation.
Follow new insights in our telegram channel.
No need to invent complex schemes and look for the "grail". Use the Resonance platform tools.
Register via the link — get a bonus and start earning:
OKX | BingX | KuCoin.
Promo code TOPBLOG gives you a 10% discount on any Resonance tariff plan.
Recommended articles


