UNI +29.1% (Resonance Directional Strategy)

Ineffective market selling during a repeated decline 📊 Localized shortages form and volume is absorbed by limit buyers. A +30% move and profit-taking after sellers take over.
Table of contents

Asset: UNI/USDT
Risk: medium
Level of understanding: beginner
Entry reasons
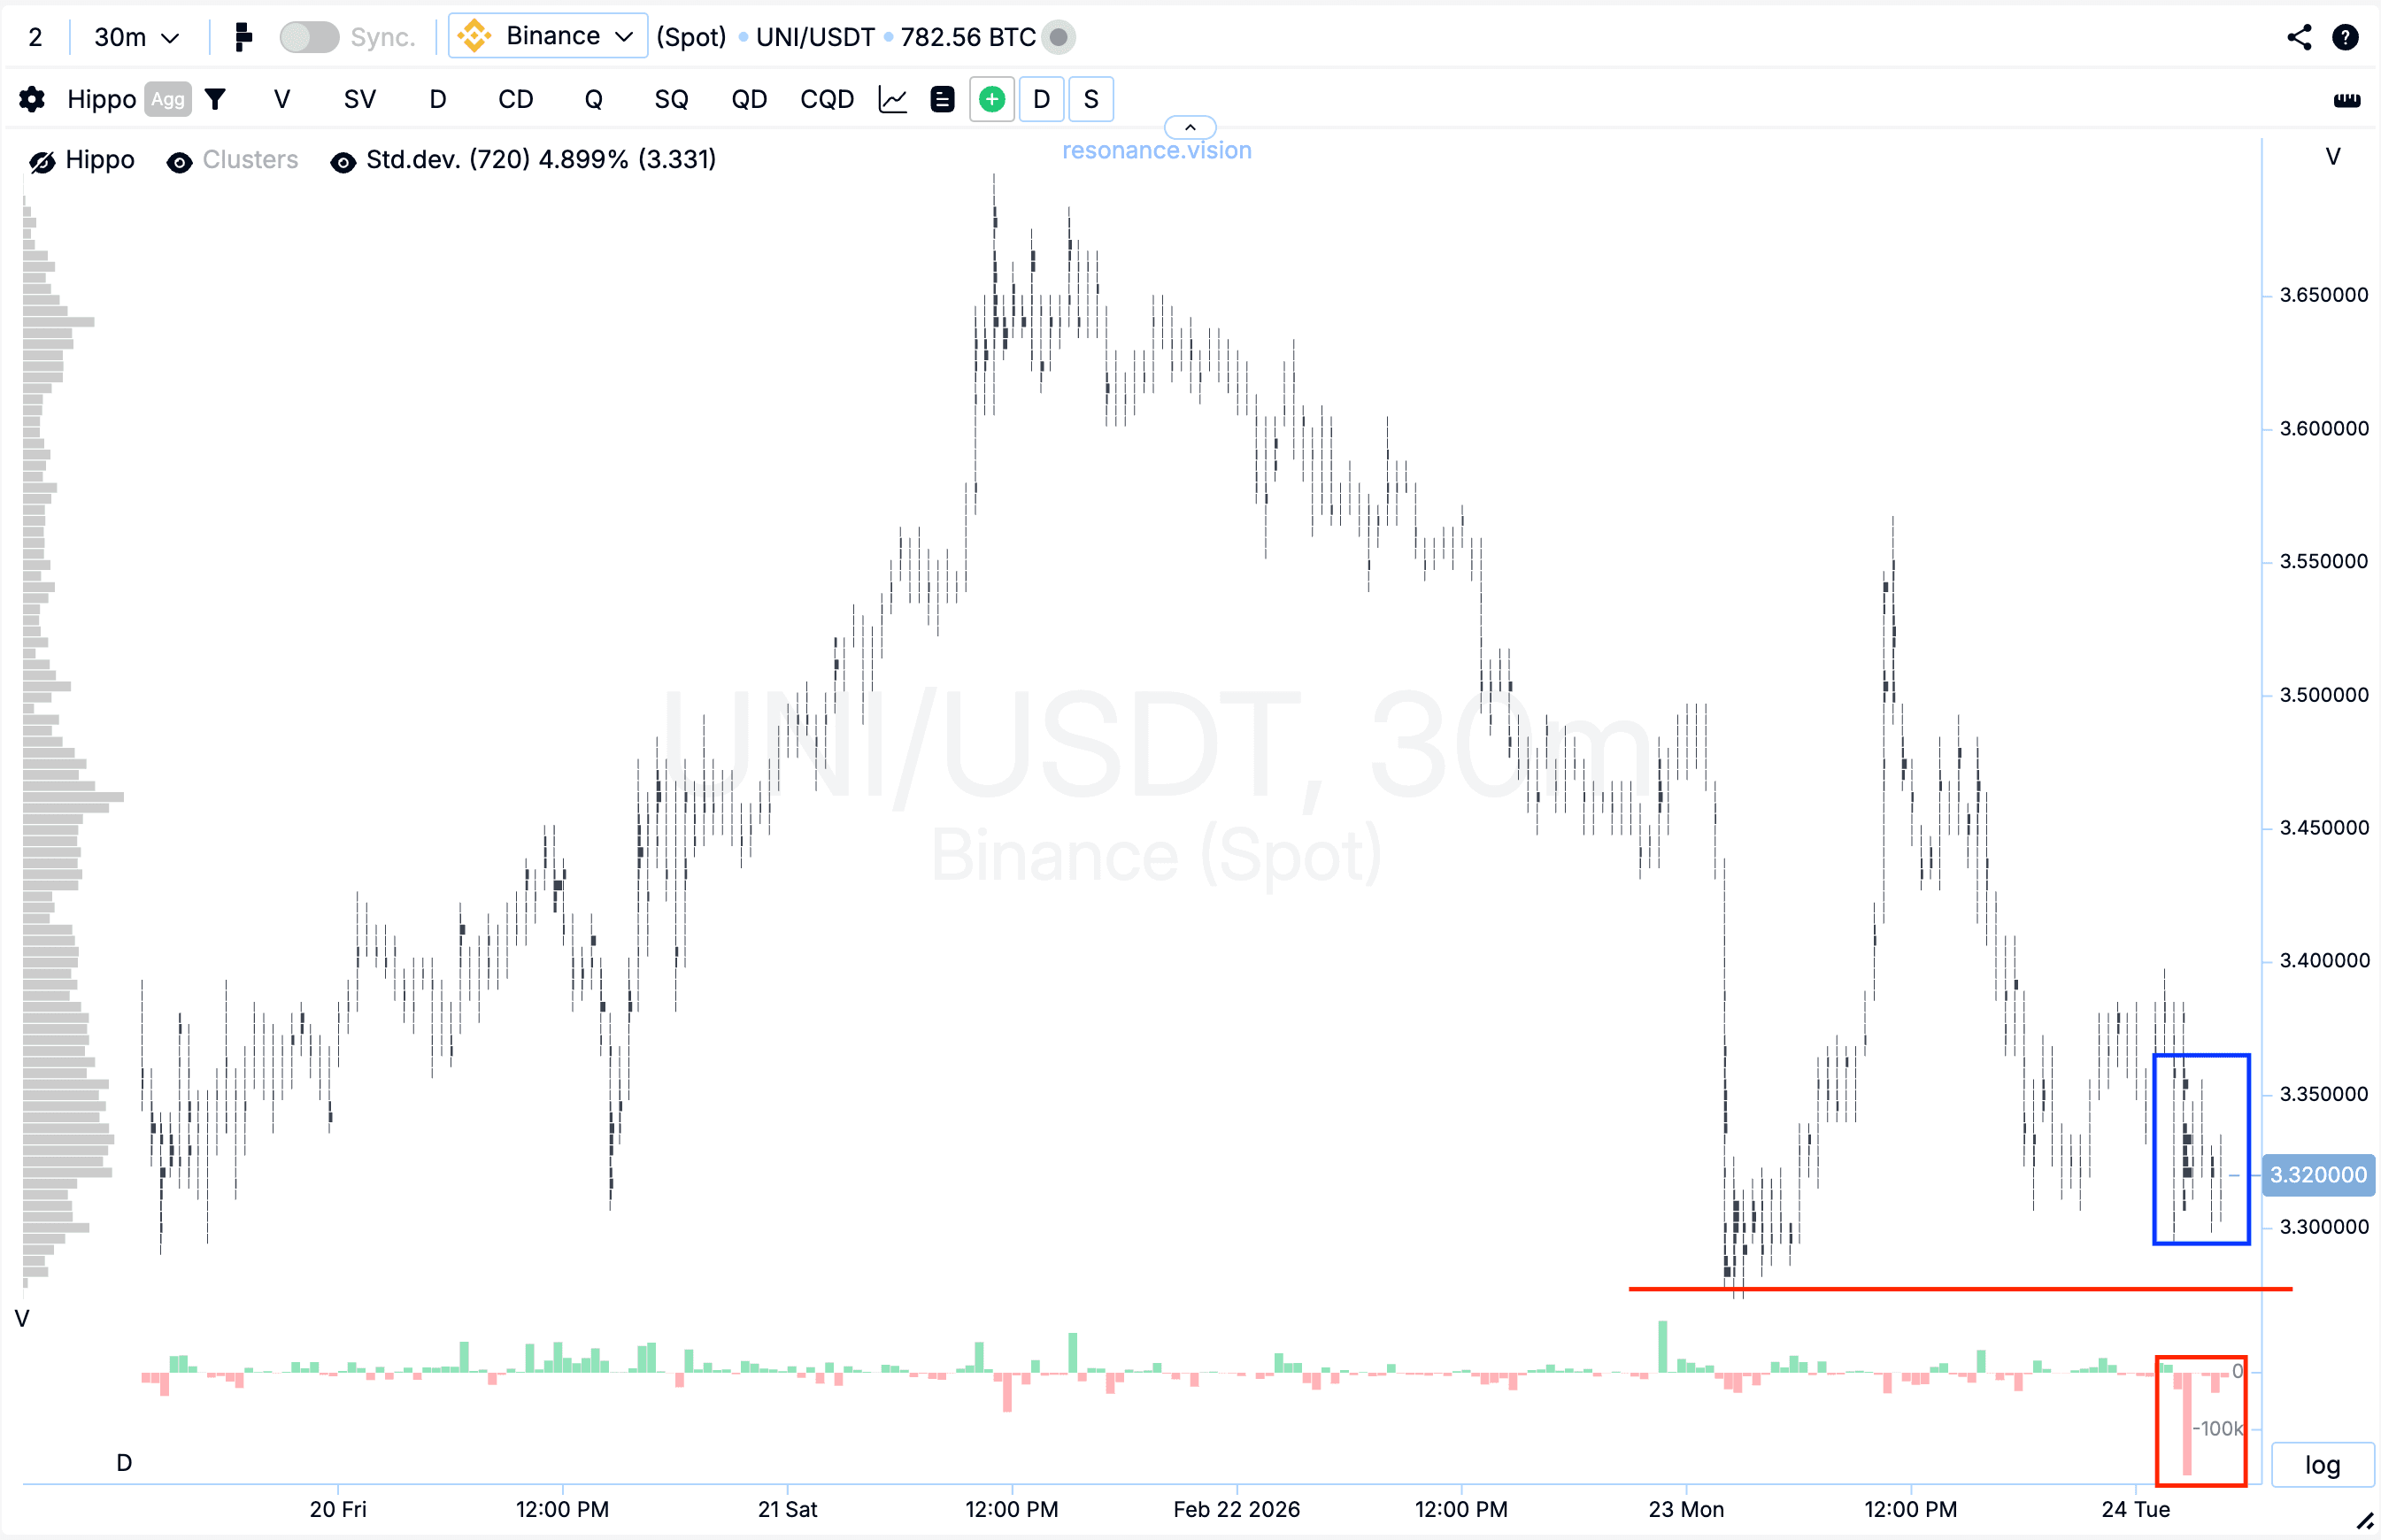
Cluster chart: locally, during a repeated decline, large volume clusters were formed (blue rectangle), within which a pronounced dominance of market sell orders was observed (red rectangle).
However, despite the increasing pressure from sellers, the price failed to update the local minimum (red line).
Such a reaction indicates growing demand and the formation of signs of a local deficit: sellers continue to expend volume, but their impact on price becomes ineffective. Such an imbalance between volume and price result often signals weakening downward initiative and a possible transition to an upward impulse.
In the Dashboard
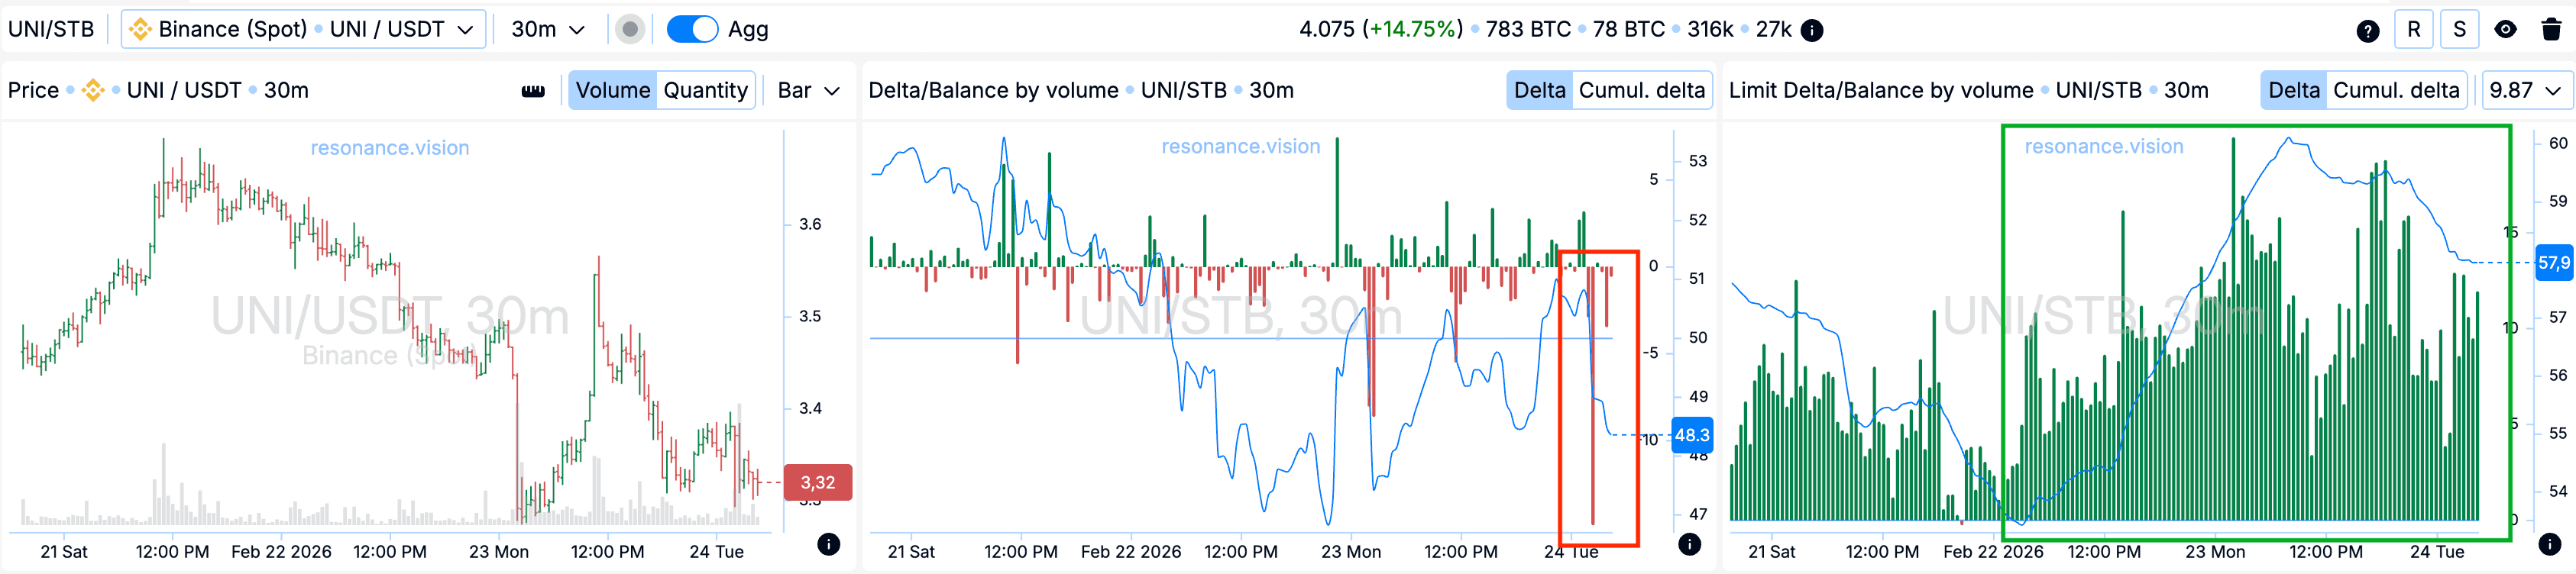
Delta / Volume balance and limit delta: aggregated data across all pairs and exchanges confirms the picture observed on the cluster chart. During the analyzed period, increased pressure from market sell orders was recorded, which is clearly reflected in the delta histogram (red rectangle).
At the same time, the limit delta shows increasing dominance of limit buy orders (green rectangle).
Such a combination indicates active absorption of incoming market sell volume by limit buyers. As a result, local support is formed within the current range, further confirming signs of supply deficit and a shift in balance toward buyers.
Exit reasons
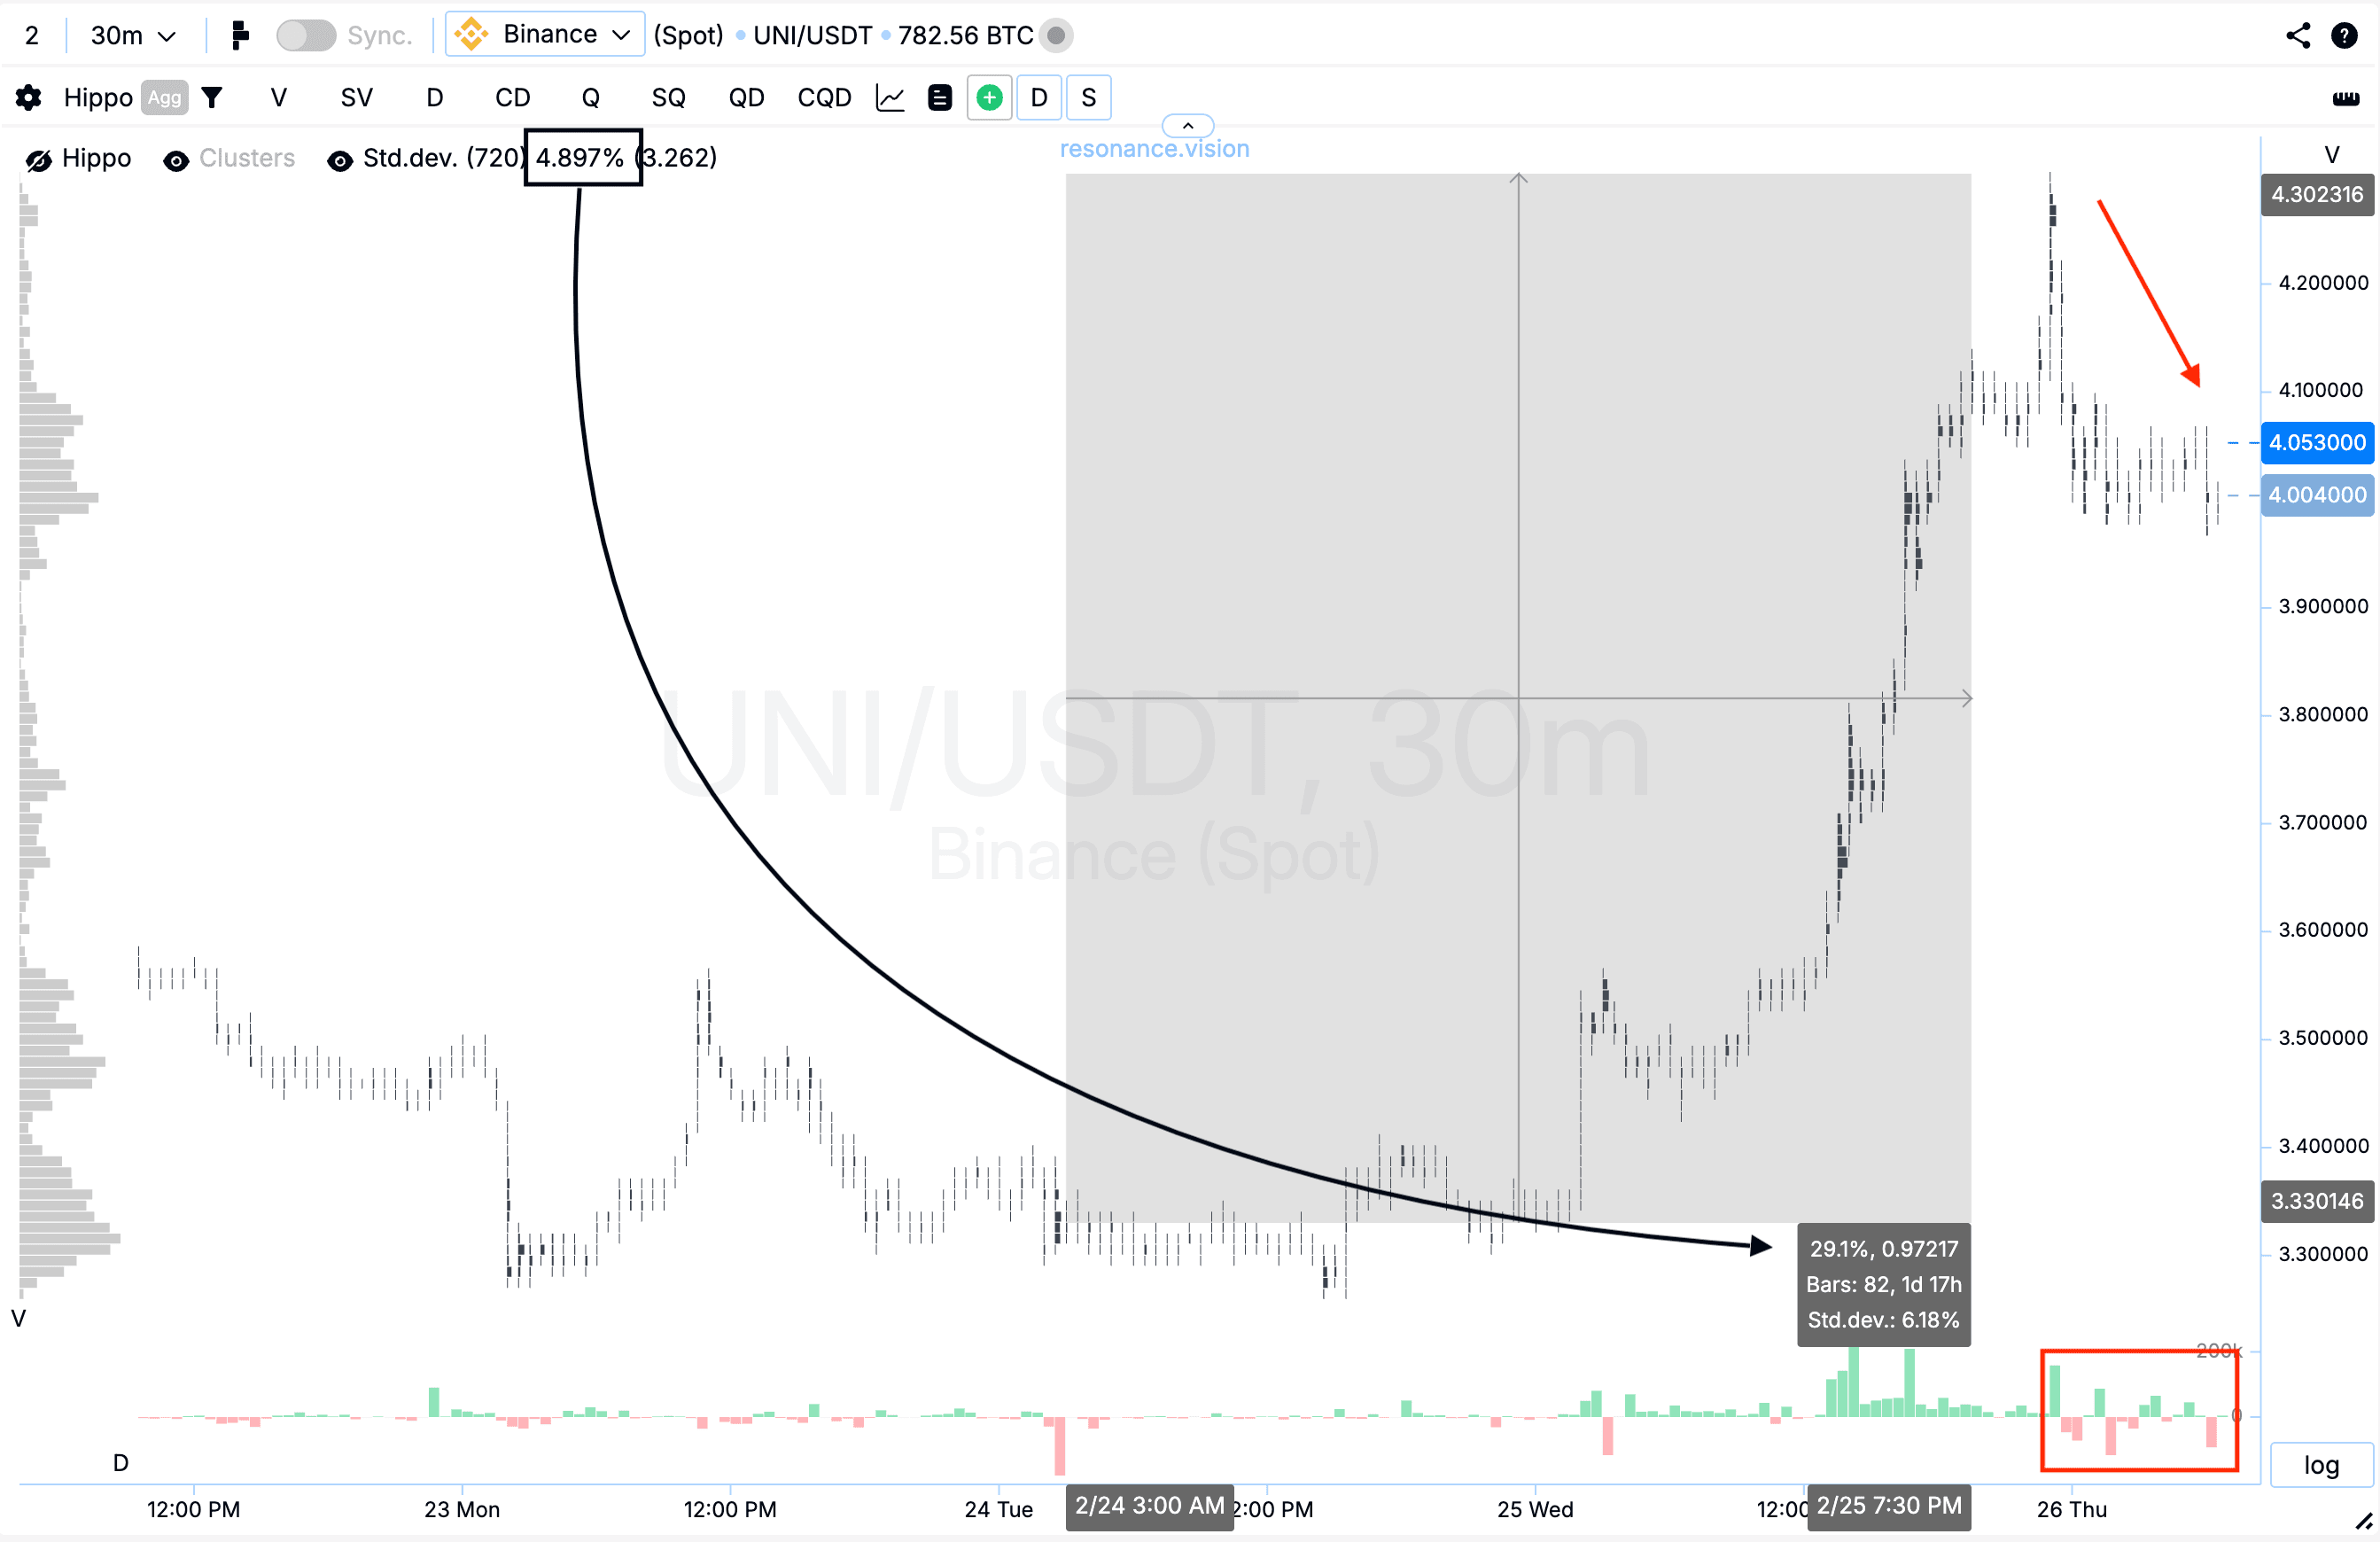
Cluster chart: after the entry point, the price increased by nearly 30%, which represents a significant movement and corresponds to almost six standard deviations — and is a statistically anomalous move (black rectangle and arrow).
After the final impulse, a pullback followed with gradual decline, during which market orders began shifting toward market sells (red rectangle and arrow). This indicates a takeover of initiative by sellers and weakening pressure from buyers.
Under such conditions, further position holding would have been accompanied by increased risk. Therefore, profit-taking appeared to be the most rational and balanced decision, allowing the realized movement to be secured and the result to be protected.
Conclusion
In this analysis, the key factor was the assessment of volume effectiveness. Despite the strengthening of market sell orders during the repeated decline, the price failed to update the local minimum, indicating the formation of a local deficit and a gradual weakening of downward initiative.
Confirmation through aggregated data and the sustained dominance of limit buy orders allowed for an objective identification of the shift in balance toward demand. The evaluation of volume pressure and price reaction became the foundation for entering the position.
Such an approach allows for systematic work with phases of deficit, focusing on price reaction and risk management rather than expectations of trend continuation.
Follow new insights in our telegram channel.
No need to invent complex schemes and look for the "grail". Use the Resonance platform tools.
Register via the link — get a bonus and start earning:
OKX | BingX | KuCoin.
Promo code TOPBLOG gives you a 10% discount on any Resonance tariff plan.
Recommended articles


