VIRTUAL +37.2% (Directional Strategy Resonance)
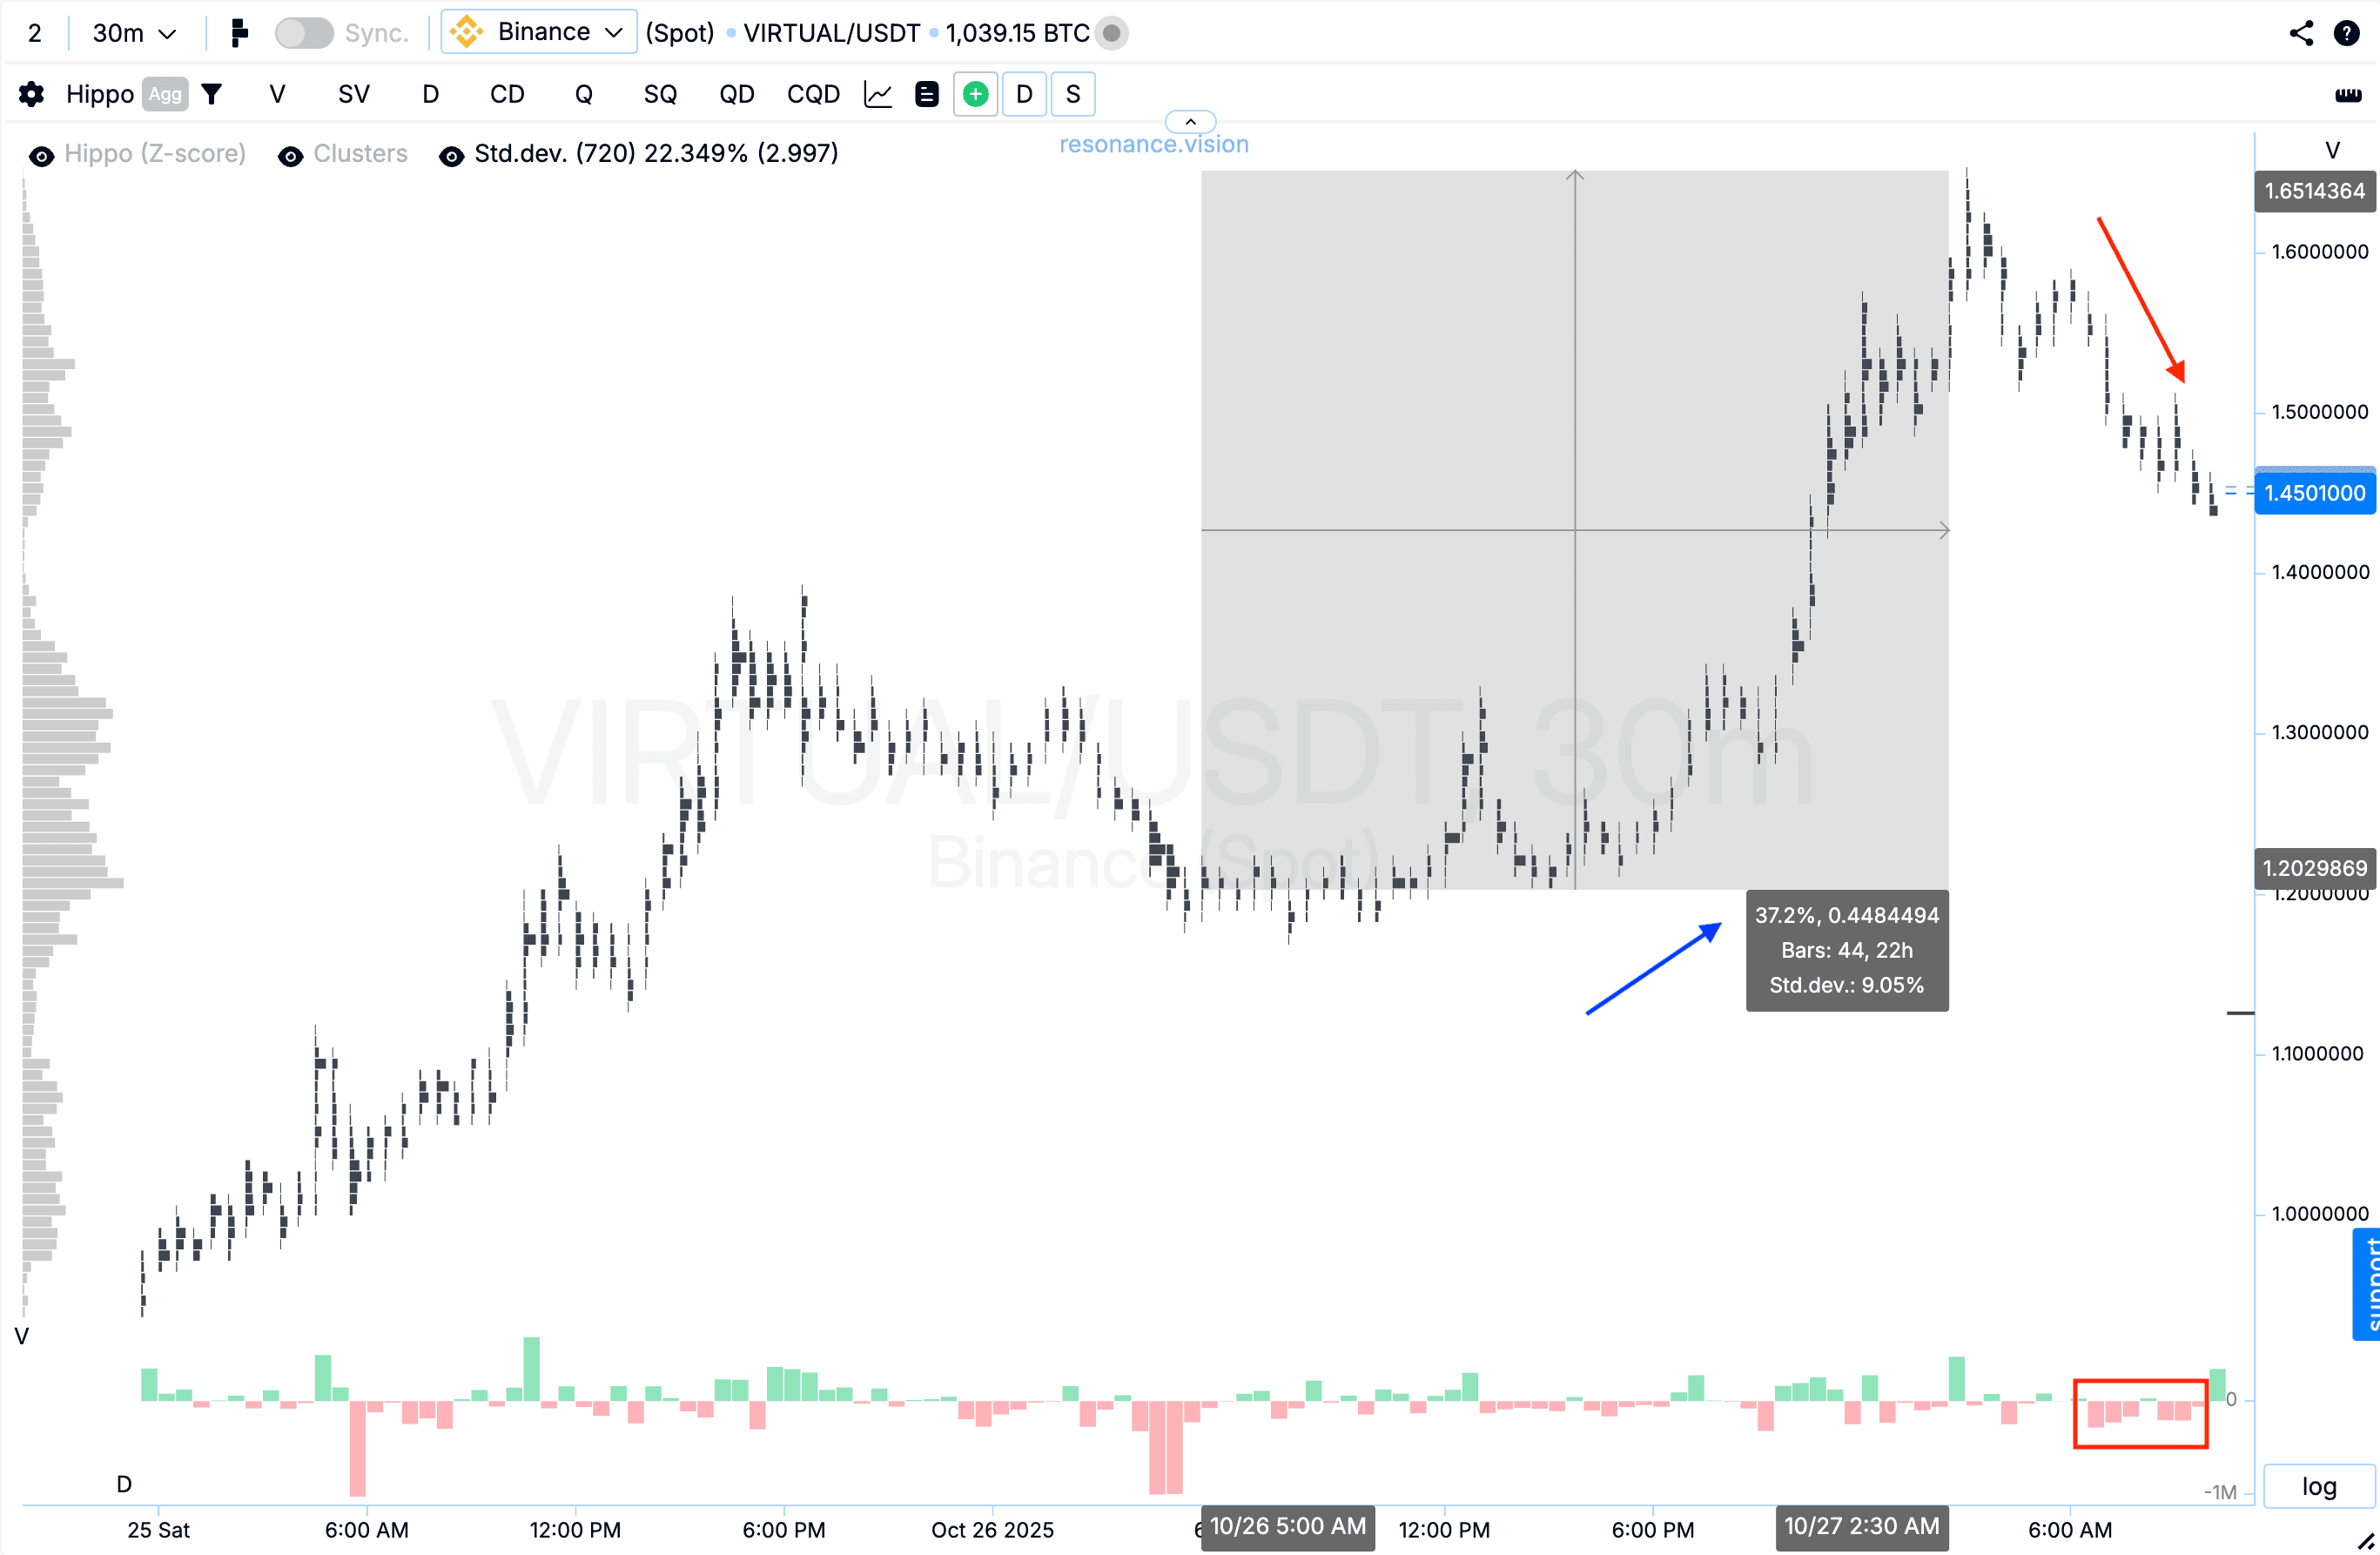
An example of how price behavior can change after a rise. It’s important not only to see volumes but also to understand how the market reacts to them—this helps you lock in gains early and avoid giving up your profits.
Table of contents

Coin: VIRTUAL/USDT
Risk: Medium
Experience Level: Beginner
Entry Reasons
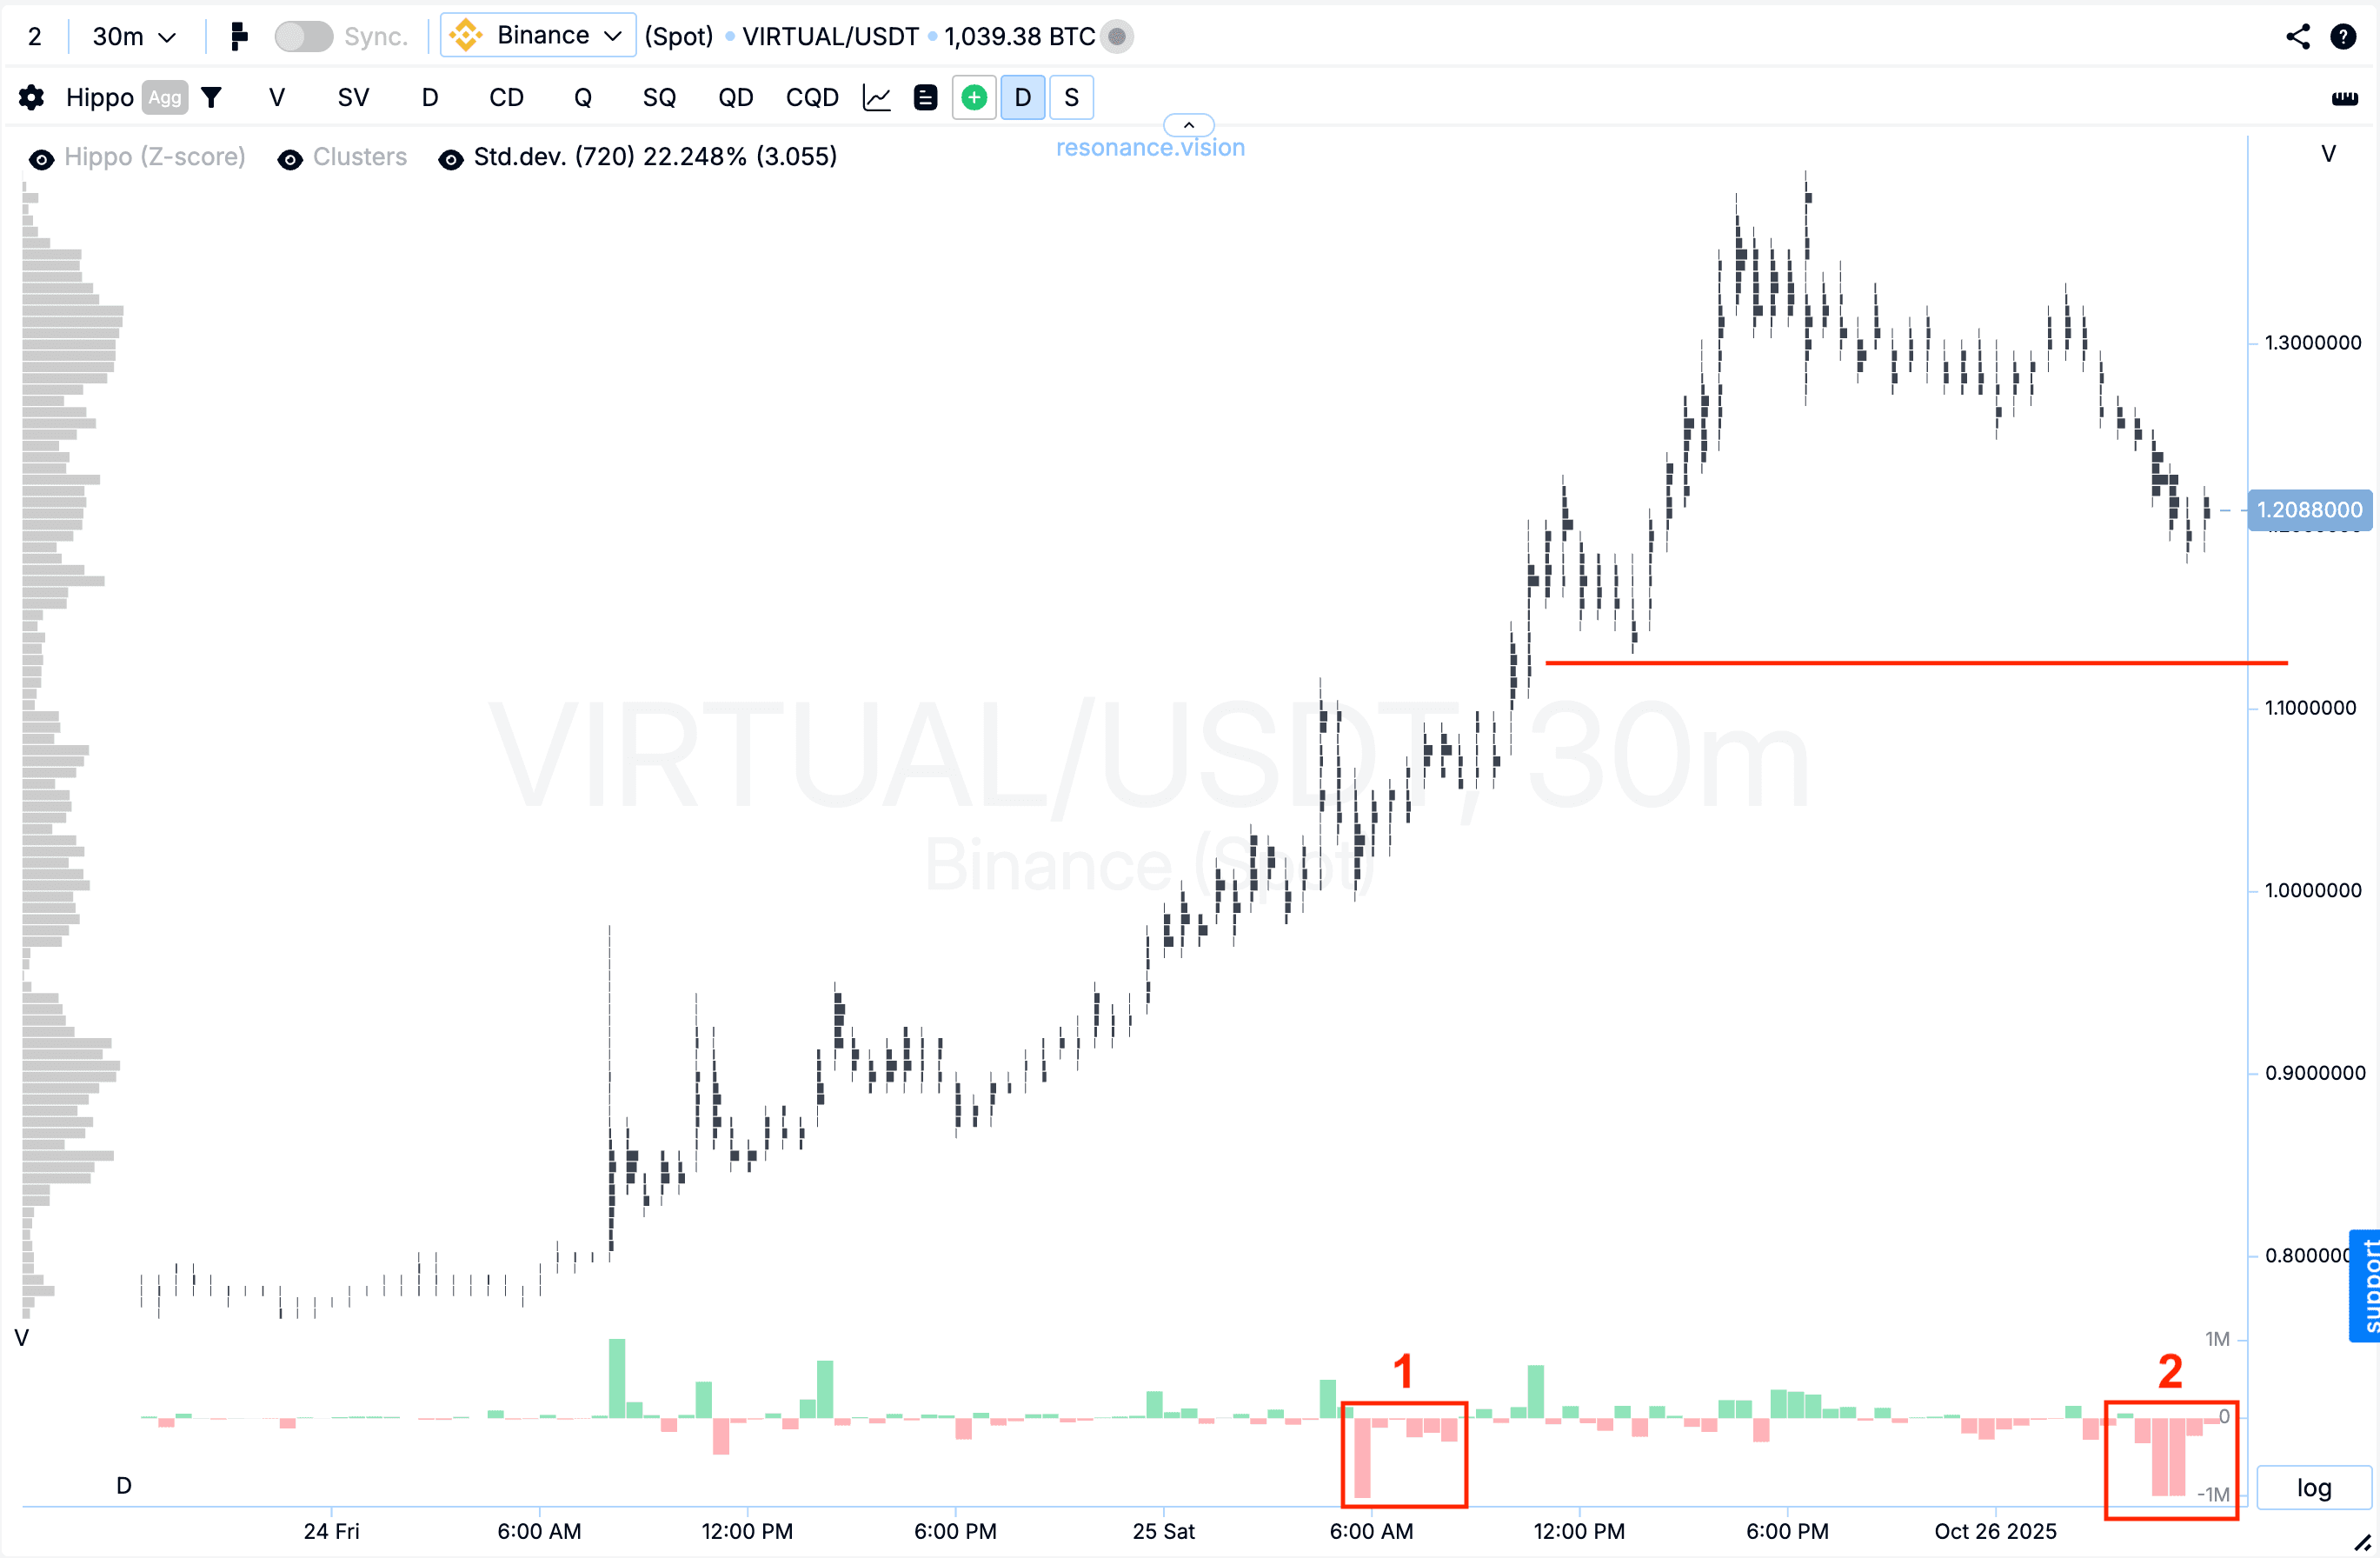
Cluster Chart: When large sell volumes appeared (red rectangle #1), the price did not decline, indicating signs of a local supply deficit. Additionally, during the pullback, even after another wave of heavy sell activity (red rectangle #2), the price failed to break the local low again — confirming the continued presence of a supply shortage and weakening selling pressure.
Dashboard
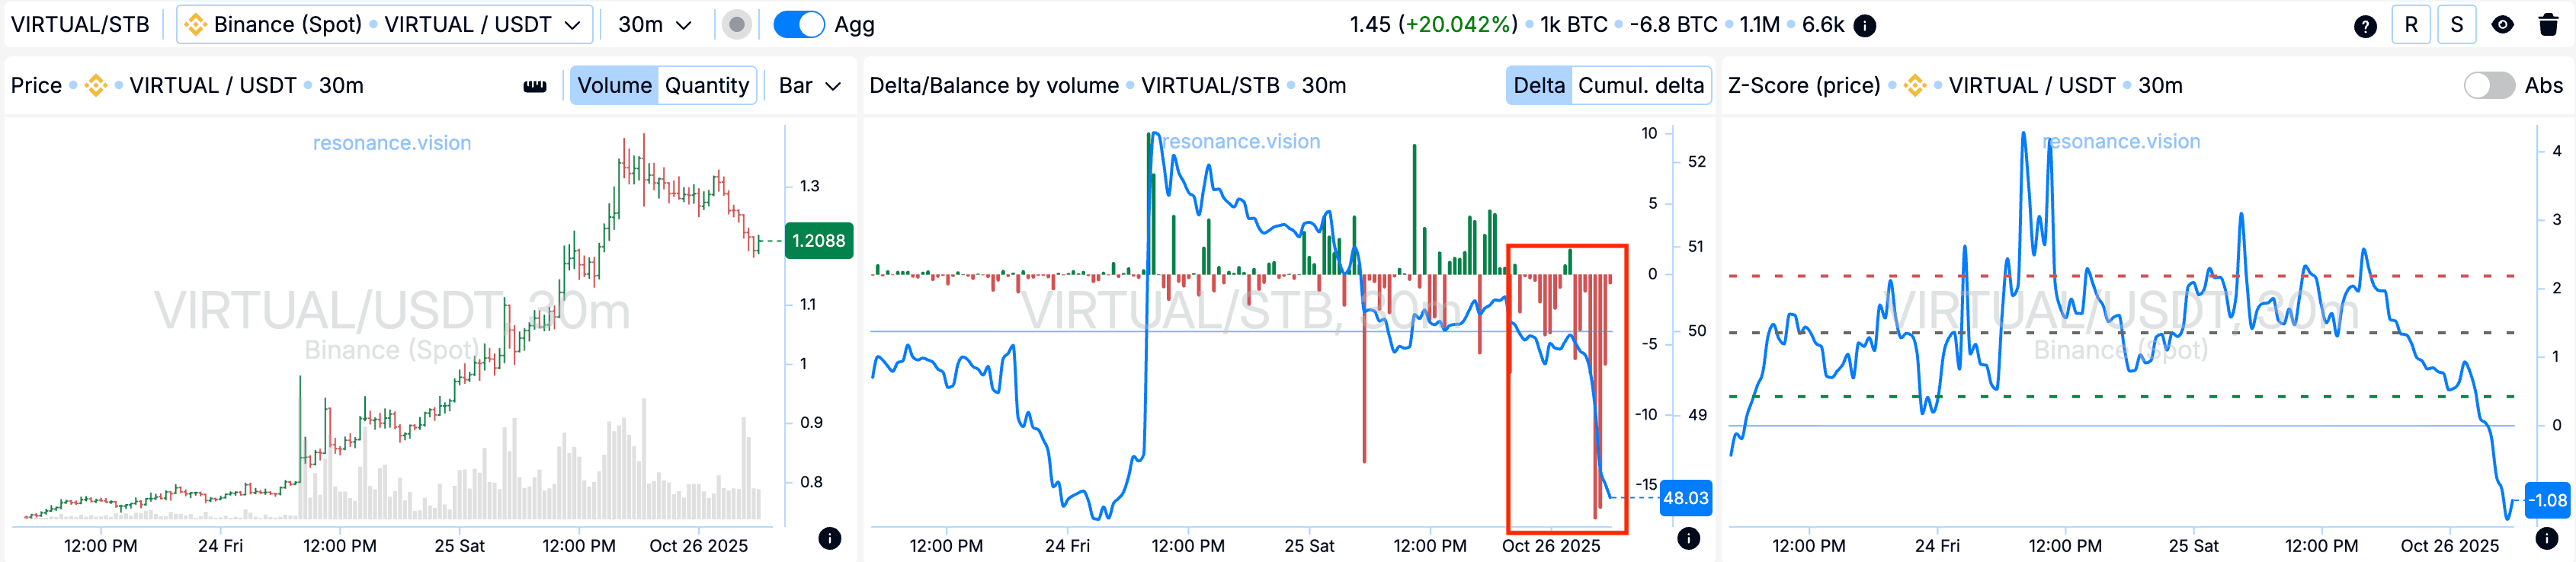
Delta / Volume Balance: Across all pairs and exchanges, there was a clear increase in market sell orders — visible on the delta histogram (red rectangle). However, despite this intensified selling pressure, the price did not form a new local low. Such behavior signals inefficient market selling and indicates a localized supply deficit.
Exit Reasons
Cluster Chart: From the entry point, the price gained around 40%. However, as subsequent moderate sell volumes appeared (red arrow and rectangle), the price started to gradually decline. This suggests that sellers began to regain control, and market selling started to become effective again.
Conclusion
A great example of why it’s important to observe not just volume, but also how the price reacts to it. Initially, the market confidently absorbed selling pressure, but after the rally, the situation shifted — even relatively small sell volumes began to push the price downward. In such moments, it’s better to lock in profits and wait for the next setup or look for new opportunities.
Follow new insights in our telegram channel.
No need to invent complex schemes and look for the “grail”. Use the Resonance platform tools.
Register via the link — get a bonus and start earning:
OKX | BingX | KuCoin.
Promo code TOPBLOG gives you a 10% discount on any Resonance tariff plan.
Recommended articles