ZEC +28.5% (Resonance Directional Strategy)

A trade analysis through the lens of volume efficiency: how the dominance of selling without a price decline formed an entry point, and a change in order structure allowed for timely profit-taking.
Table of contents

Asset: ZEC/USDT
Risk: high
Level of understanding: beginner
Entry reasons
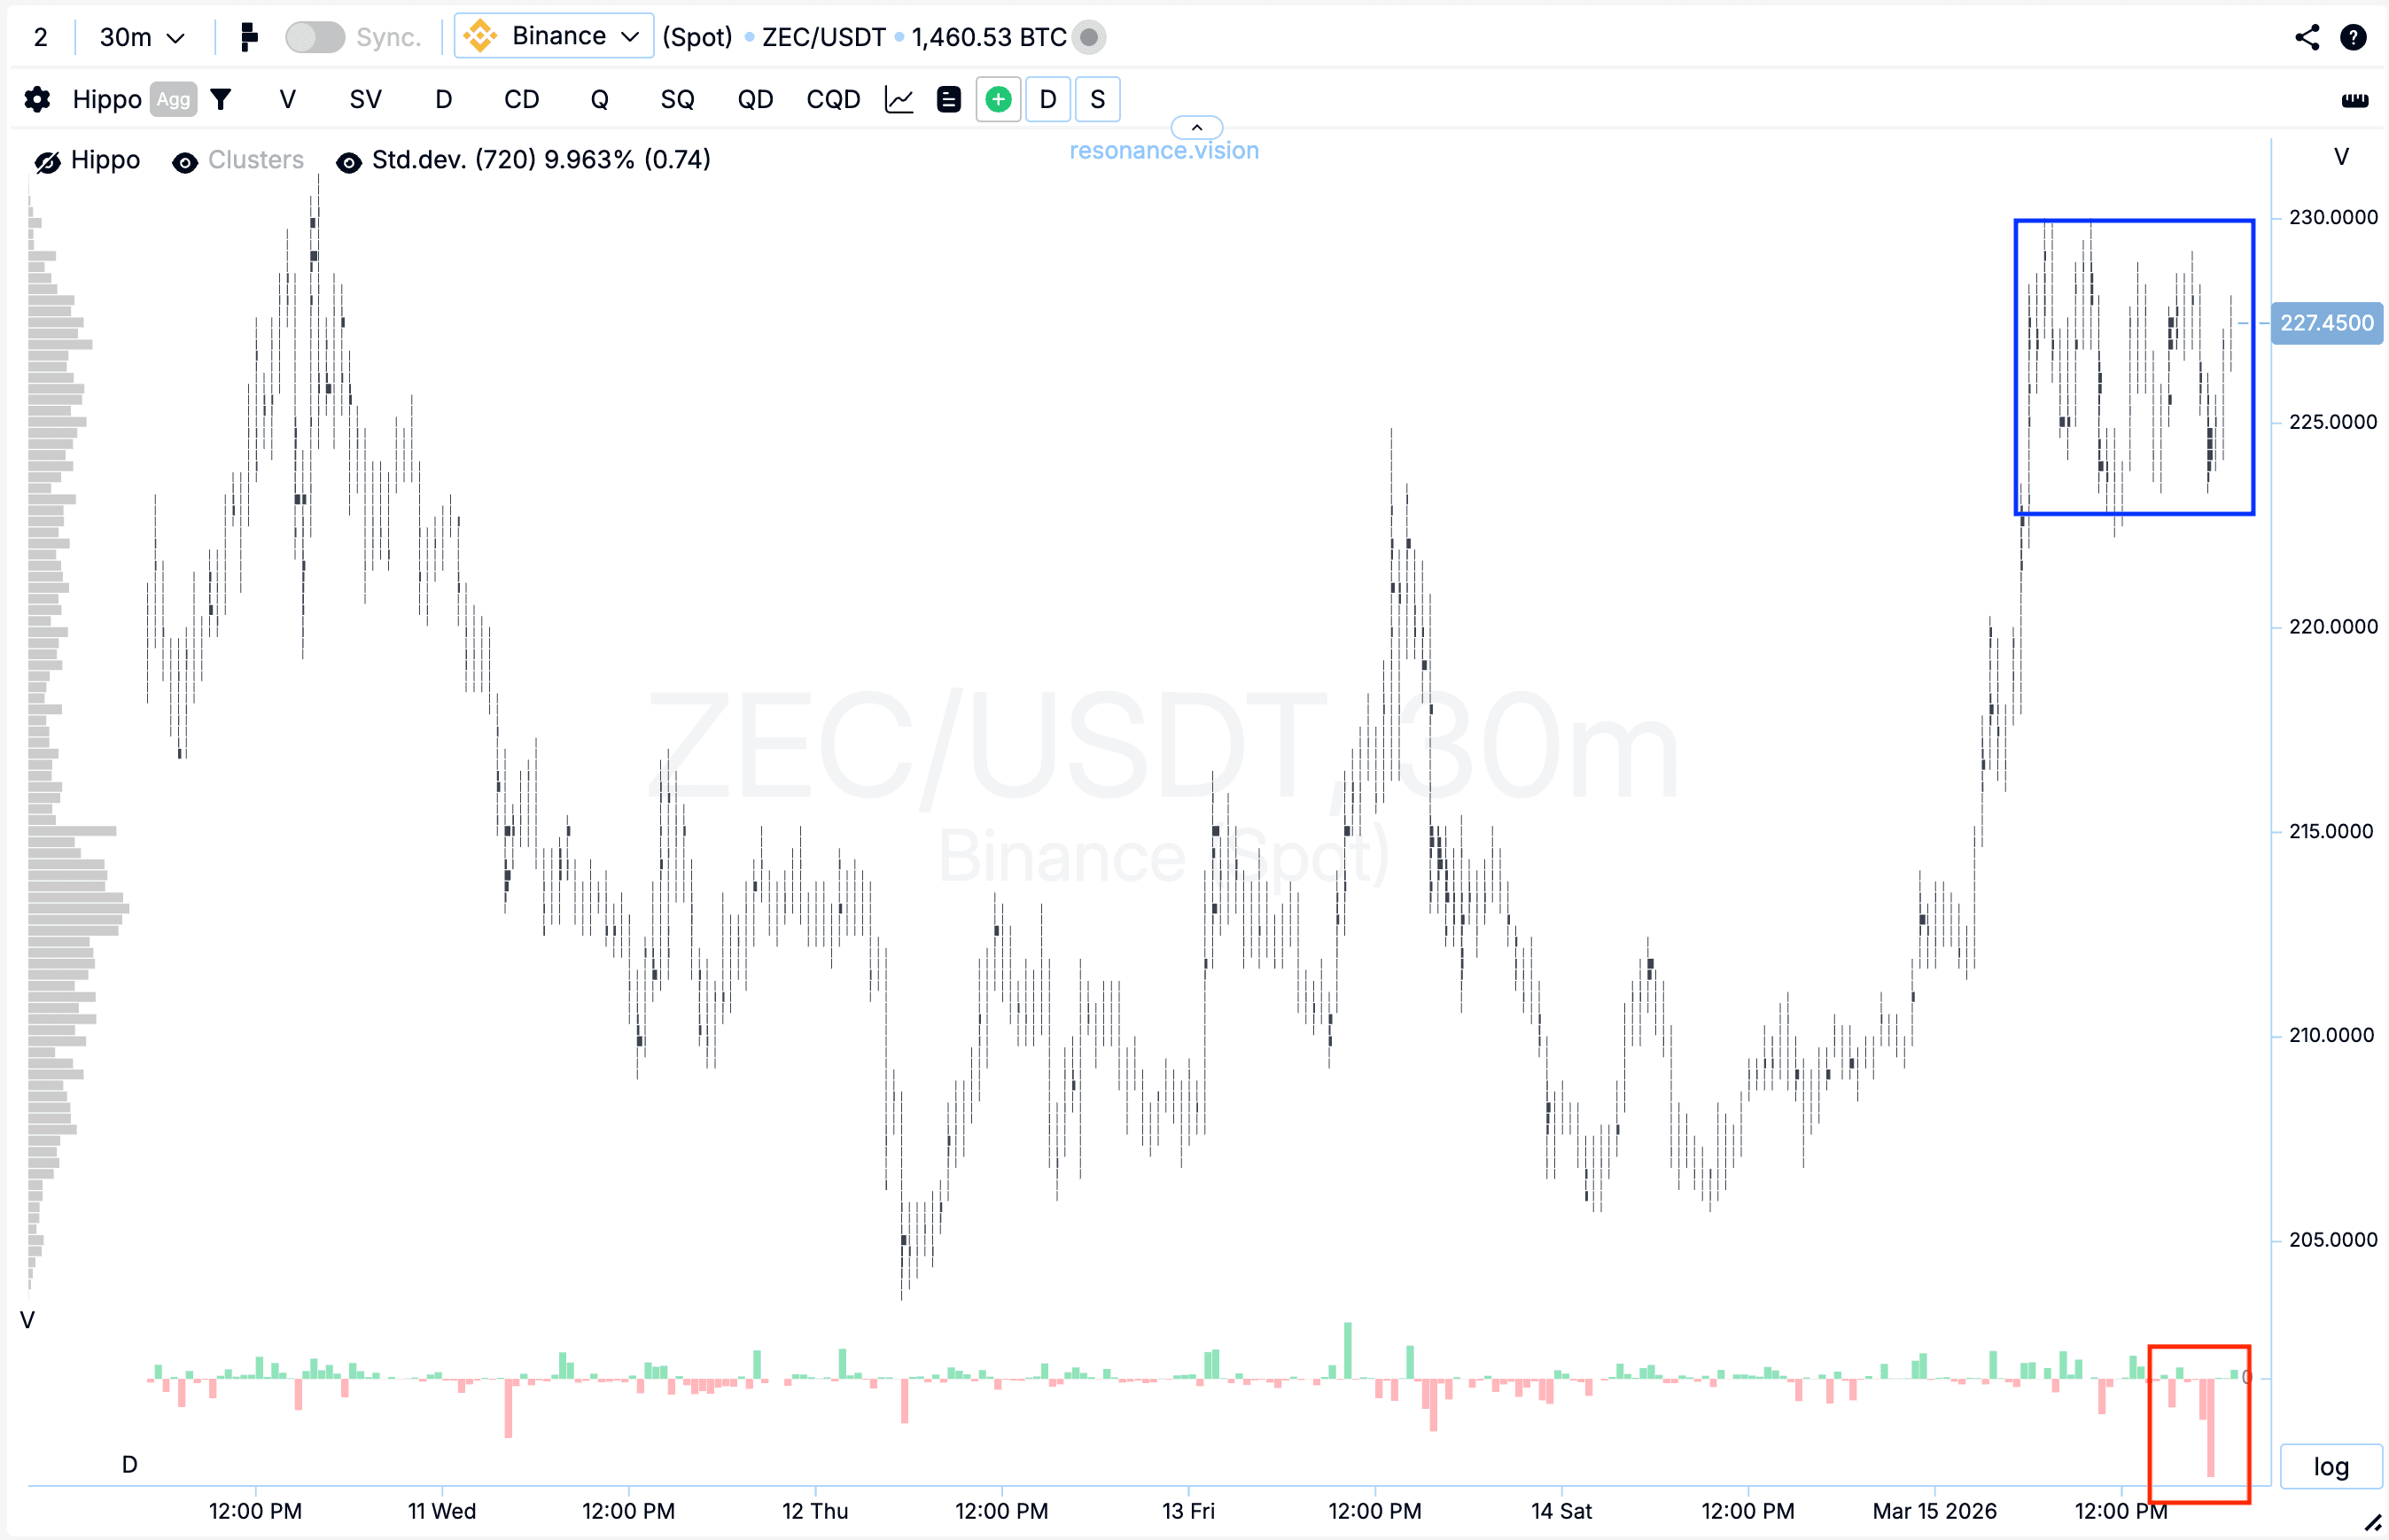
Cluster chart: during the local upward movement, large volume clusters began to form (blue rectangle), within which there was pronounced pressure from market sell orders. This is clearly visible on the delta histogram (red rectangle).
However, despite increasing pressure from sellers, the price stopped reacting with a decline.
This means that sellers continued to actively spend volume, but their impact on price became ineffective.
Such a reaction indicates the presence of signs of a local deficit: the market stops declining even under dominant selling pressure, which suggests weakening seller initiative and a possible shift in balance toward buyers.
In the Dashboard
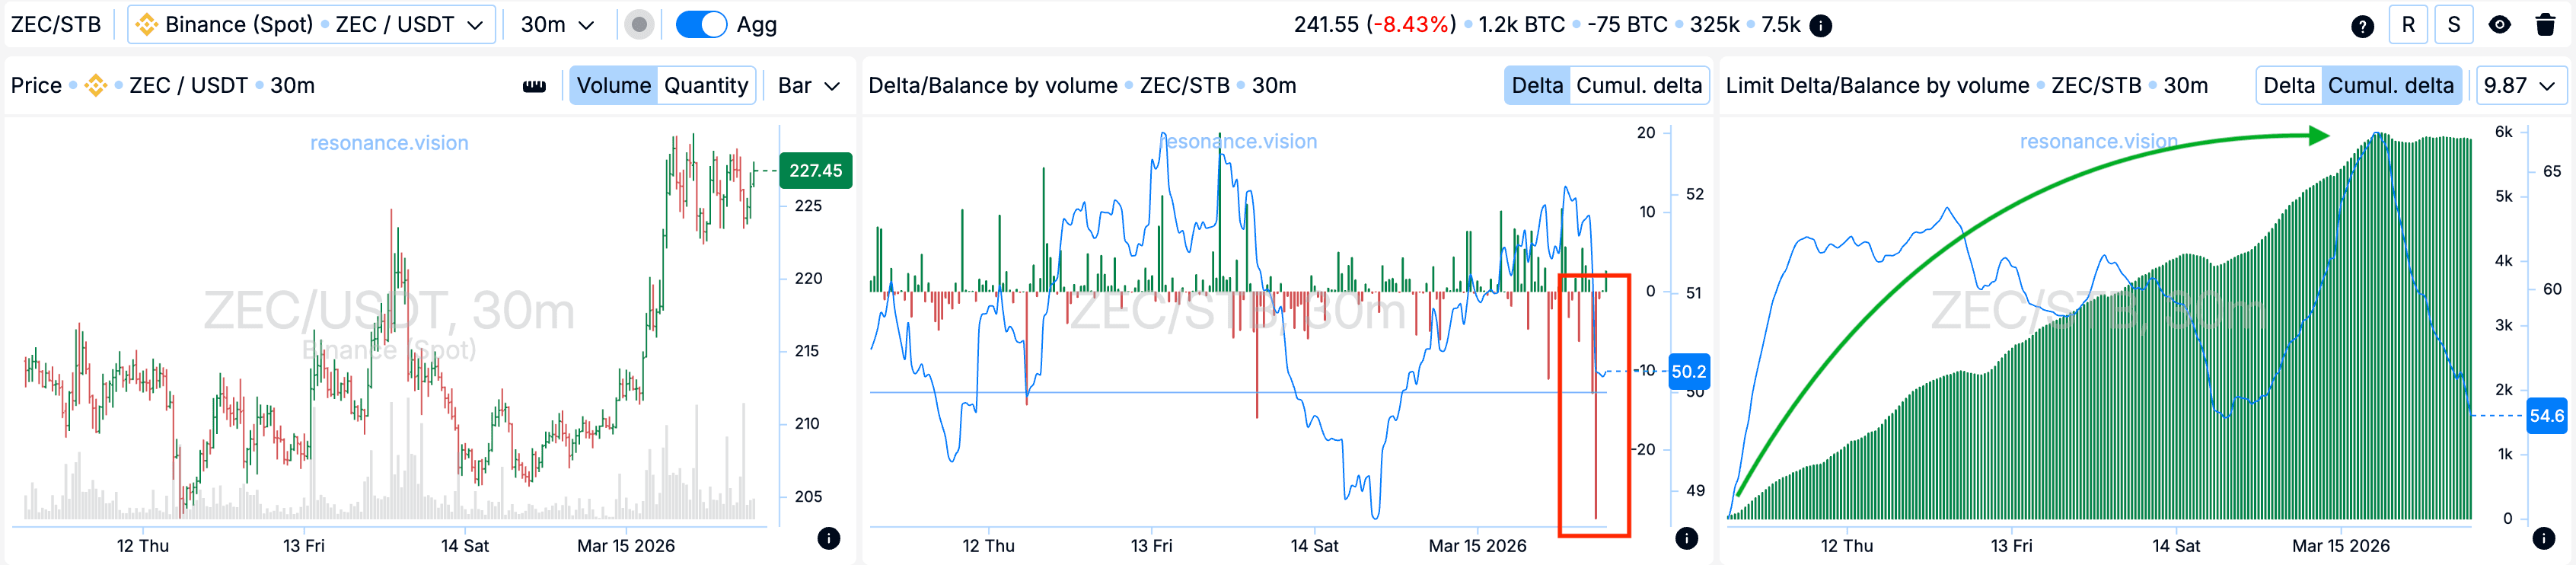
Delta / Volume balance and limit delta: aggregated data across all pairs and exchanges confirms the observations from the cluster chart. During the analyzed period, market sell volumes increased significantly, which is clearly reflected on the delta histogram (red rectangle).
At the same time, a cumulative increase in limit buy orders was recorded (green rectangle).
Such a combination indicates active absorption of incoming market sell volume by limit participants. As a result, local support forms within the current range, confirming the weakening of selling pressure and a gradual shift in balance toward buyers.
Exit reasons
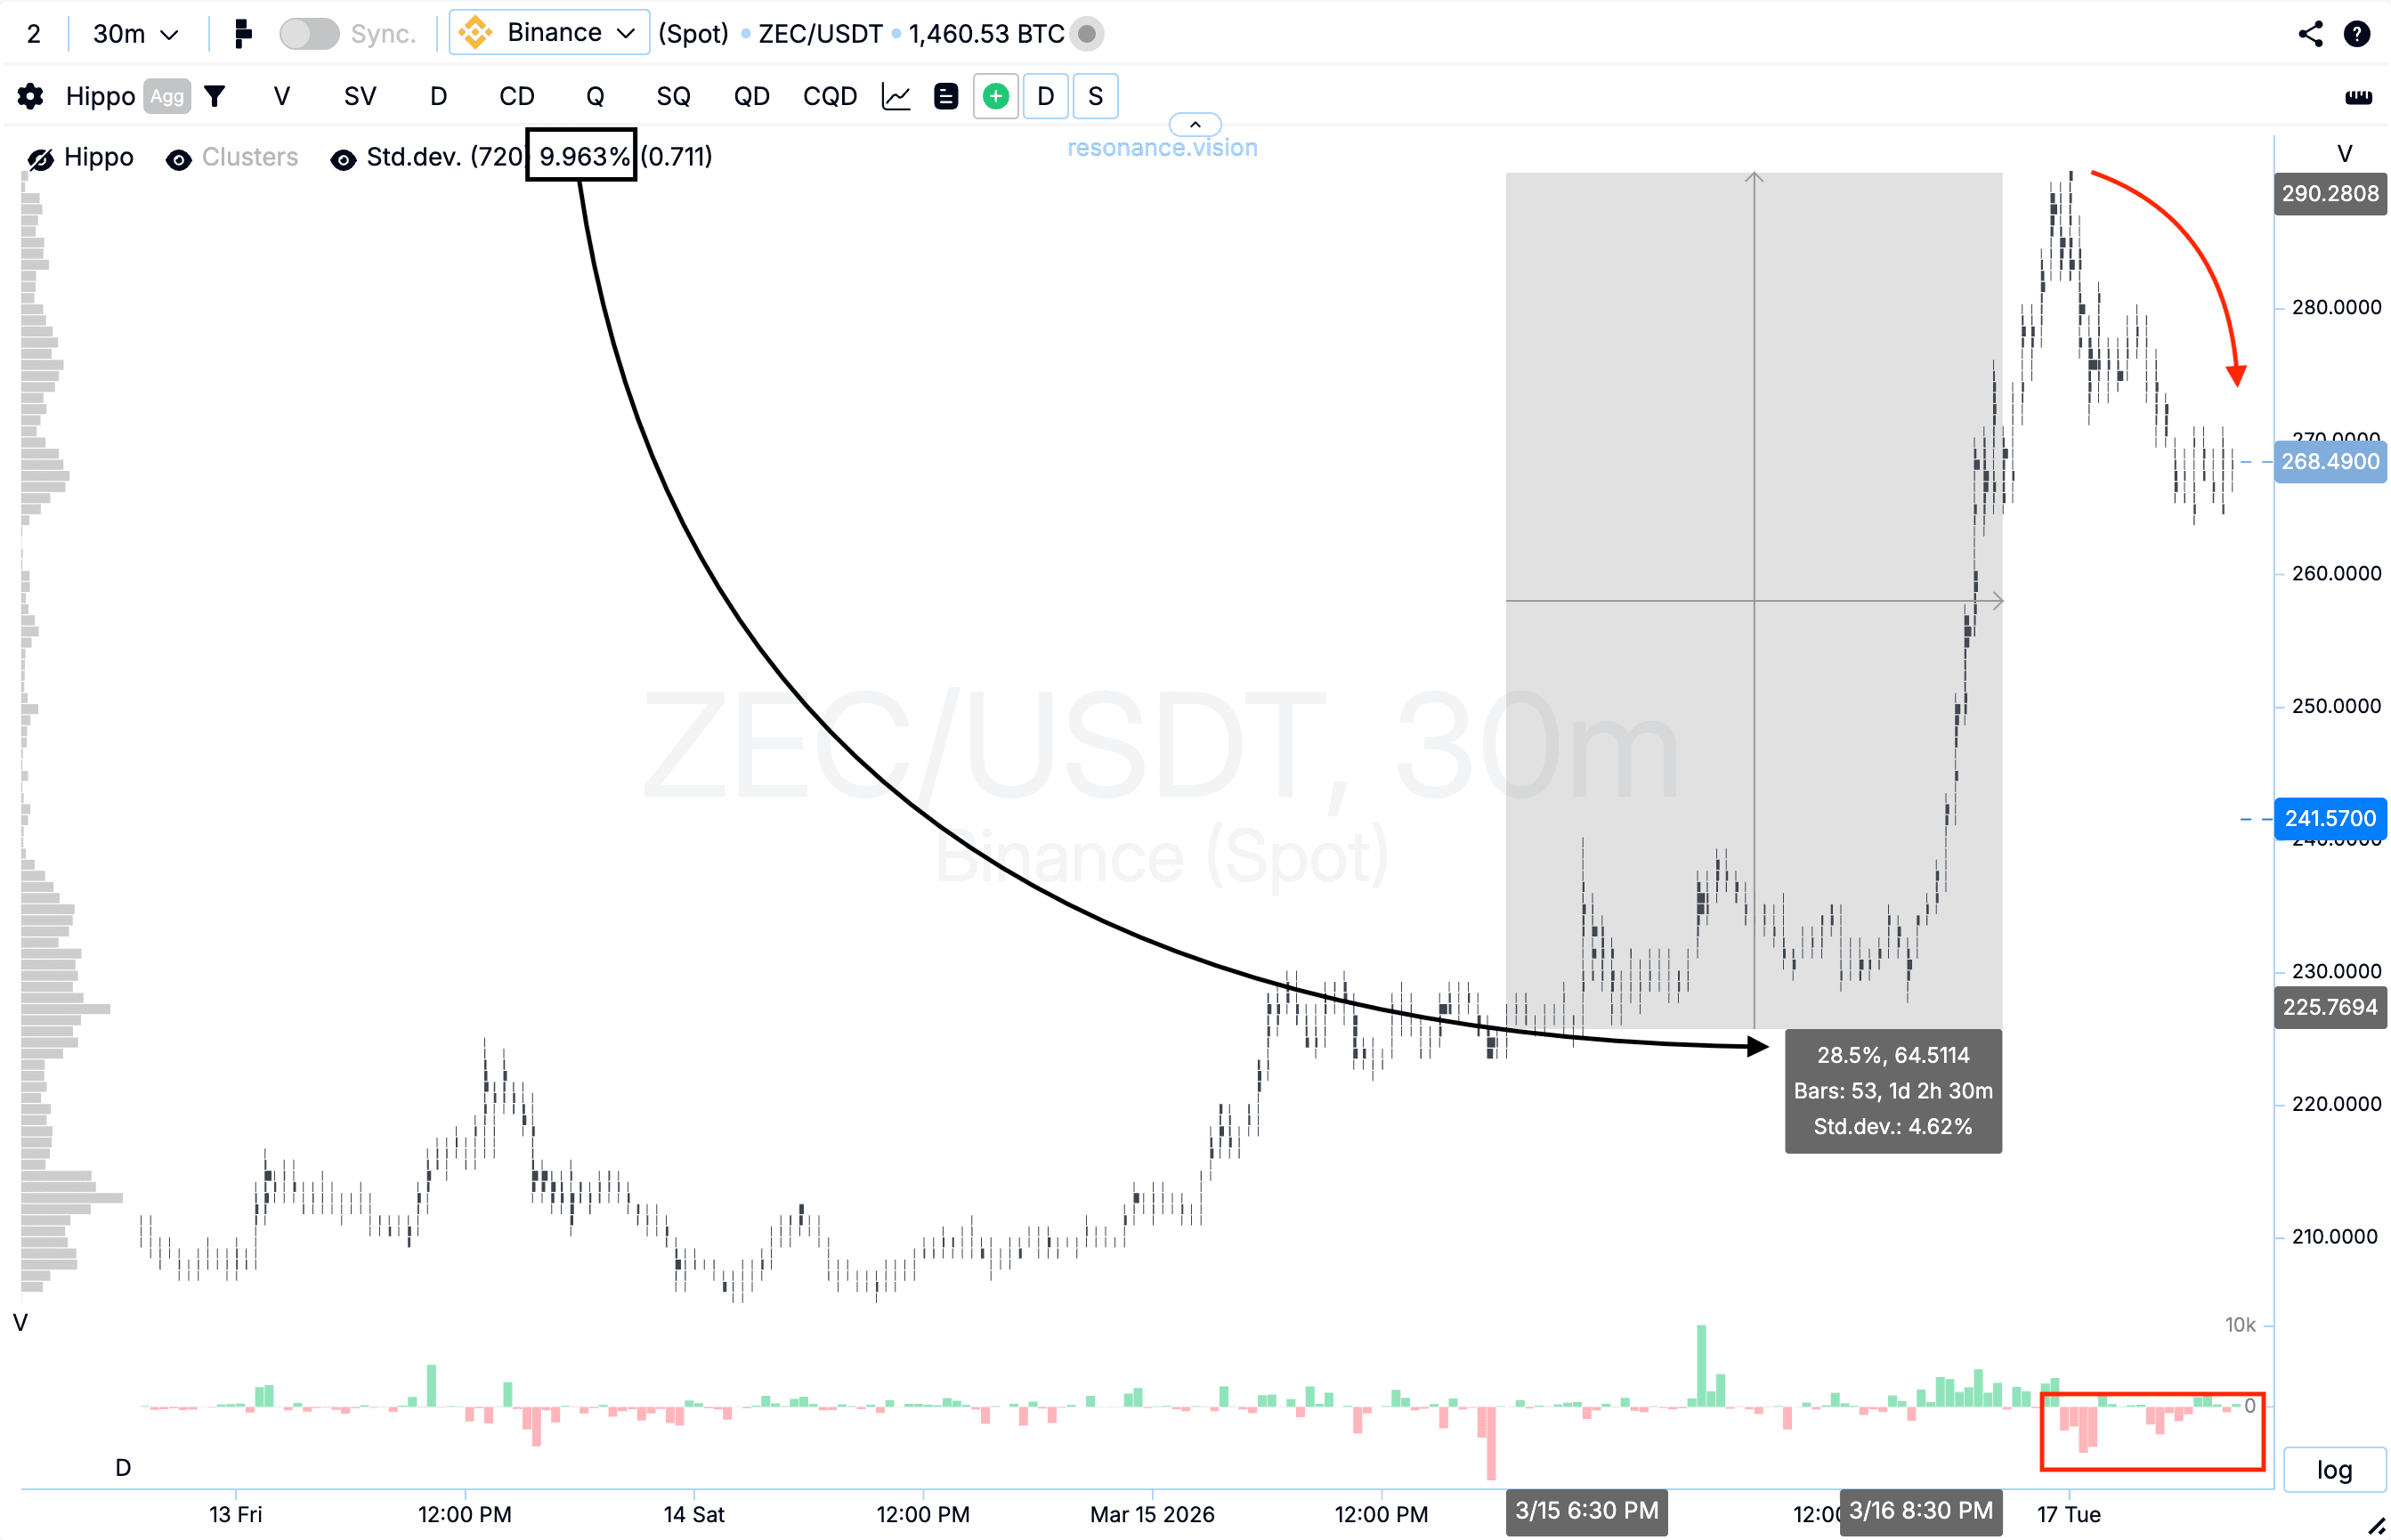
Cluster chart: after the entry point, the price increased by almost 30%, which corresponds to nearly three standard movements and represents a statistically anomalous price move (black rectangle and arrow).
As the move developed, the structure began to change: market buying was gradually replaced by dominant market selling, which was accompanied by a price decline (red rectangle and arrow). This indicates the restoration of seller efficiency in the current zone.
With the emergence of signs of decreasing growth efficiency, further holding the position would have been accompanied by increased risk. Therefore, profit-taking in this area appeared to be the most rational and well-balanced decision from a position management perspective.
Conclusion
This analysis clearly shows that the key factor in market evaluation is not the volume itself, but its efficiency and impact on price.
Despite the significant dominance of market selling during the entry formation phase, the price stopped reacting with further declines. This indicated weakening sellers and active absorption of their volume by limit buyers, which led to the formation of a local deficit and created the conditions for further growth.
However, as the move progressed, signs of a structural shift began to appear: buyers were losing efficiency, while sellers, on the contrary, started to influence the price.
Thus, the entry was based on signs of seller inefficiency and deficit formation, while the exit was based on the restoration of selling efficiency and increasing risks of further holding the position. Such an approach allows traders to evaluate the market through the interaction of volume and price, significantly improving the accuracy and justification of trading decisions over time.
Follow new insights in our telegram channel.
No need to invent complex schemes and look for the "grail". Use the Resonance platform tools.
Register via the link — get a bonus and start earning:
OKX | BingX | KuCoin.
Promo code TOPBLOG gives you a 10% discount on any Resonance tariff plan.
Recommended articles


