ZEC +34.7% (Resonance Directional Strategy)

A deal analysis using cluster analysis and volume: how market inefficiency provided an entry point, and a decline in buyer efficiency became a signal to take profits.
Table of contents

Coin: ZEC/USDT
Risk: medium
Level of understanding: beginner
Entry reasons
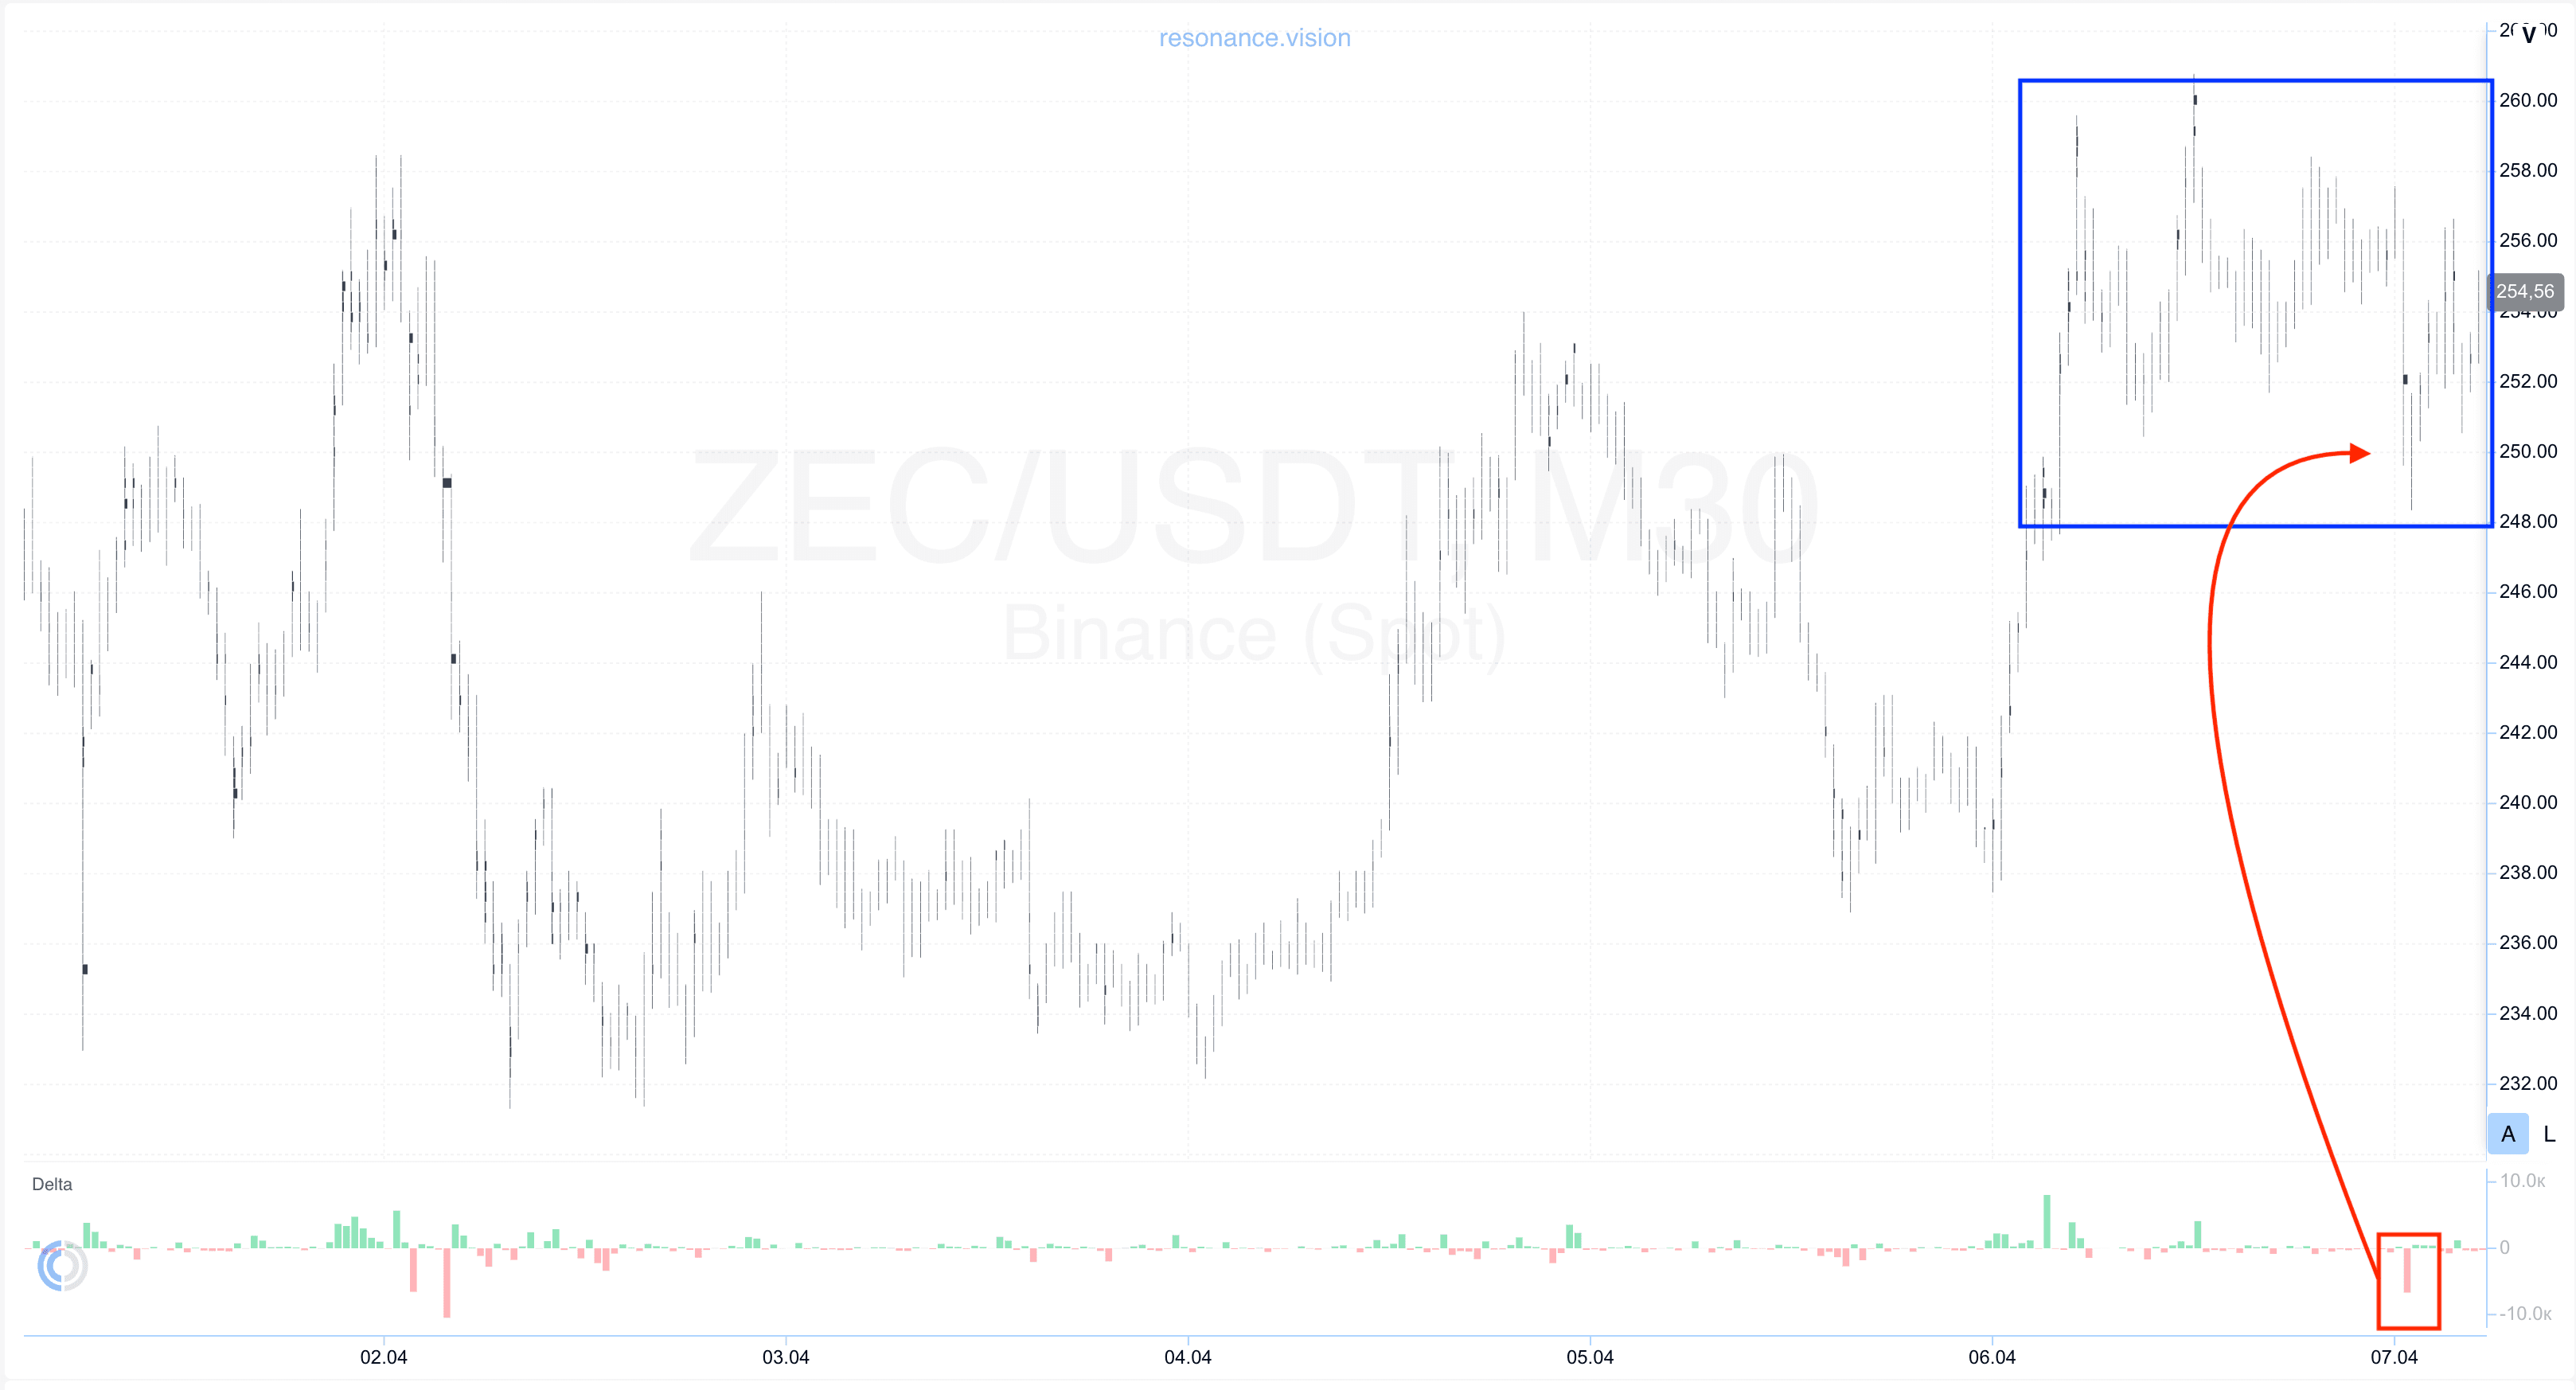
Cluster chart: during the local upward movement, relatively large volume clusters began to form (blue rectangle). Within these clusters, market sell orders were dominant; however, the price did not demonstrate a significant decline (red rectangle and arrow).
Such a reaction indicates the formation of signs of a local deficit and a weakening of sellers’ initiative. When selling volumes stop leading to further price decline, this often becomes a signal of a possible shift in initiative or the formation of a local reversal.
In the Dashboard
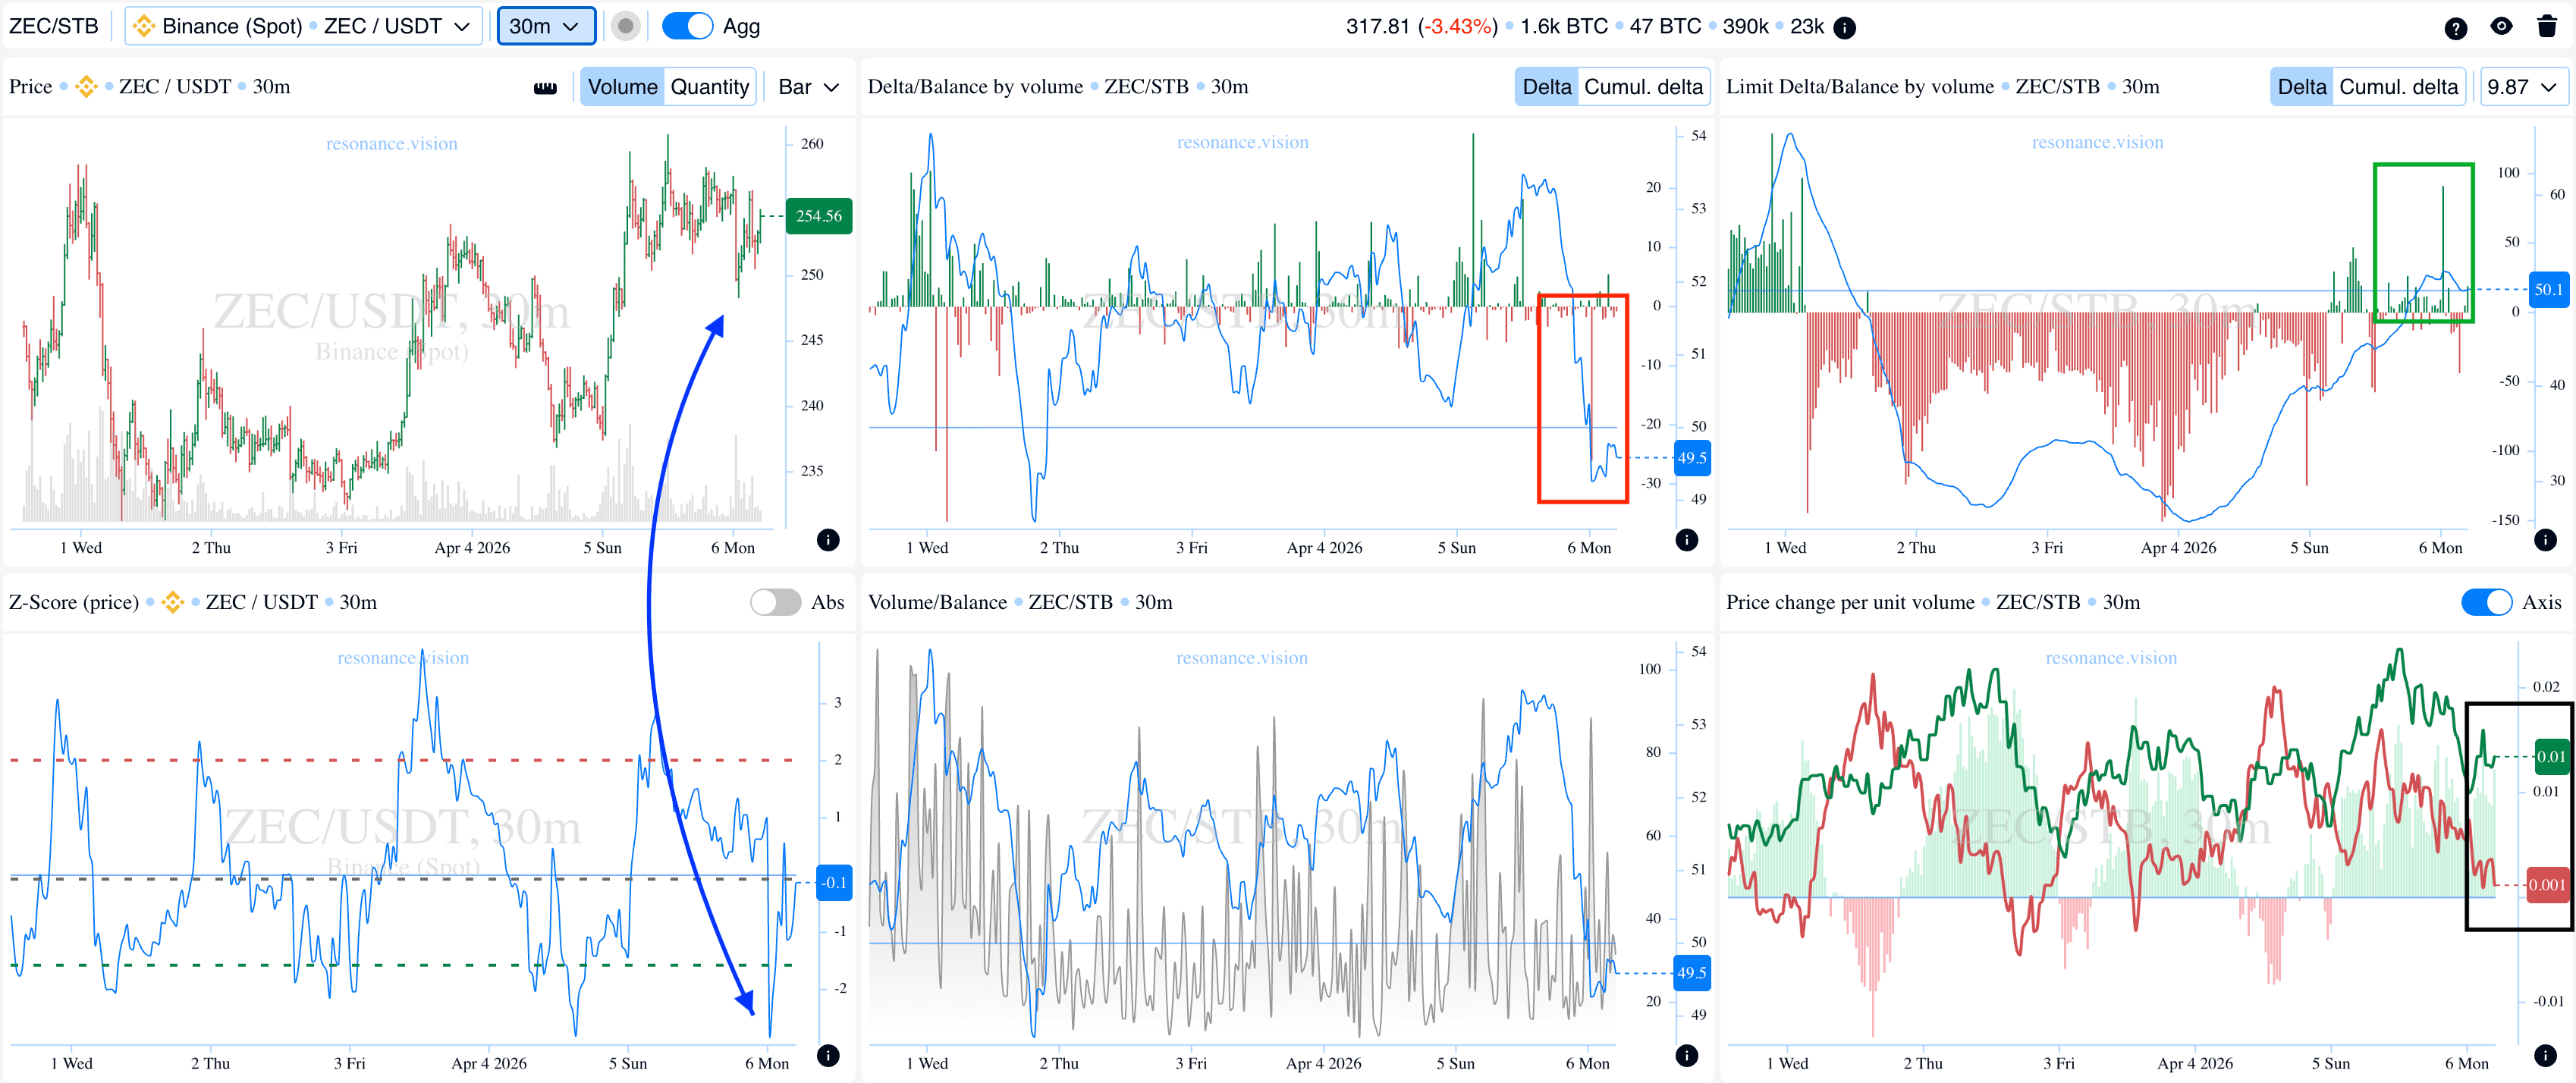
Delta / Volume balance and limit delta: in aggregated form, data across all pairs and exchanges during the period under review also confirms pressure from market sells: the balance continued to shift downward, and selling volumes increased (red rectangle).
At the same time, the limit delta showed an increasing dominance of limit buy orders (green rectangle).
Such a combination indicates active absorption of incoming market sell volume by limit buyers. As a result, local support is formed in the current range, which further confirms signs of a supply deficit and a shift in balance toward buyers.
Z-Score (price): additionally, during the most recent pullback, a downward price deviation of more than two standard deviations was recorded (blue arrow).
Such statistically anomalous values are often accompanied by a halt in movement or the formation of a local reversal, which strengthens the argument in favor of opening a long position.
Price change per unit of volume: it can also be observed that the efficiency of market orders began to shift in favor of buyers (black rectangle).
Less volume is required for upward price movement than for downward movement. This indicates higher efficiency on the buyer side and serves as an additional argument.
As a result, a combination of factors was formed, indicating a shift in initiative toward buyers, which served as the basis for entering the position.
Exit reasons
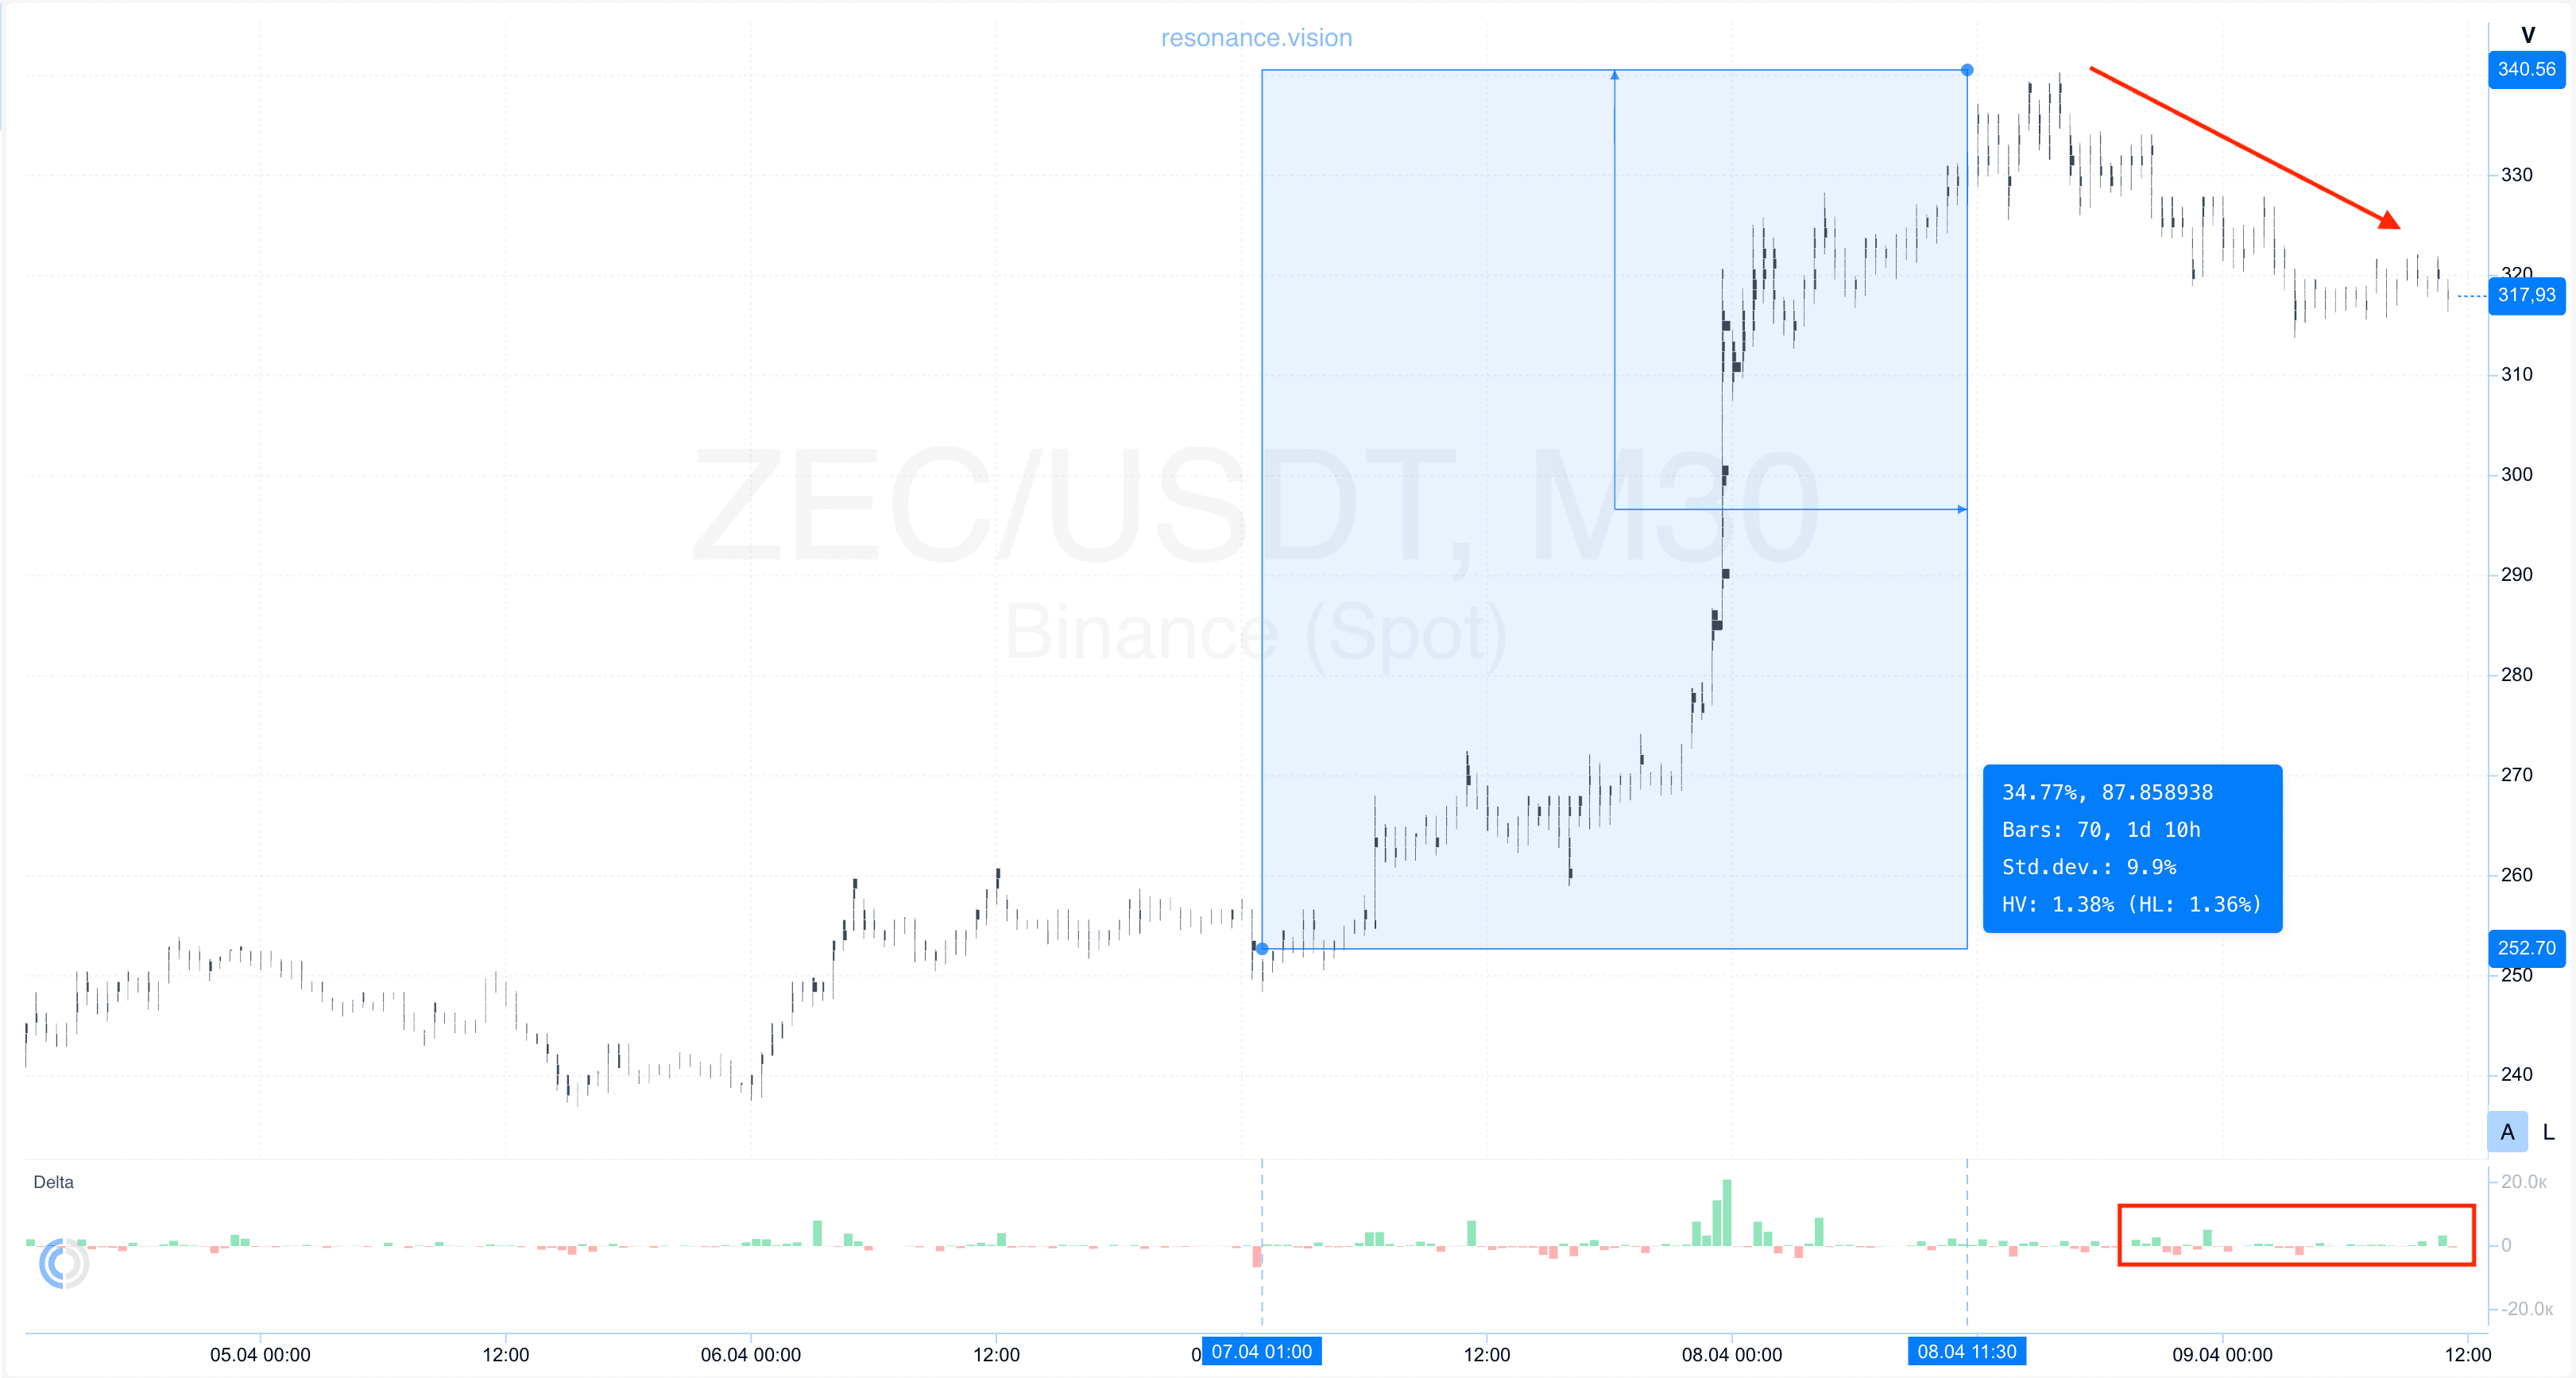
Cluster chart: from the point where inefficient market sell pressure was identified, the price moved approximately 35%, forming a strong movement.
However, as the growth developed, the structure began to change: during subsequent dominant market buying, the price stopped demonstrating further growth and gradually started to decline (red rectangle and arrow).
Such a reaction indicates the formation of signs of a surplus and a decrease in buyer efficiency.
This dynamic suggests an increased probability of correction and higher risks of holding the position further, making profit-taking a logical and justified decision.
Conclusion
This analysis clearly shows that the key factor in market analysis is not just the presence of volume, but its efficiency and impact on price.
At the entry stage, despite the dominance of market sells, the price did not demonstrate a corresponding decline. This indicated a weakening of sellers and active absorption of their volume by limit buyers. Additional confirmations in the form of limit delta, Z-Score, and price change per unit of volume strengthened the argument and allowed for a comprehensive understanding of the current market state.
After entry, the market realized a strong upward movement; however, as the impulse developed, signs of structural change began to appear: market buys stopped exerting their previous influence on price, indicating a decrease in their efficiency and the formation of signs of surplus.
Thus, the entry was based on seller inefficiency and the formation of a deficit, while the exit was based on decreasing buyer efficiency and increasing risks of holding the position further.
Such an approach allows decisions to be made based on the interaction between volume and price, significantly improving the accuracy and consistency of trading over time.
Follow new insights in our telegram channel.
No need to invent complex schemes and look for the "grail". Use the Resonance platform tools.
Register via the link — get a bonus and start earning:
OKX | BingX | KuCoin.
Promo code TOPBLOG gives you a 10% discount on any Resonance tariff plan.
Recommended articles


