FIL +95.06% (Resonance Directional Strategy)

In this analysis, I showed how market sales failed to update the minimum, and limit orders for purchase actively absorbed volumes. Such an imbalance allowed to enter the transaction in time and fix the result +95.06%. Such situations perfectly demonstrate the importance of working with clusters, delta for assessing the effectiveness of volumes on the impact of price.
Table of contents

Coin: FIL/USDT
Risk: Medium
Skill Level: Beginner
Entry Reasons
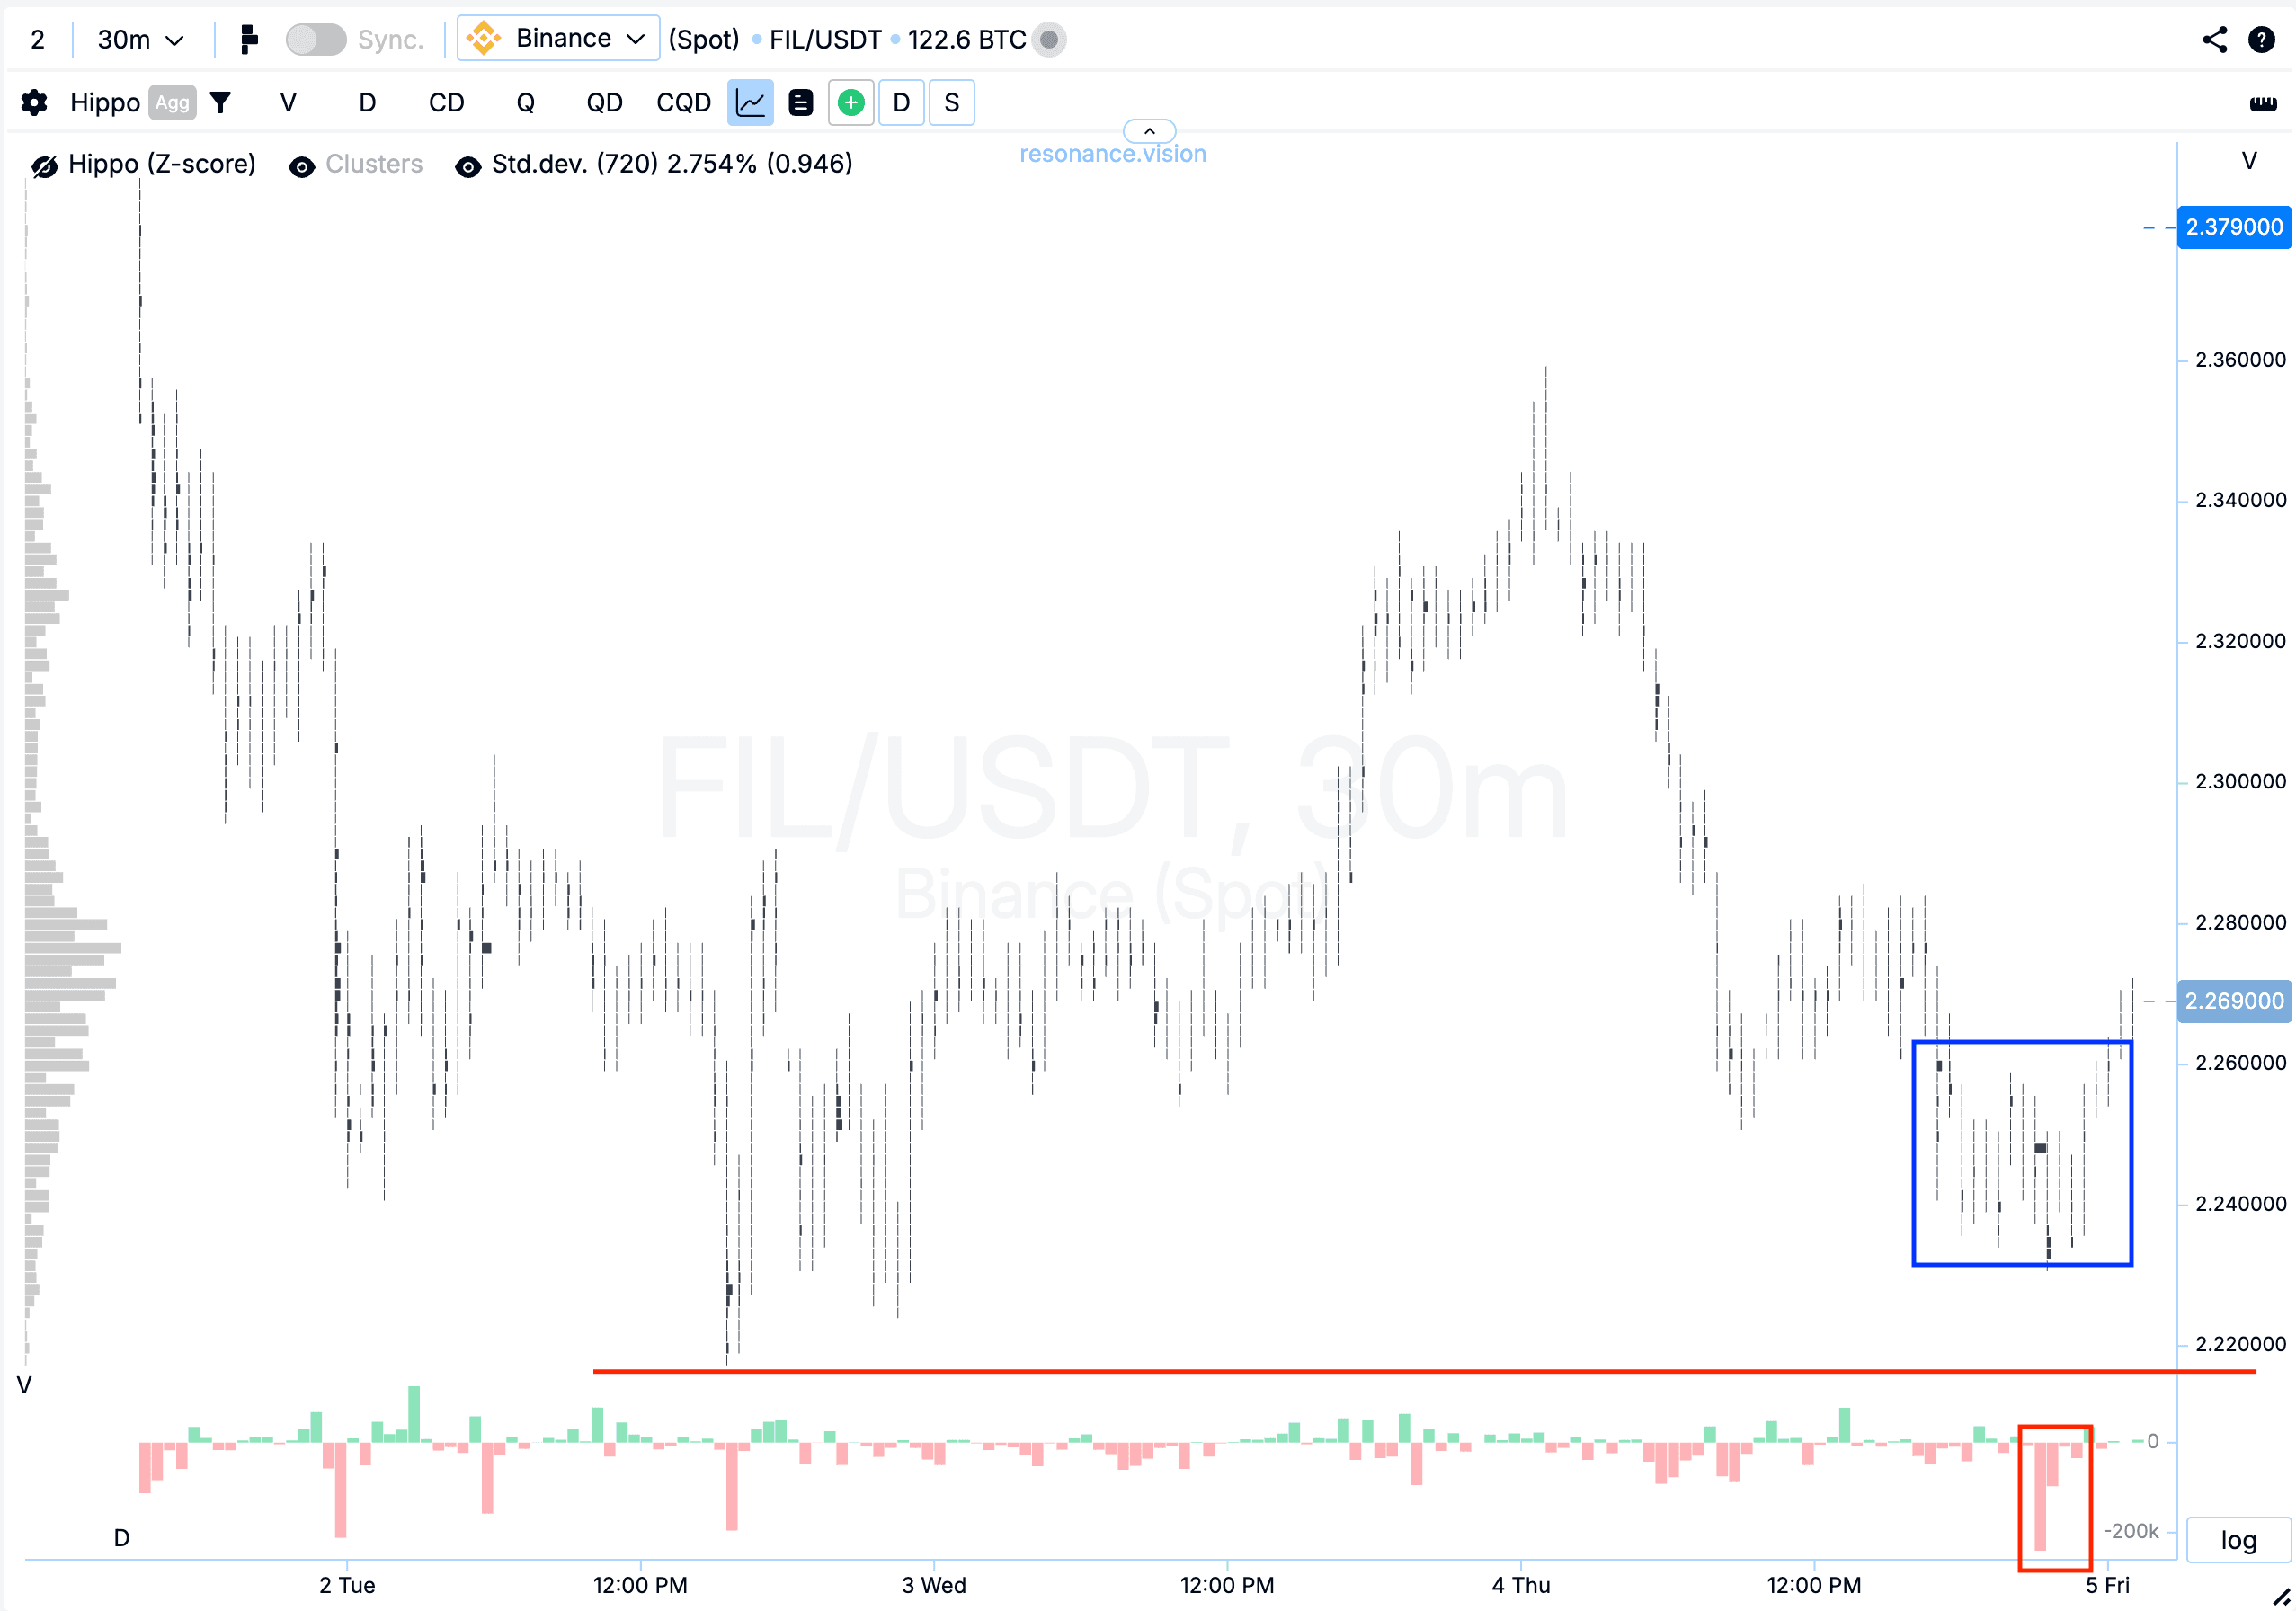
Cluster Chart: During the decline, relatively large volume clusters formed (blue rectangle). Selling dominated in these zones, but the price did not update the local low (red rectangle and line). Such behavior may indicate the formation of a local deficit and a weakening of seller pressure.
On the Dashboard
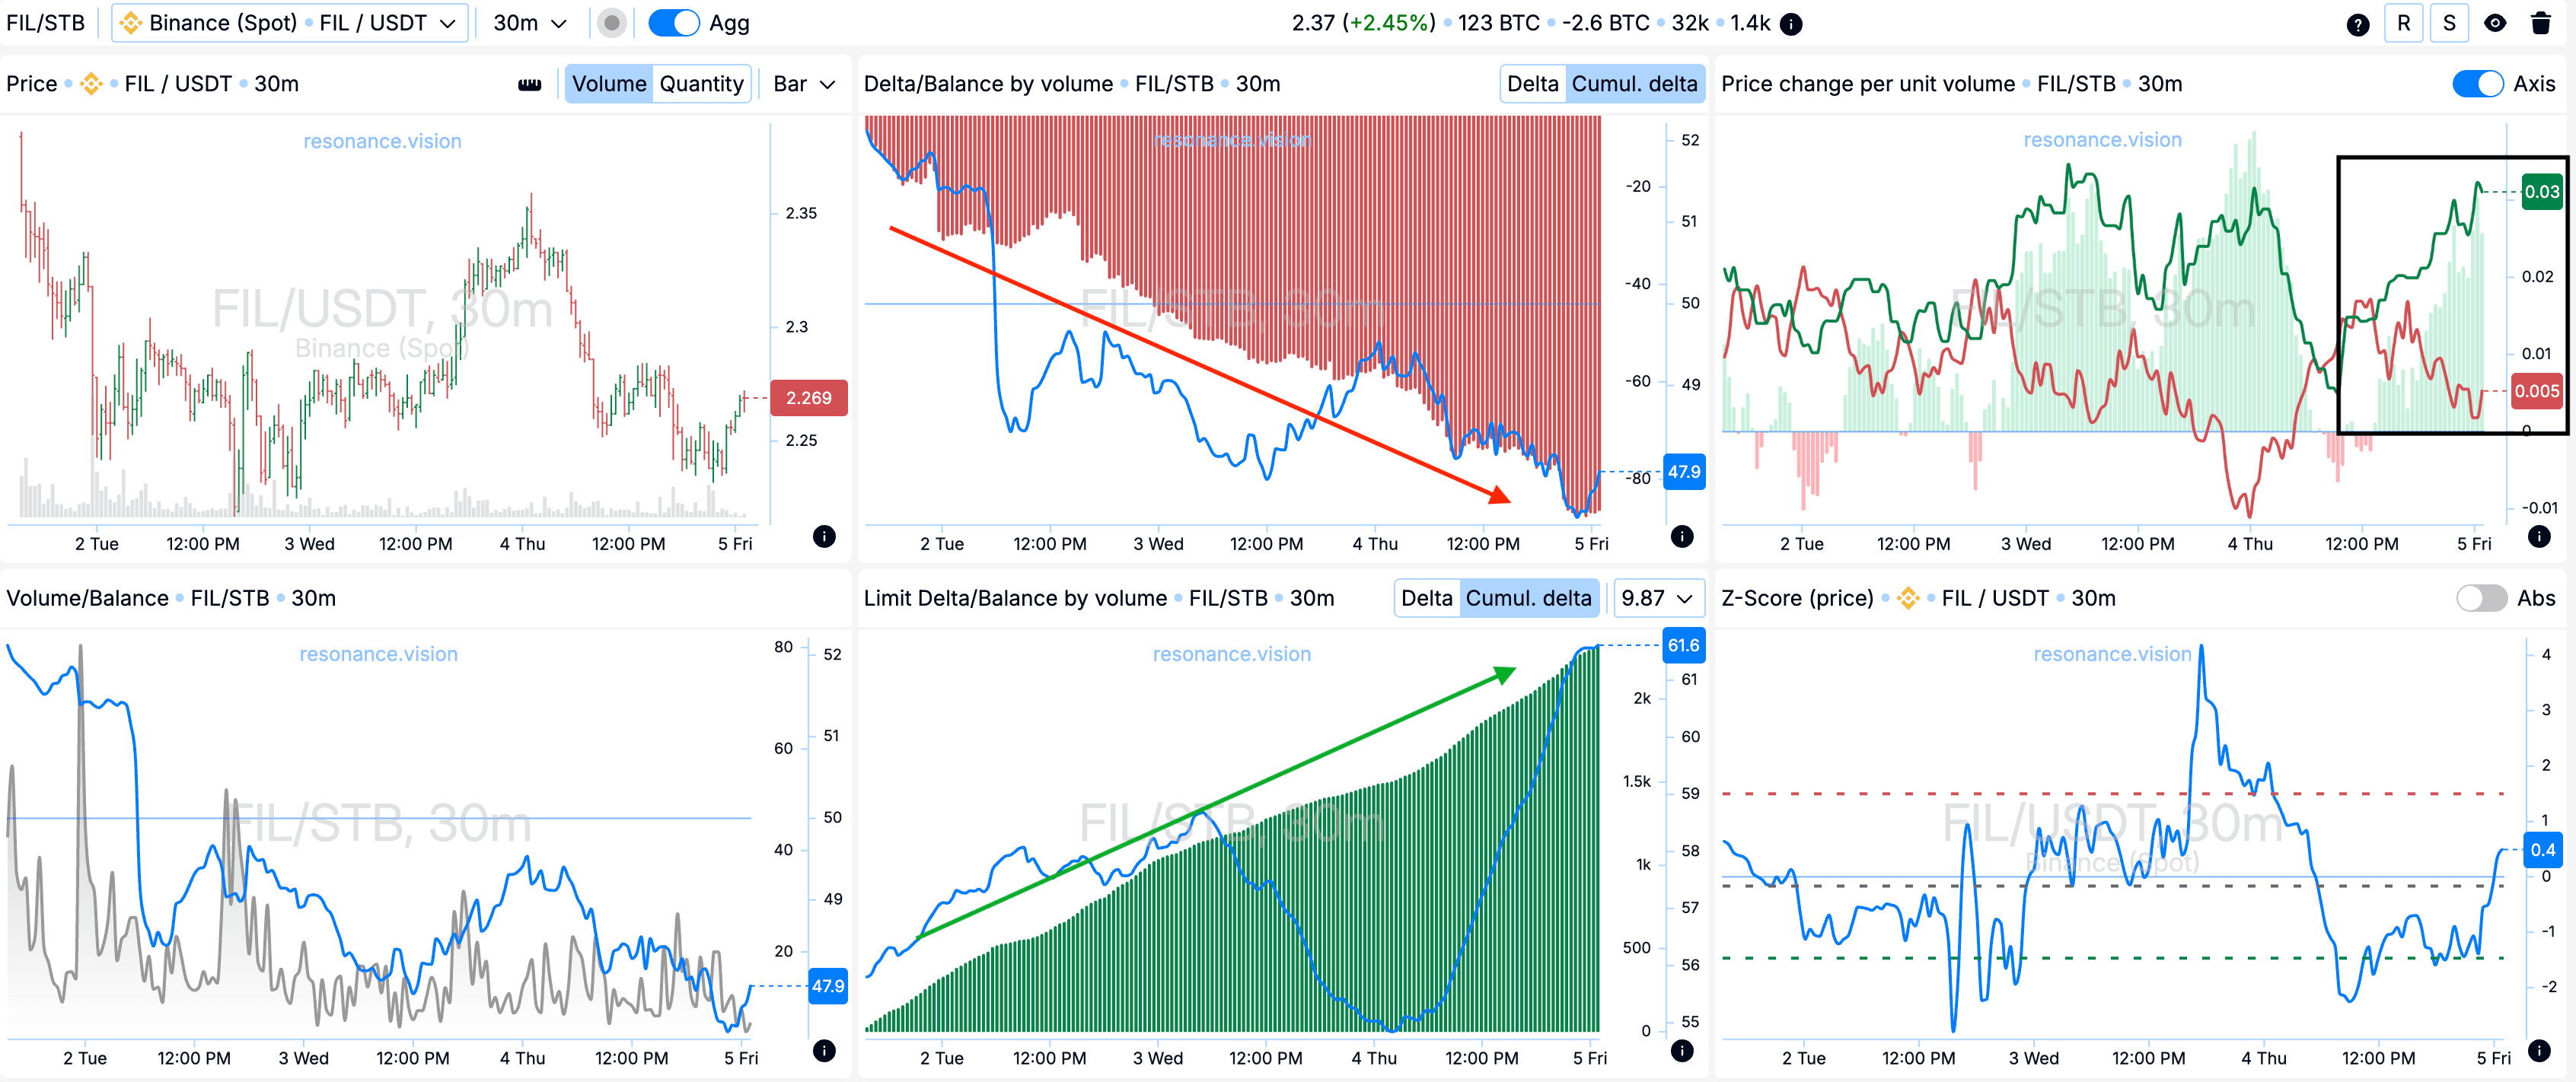
Delta/Volume Balance and Limit Delta: Aggregated data shows an increase in market selling, clearly visible on the cumulative delta histogram (red rectangle). However, despite the strong pressure, the price did not show the expected drop, as mentioned earlier.
At the same time, cumulative delta growth is recorded in limit orders (green rectangle), which indicates the dominance of buy limit orders and the willingness of participants to actively absorb selling volumes.
Price Change per Unit of Volume: The impact efficiency of market orders shifted towards buyers — their influence is strengthening, as confirmed by the divergence in their favor (black rectangle).
Exit Reasons
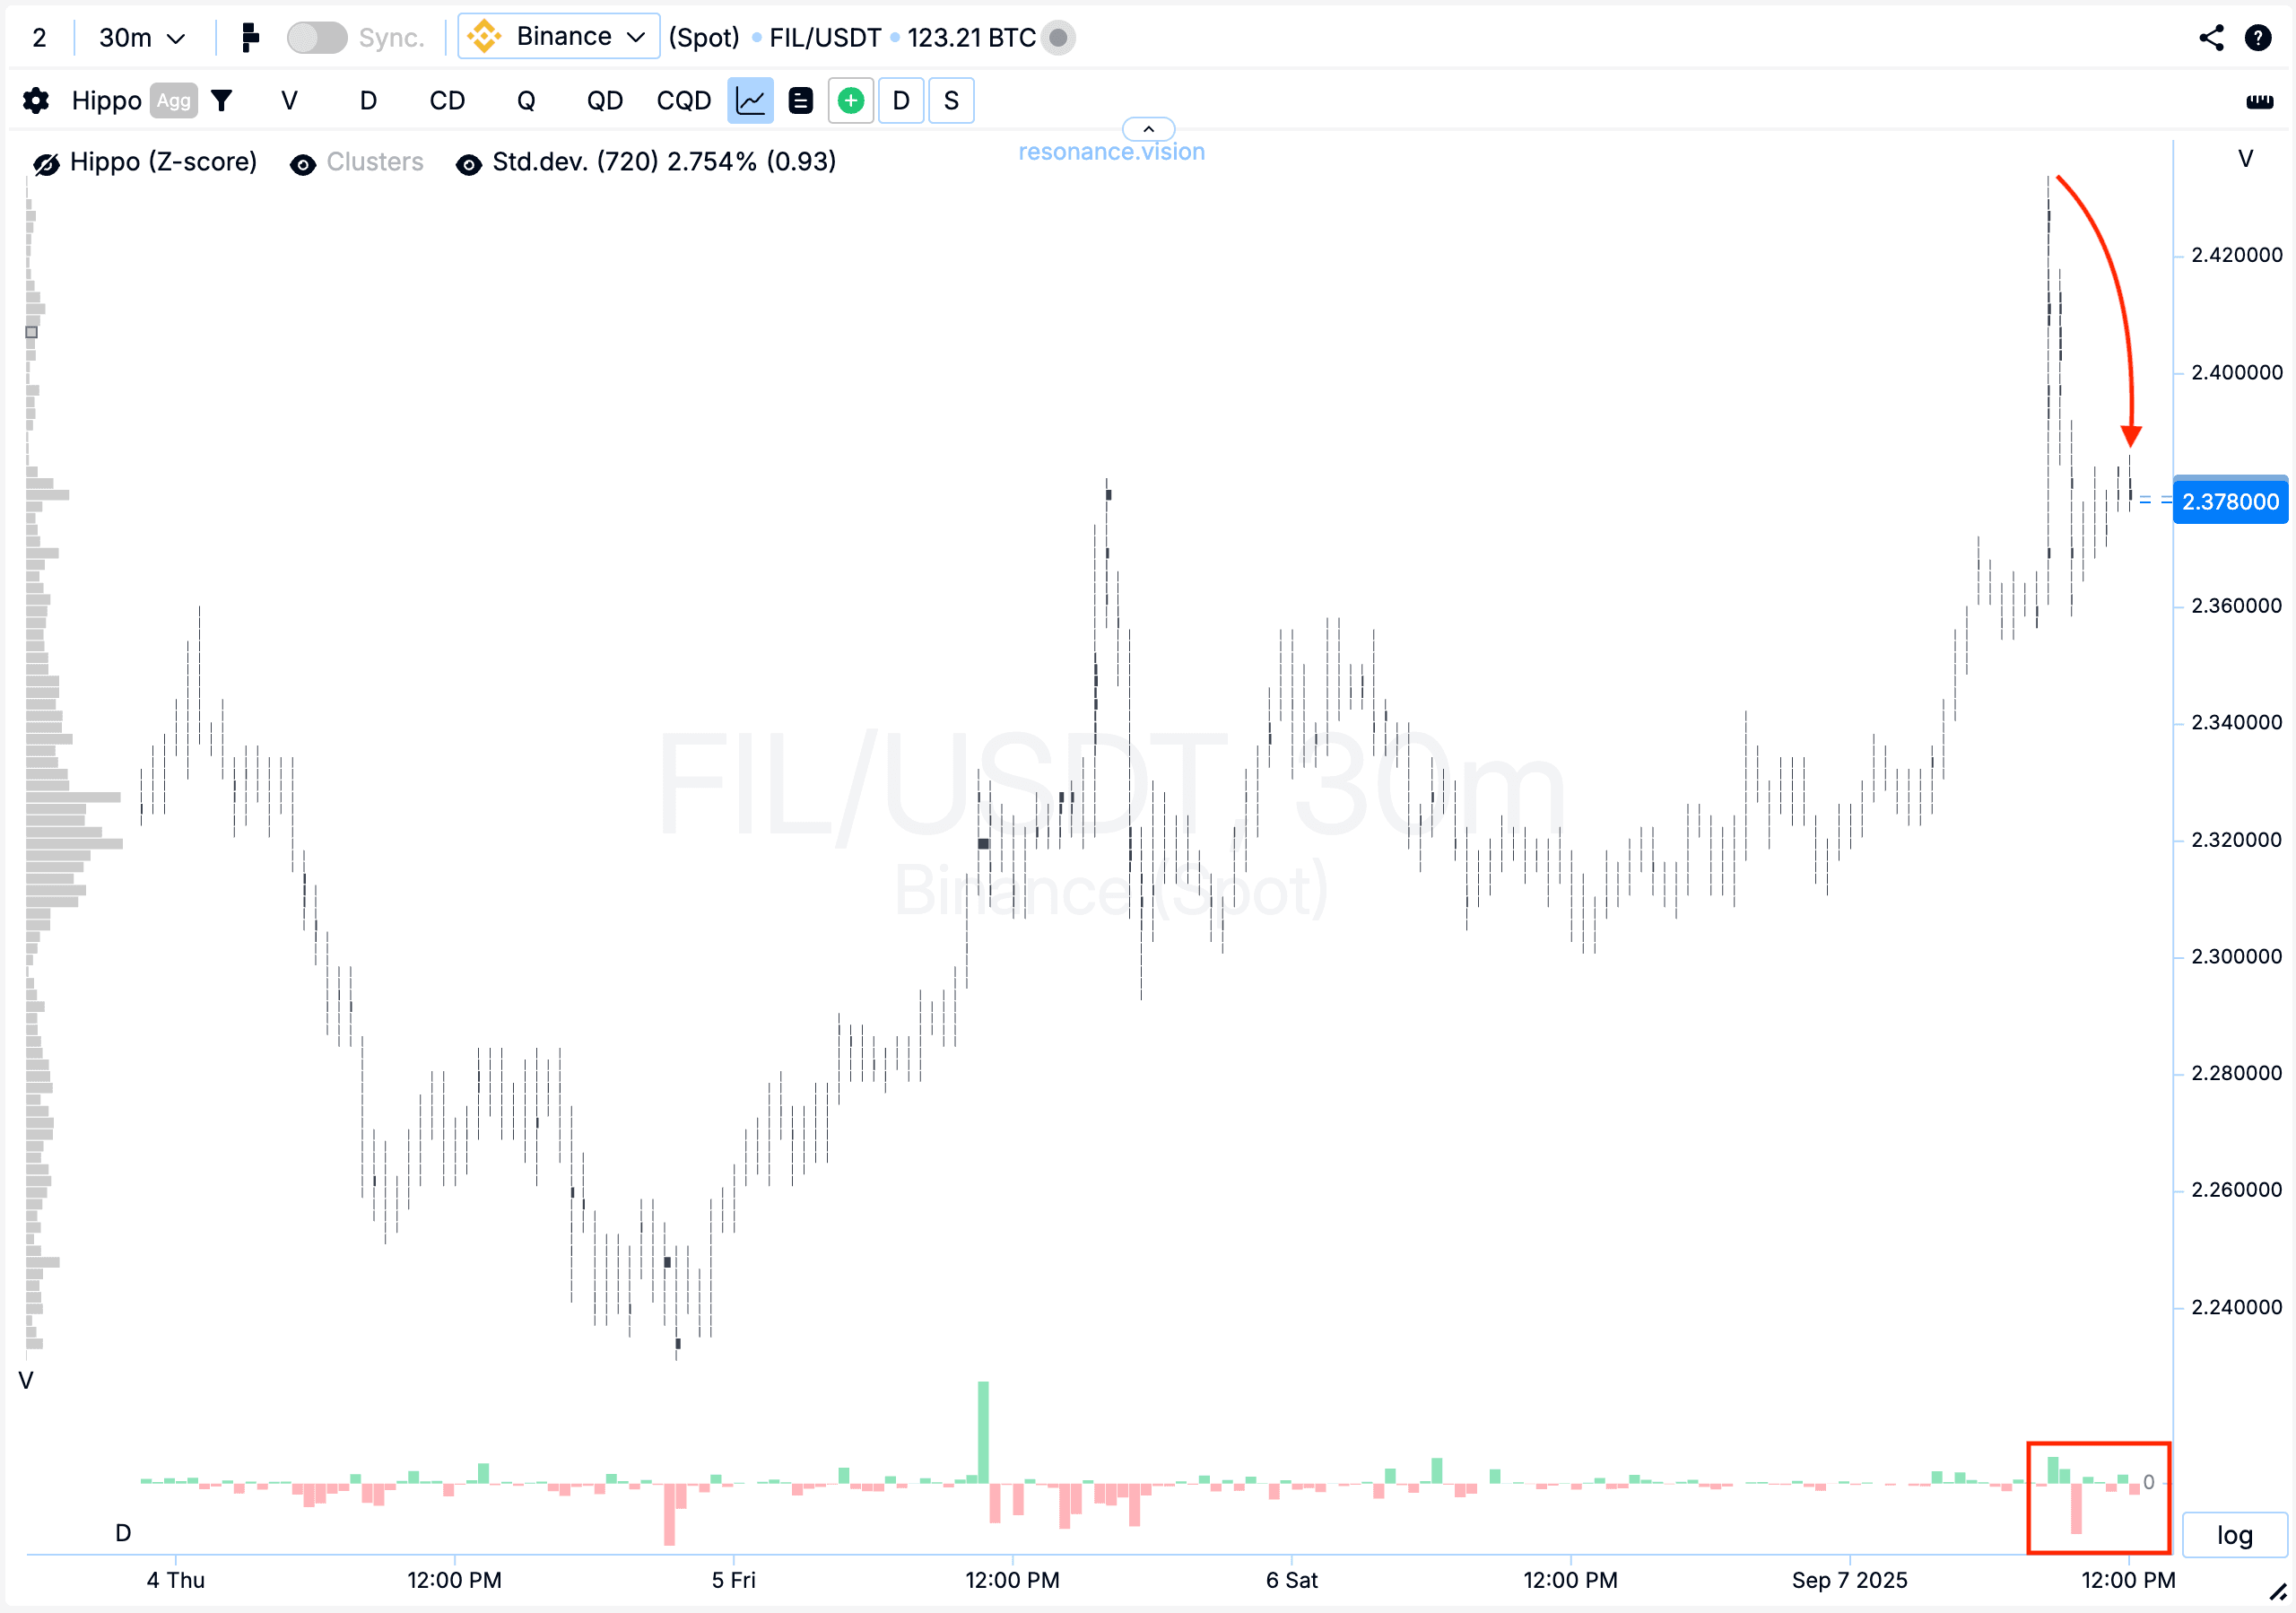
Cluster Chart: After a repeated impulse movement with a pullback, it became clear that buying gradually started to turn into selling (red rectangle and arrow). In such a situation, holding the position becomes more risky, so the decision was made to lock in the result.
Result
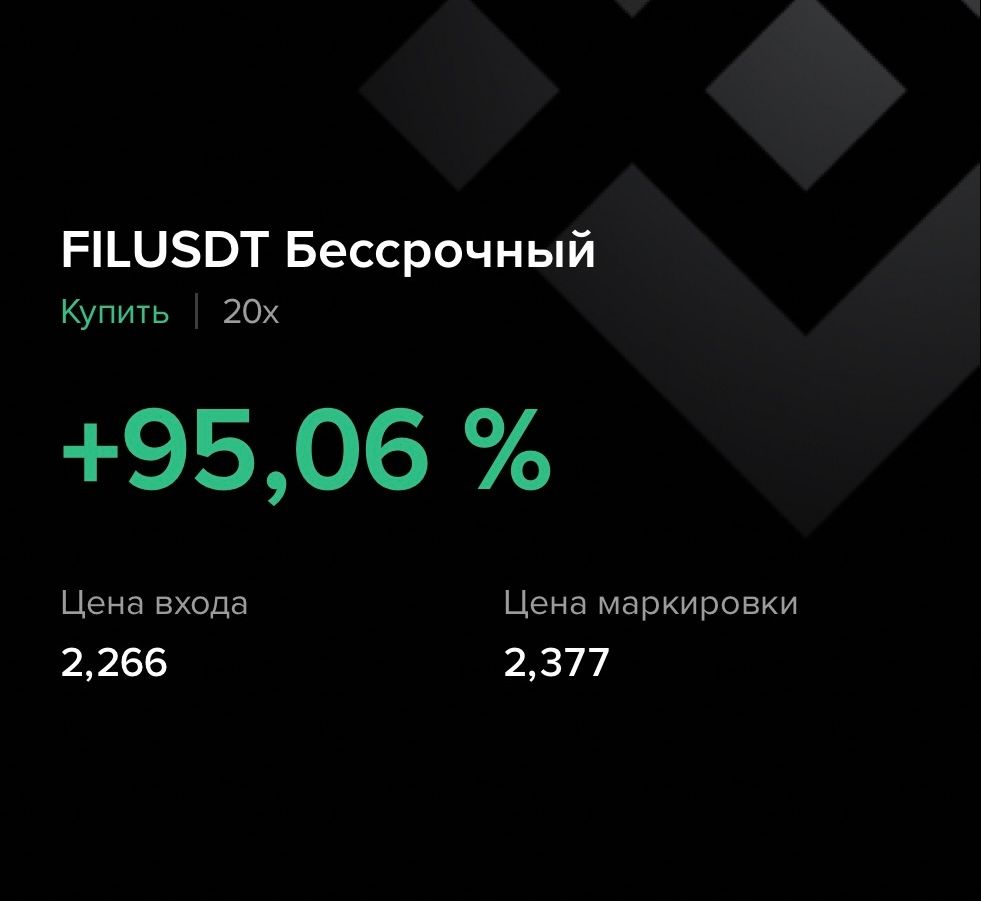
A profit of +95.06% was secured.
Conclusion
This trade clearly demonstrates the importance of recognizing imbalances between market selling and limit buying. Despite increased selling pressure, the price did not update the lows, signaling a deficit and allowing the trader to build a working hypothesis for entry.
The final decision to take profit turned out to be justified: after the second impulse, participants began to show signs of weakness and a shift from buying to selling. This approach highlights the value of comprehensive analysis — when clusters, delta, and volume efficiency together provide a clear picture and help close the trade at the right time.
Follow new insights in our telegram channel.
No need to invent complex schemes and look for the “grail”. Use the Resonance platform tools.
Register via the link — get a bonus and start earning:
OKX | BingX.
Promo code TOPBLOG gives you a 10% discount on any Resonance tariff plan.
Recommended articles