MANA: A Decentralized World in Search of a New Wave of Growth

An analysis of the MANA token’s potential amid news of its exit from a bearish trend. A breakdown of Decentraland’s indicators, including tokenomics and user activity. A detailed analysis of the chart, volumes, and signs of accumulation that point to a possible new “bullish” phase.
Table of contents
The MANA token of the Decentraland project has recently come back into the spotlight of analysts. Some articles claim that MANA may be emerging from a long-term “bearish” trend, citing on-chain metrics and comparisons to past cycles. While such analysis is often superficial, it serves as a starting point for a deeper investigation.
What is Decentraland?
Decentraland is a decentralized 3D virtual reality platform on the Ethereum blockchain. Users can buy, build on, and monetize virtual plots of land. The ecosystem has two main tokens:
- MANA (ERC20): The internal cryptocurrency for transactions.
- LAND (NFT): Virtual real estate (16x16 meters), which can be sold, grouped into districts, or rented out.
The project, which began in 2015 and raised $24 million in an ICO in 2017, went through a closed beta phase and officially launched to the public in 2020.
Analysis of Fundamental Indicators
To assess MANA’s prospects, it’s important to look at its fundamental indicators.
- Tokenomics: Token unlocks occur gradually each month. The number of new tokens is not “super-substantial,” so it does not create critical pressure on the supply.
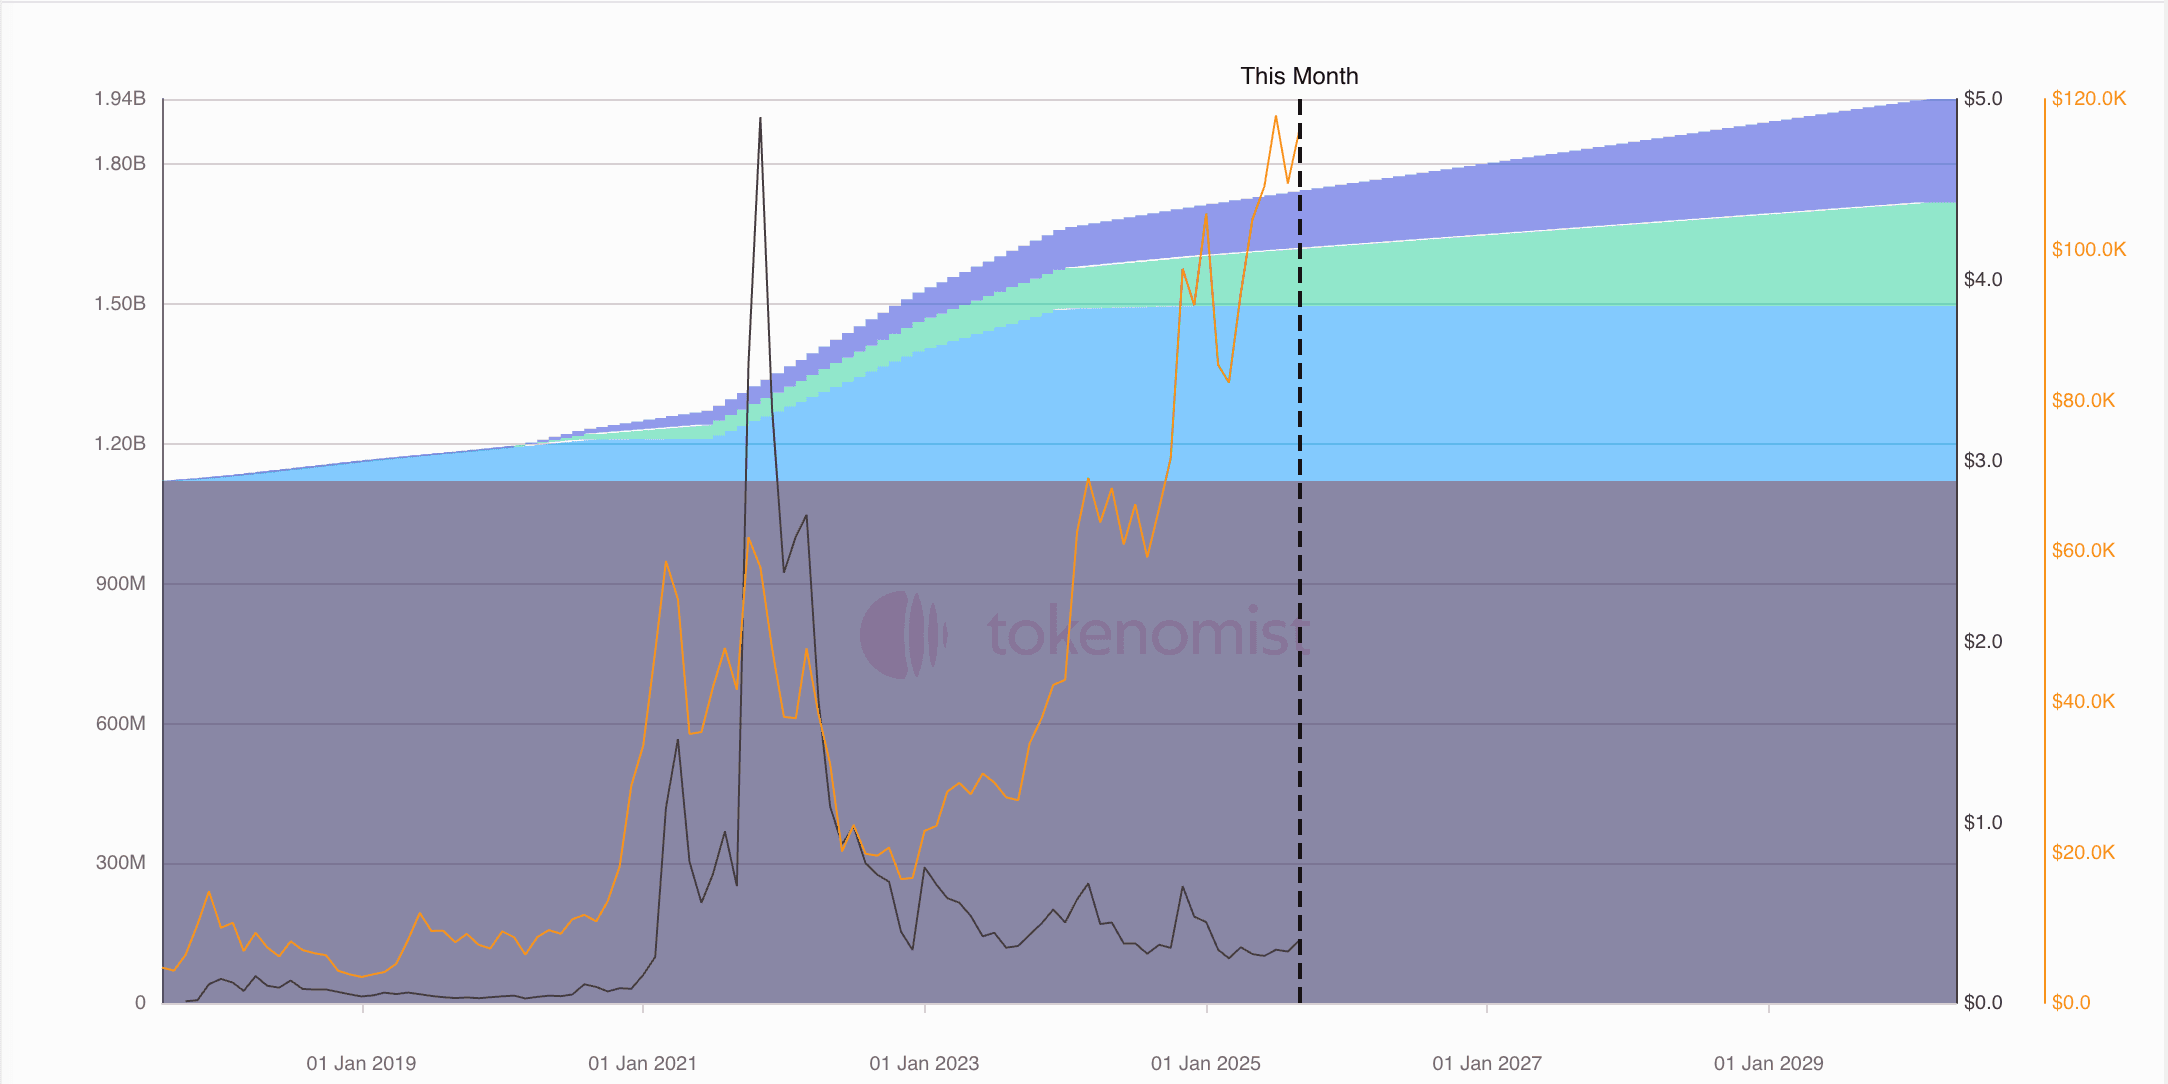
- User Activity: Traffic analysis shows a mixed picture. While some data indicate a general decline, other sources show an increase in traffic. Of particular interest is the significant influx of users from South Korea (a 700% increase), which points to growing interest in the project in the Asian region.
- Staking: Staking rates are currently minimal (0.22%), indicating a low motivation to hold the token for passive income.
Analysis of Chart and Volumes
An analysis of the MANA chart reveals key details that superficial analysis often misses. After its 2021 peak, the token experienced a prolonged decline, but recently, there have been signs of a trend reversal.
- Decreased Volatility: Volatility has significantly decreased, which is typical for accumulation phases.
- Resilient Lows: Despite large sales volumes, the price is not making new lows. This is a critically important signal that points to ineffective sales and the absorption of supply by active buyers.
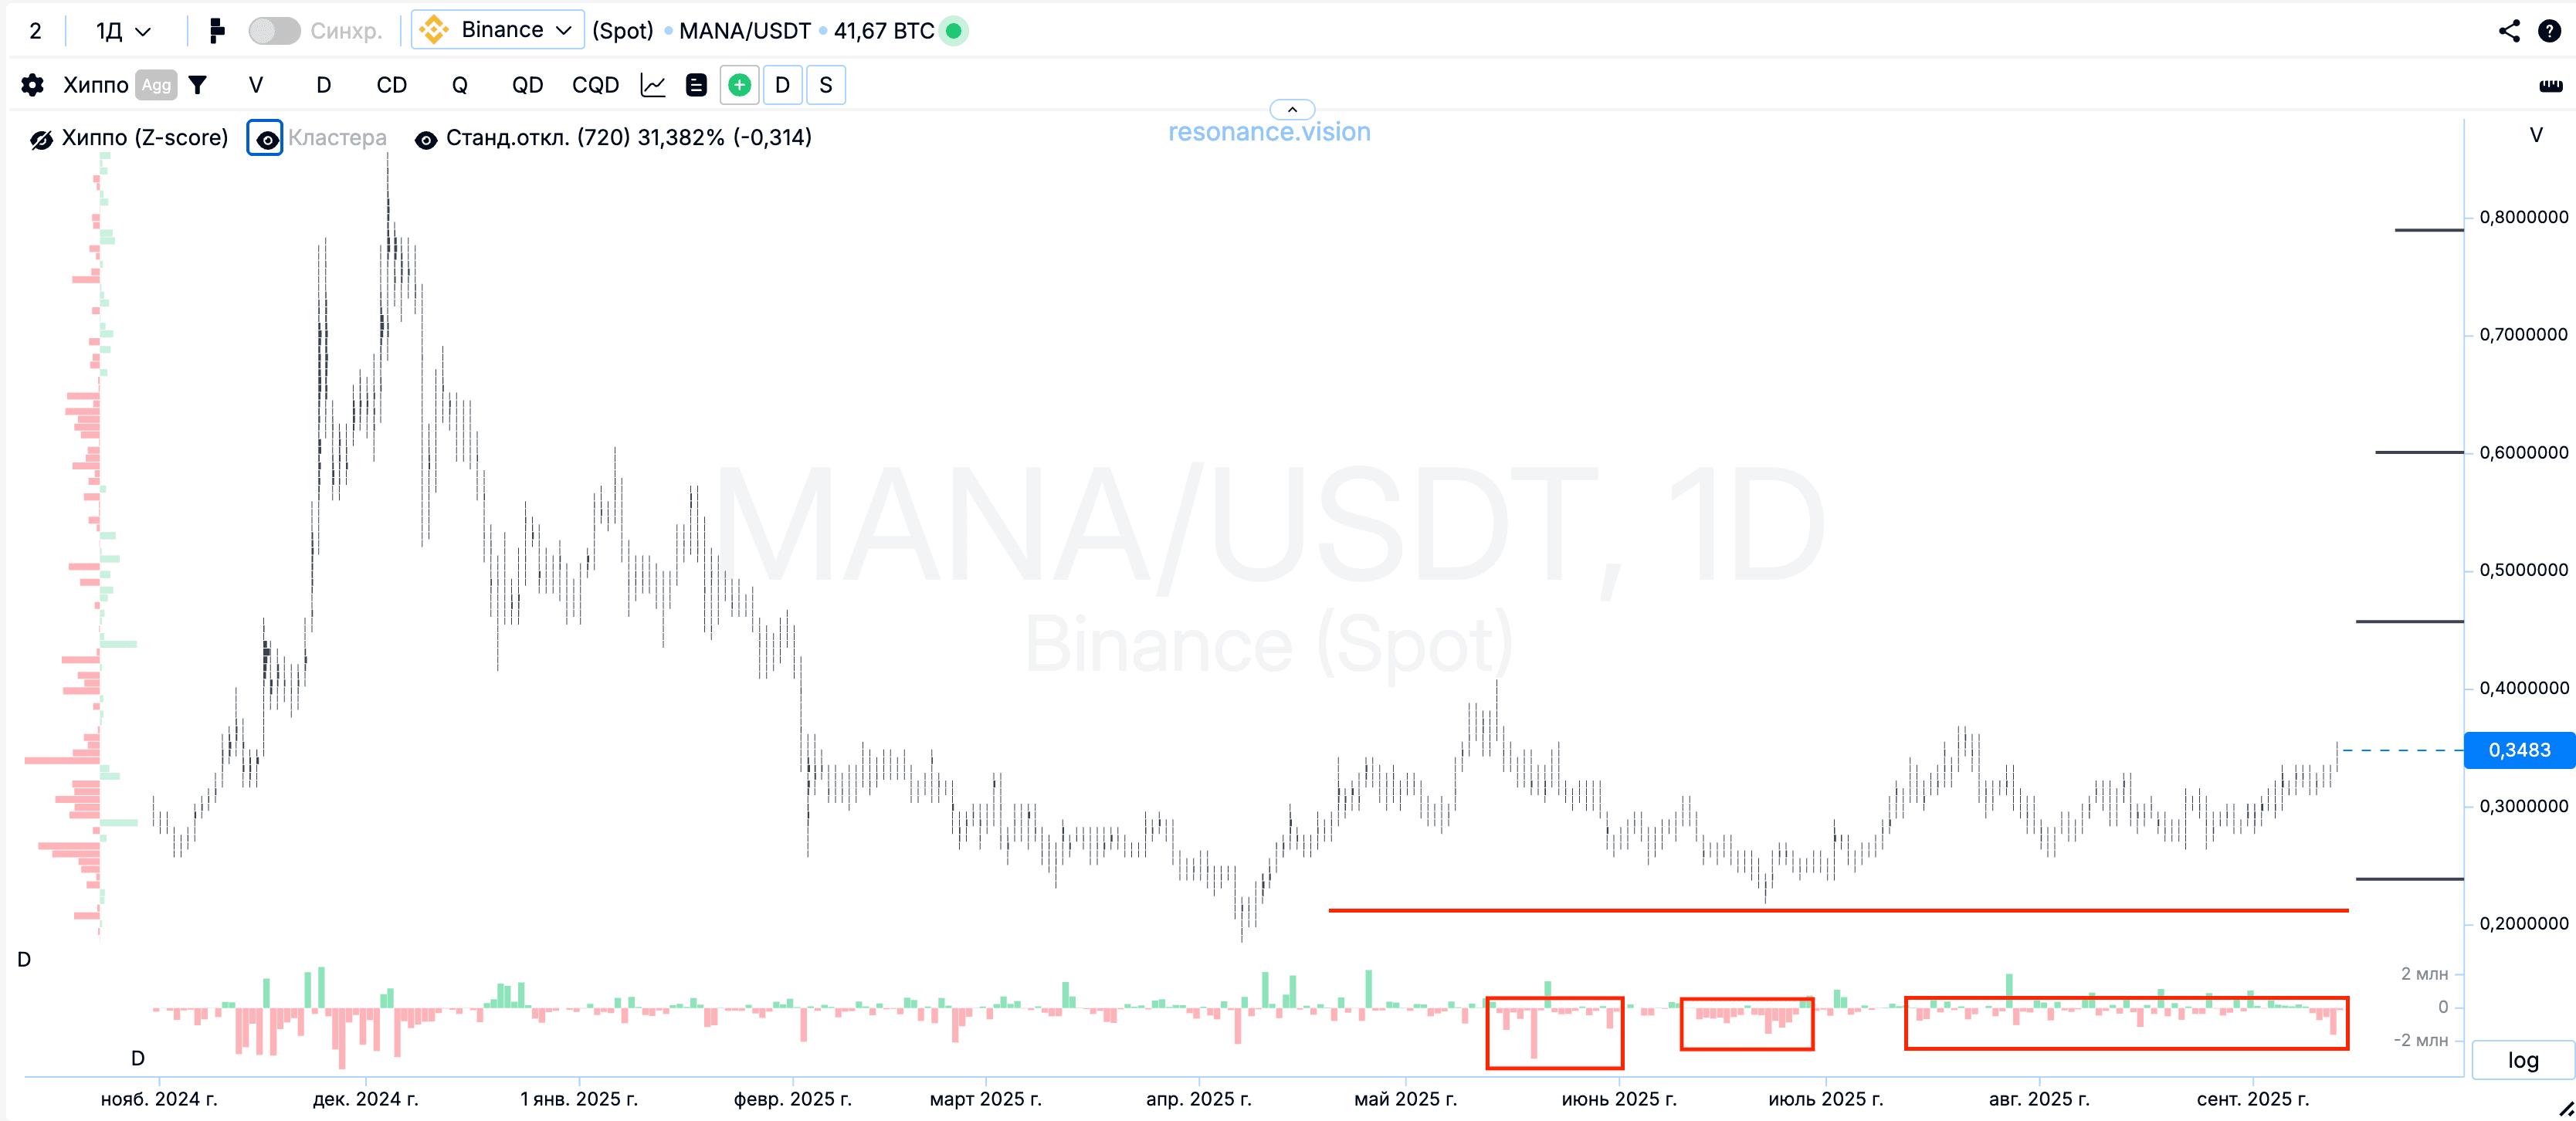
- Active Buying: There are clear signs of active market buying. Market participants are actively buying up the supply, indicating the presence of scarcity and the potential for an impulsive rally.
Interestingly, this activity was observed long before the publication of “bullish” news, which once again confirms: the market often precedes the news, and the news only serves as a catalyst for an already existing move.
Conclusion
Despite low staking yields, MANA shows promising signs of recovery. Growing interest from the Asian region and visual signs of scarcity on the chart indicate that the token may be ready for a new growth phase. While some might consider the token for range trading, the current market behavior provides grounds for directional long positions. As always, it is important to remember risk management and to analyze the market independently, without relying solely on sensational headlines.
No need to invent complex schemes or hunt for the “grail”. Use the tools of the Resonance platform.
Sign up on exchanges via our links and get bonuses:
OKX | BingX | KuCoin.
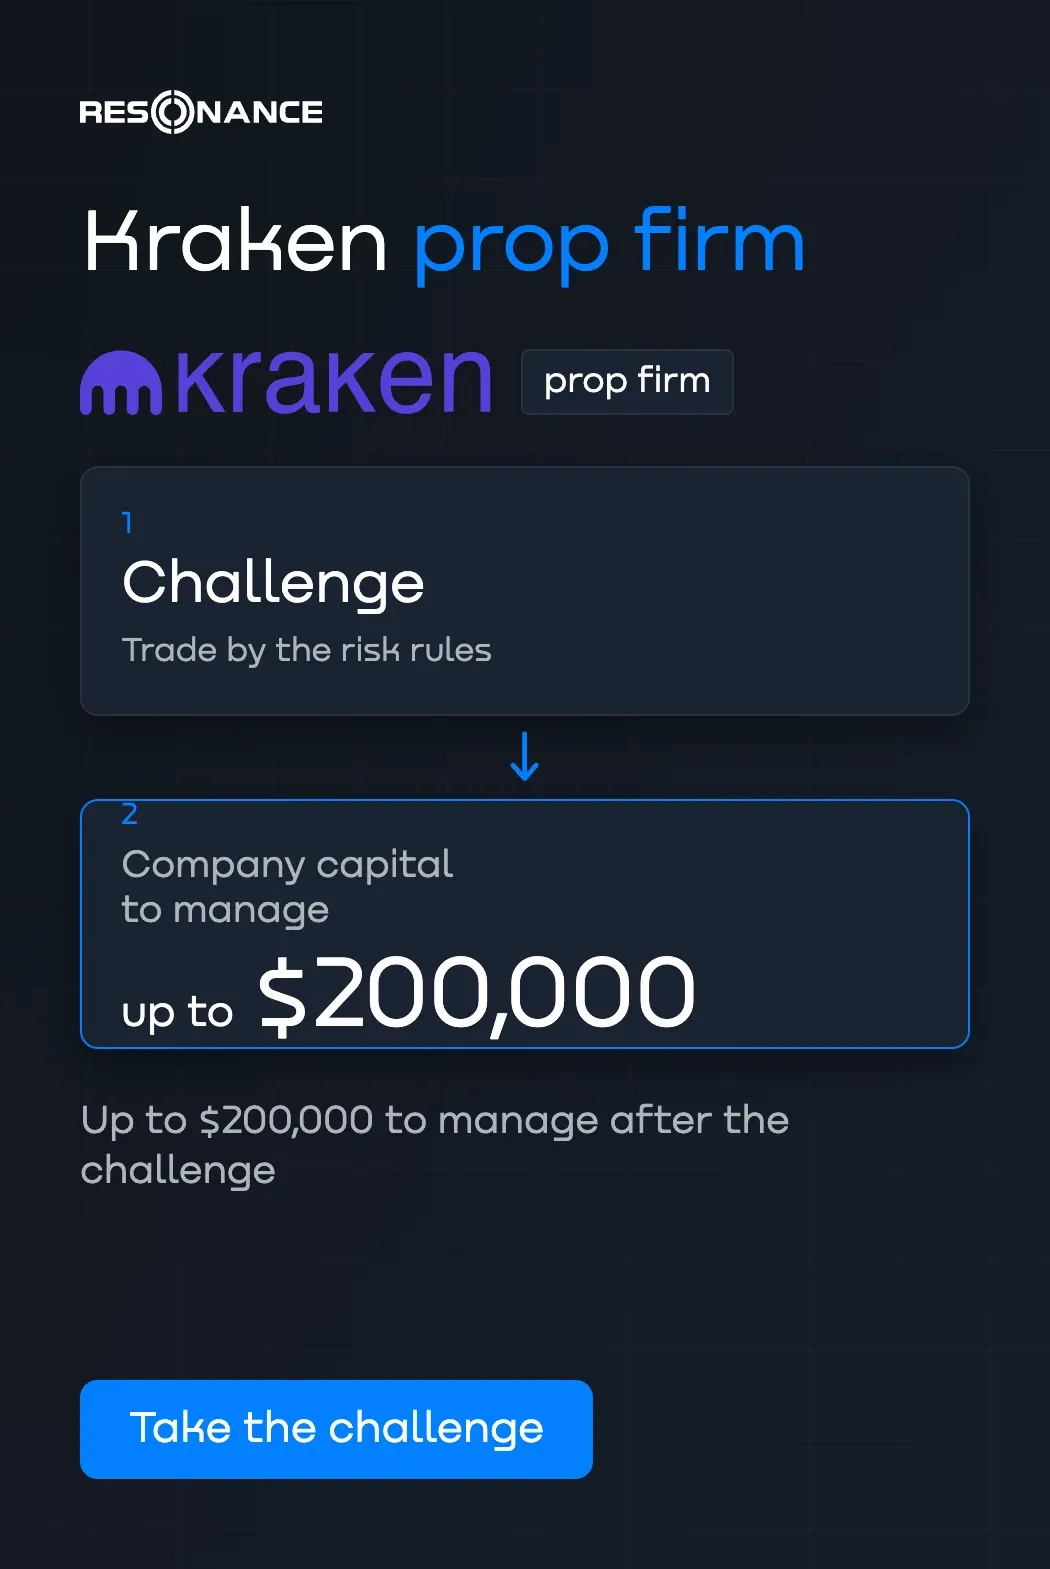
Prop firm — trade with the company’s capital: Kraken.
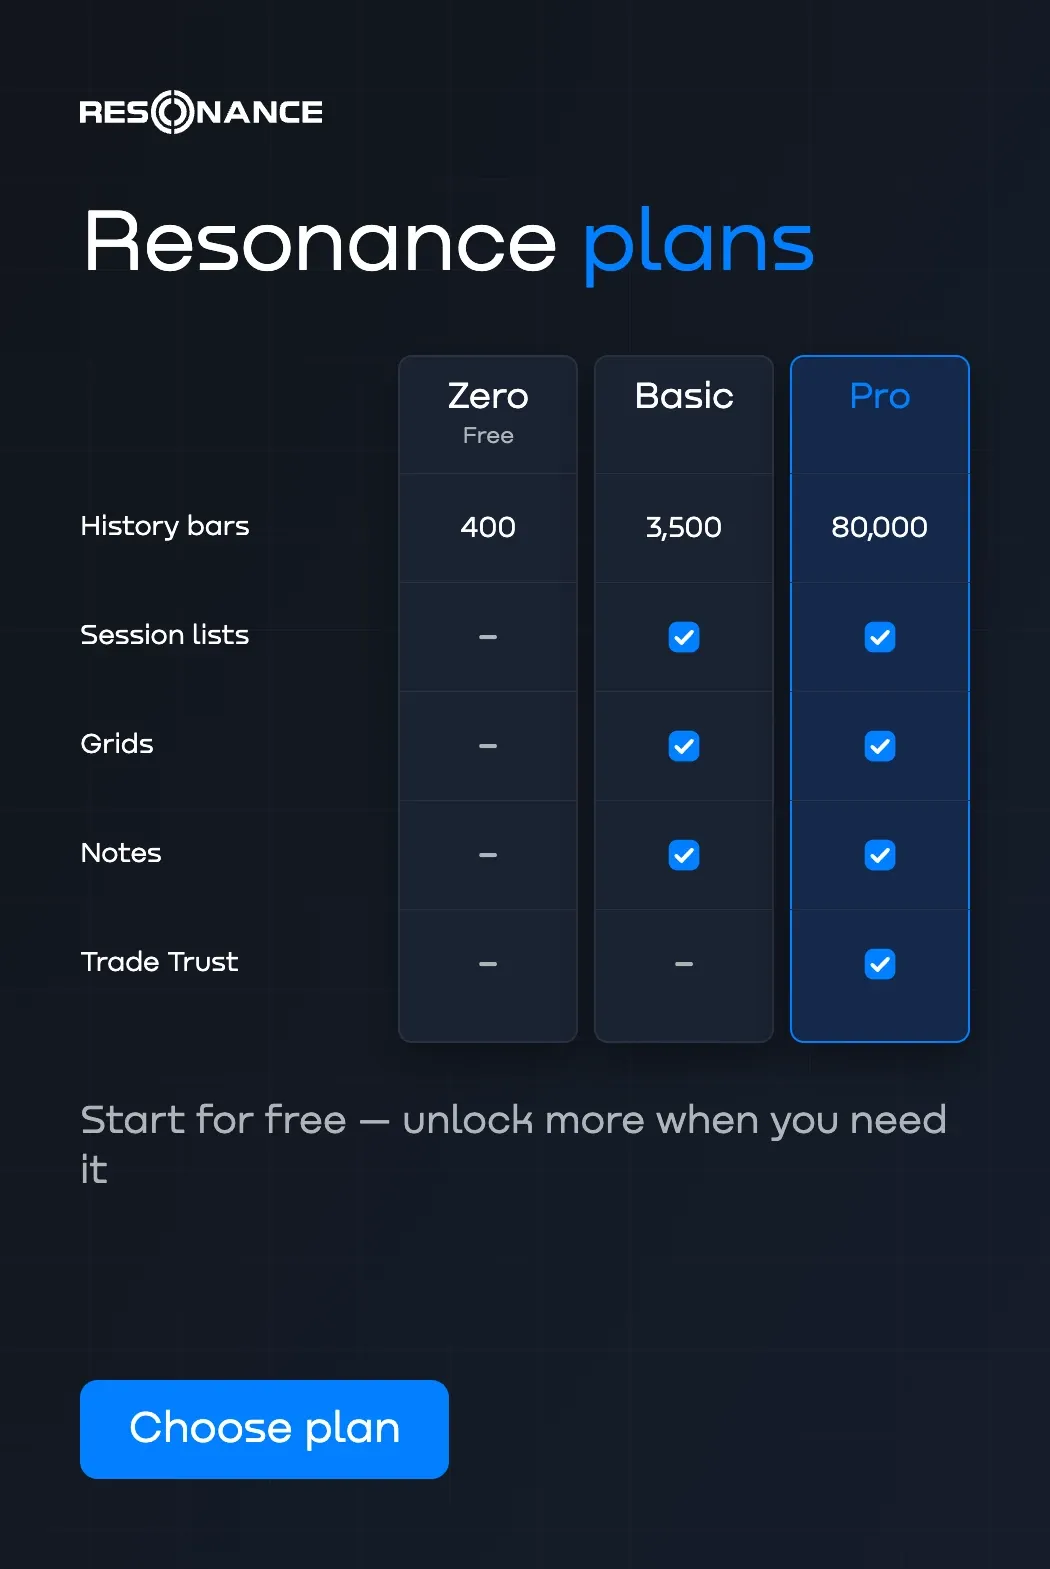
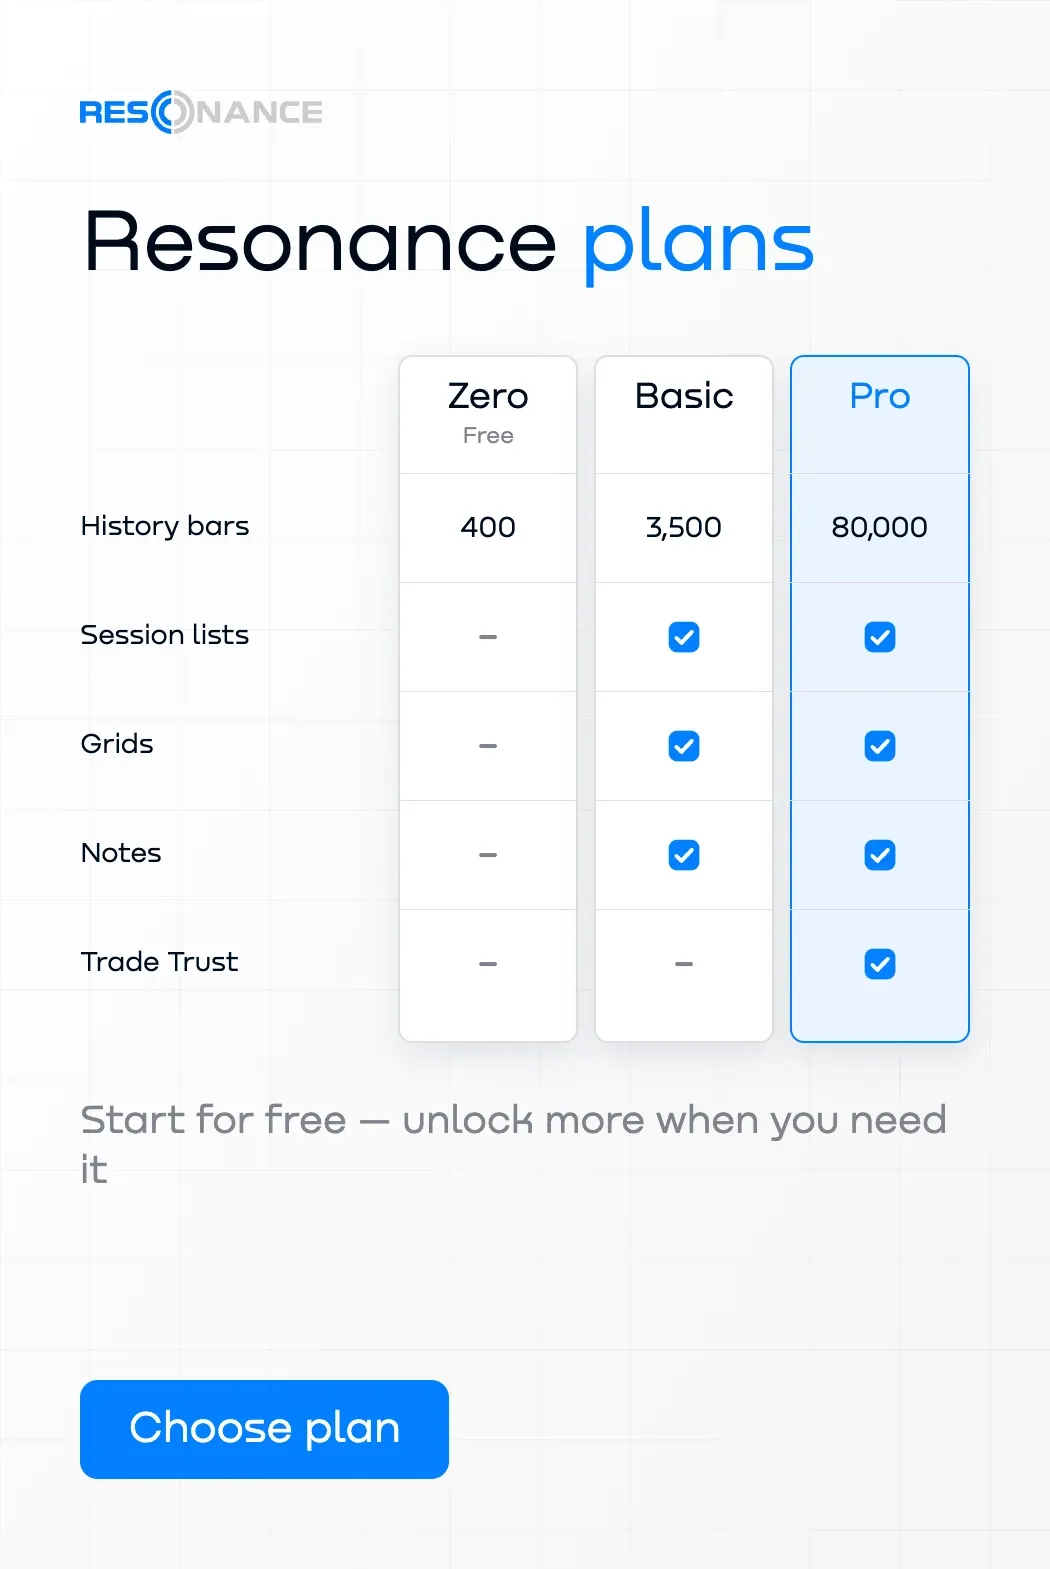
Promo code TOPBLOG gives you 10% off any Resonance plan.
Recommended articles