STRK +208.70% (Directional Strategy Resonance)

This analysis will show how even a beginner can make a profit with low risk.
Let’s take a closer look at how:
Weak price reaction to sales signaled a deficit.
Limit support and low volatility created an ideal entry point.
Timely profit-taking saved from a reversal.
Find out how volume analysis helps you make a profit systematically!
Table of contents

Coin: STRK/USDT
Risk: low
Understanding level: beginner
Reasons to enter
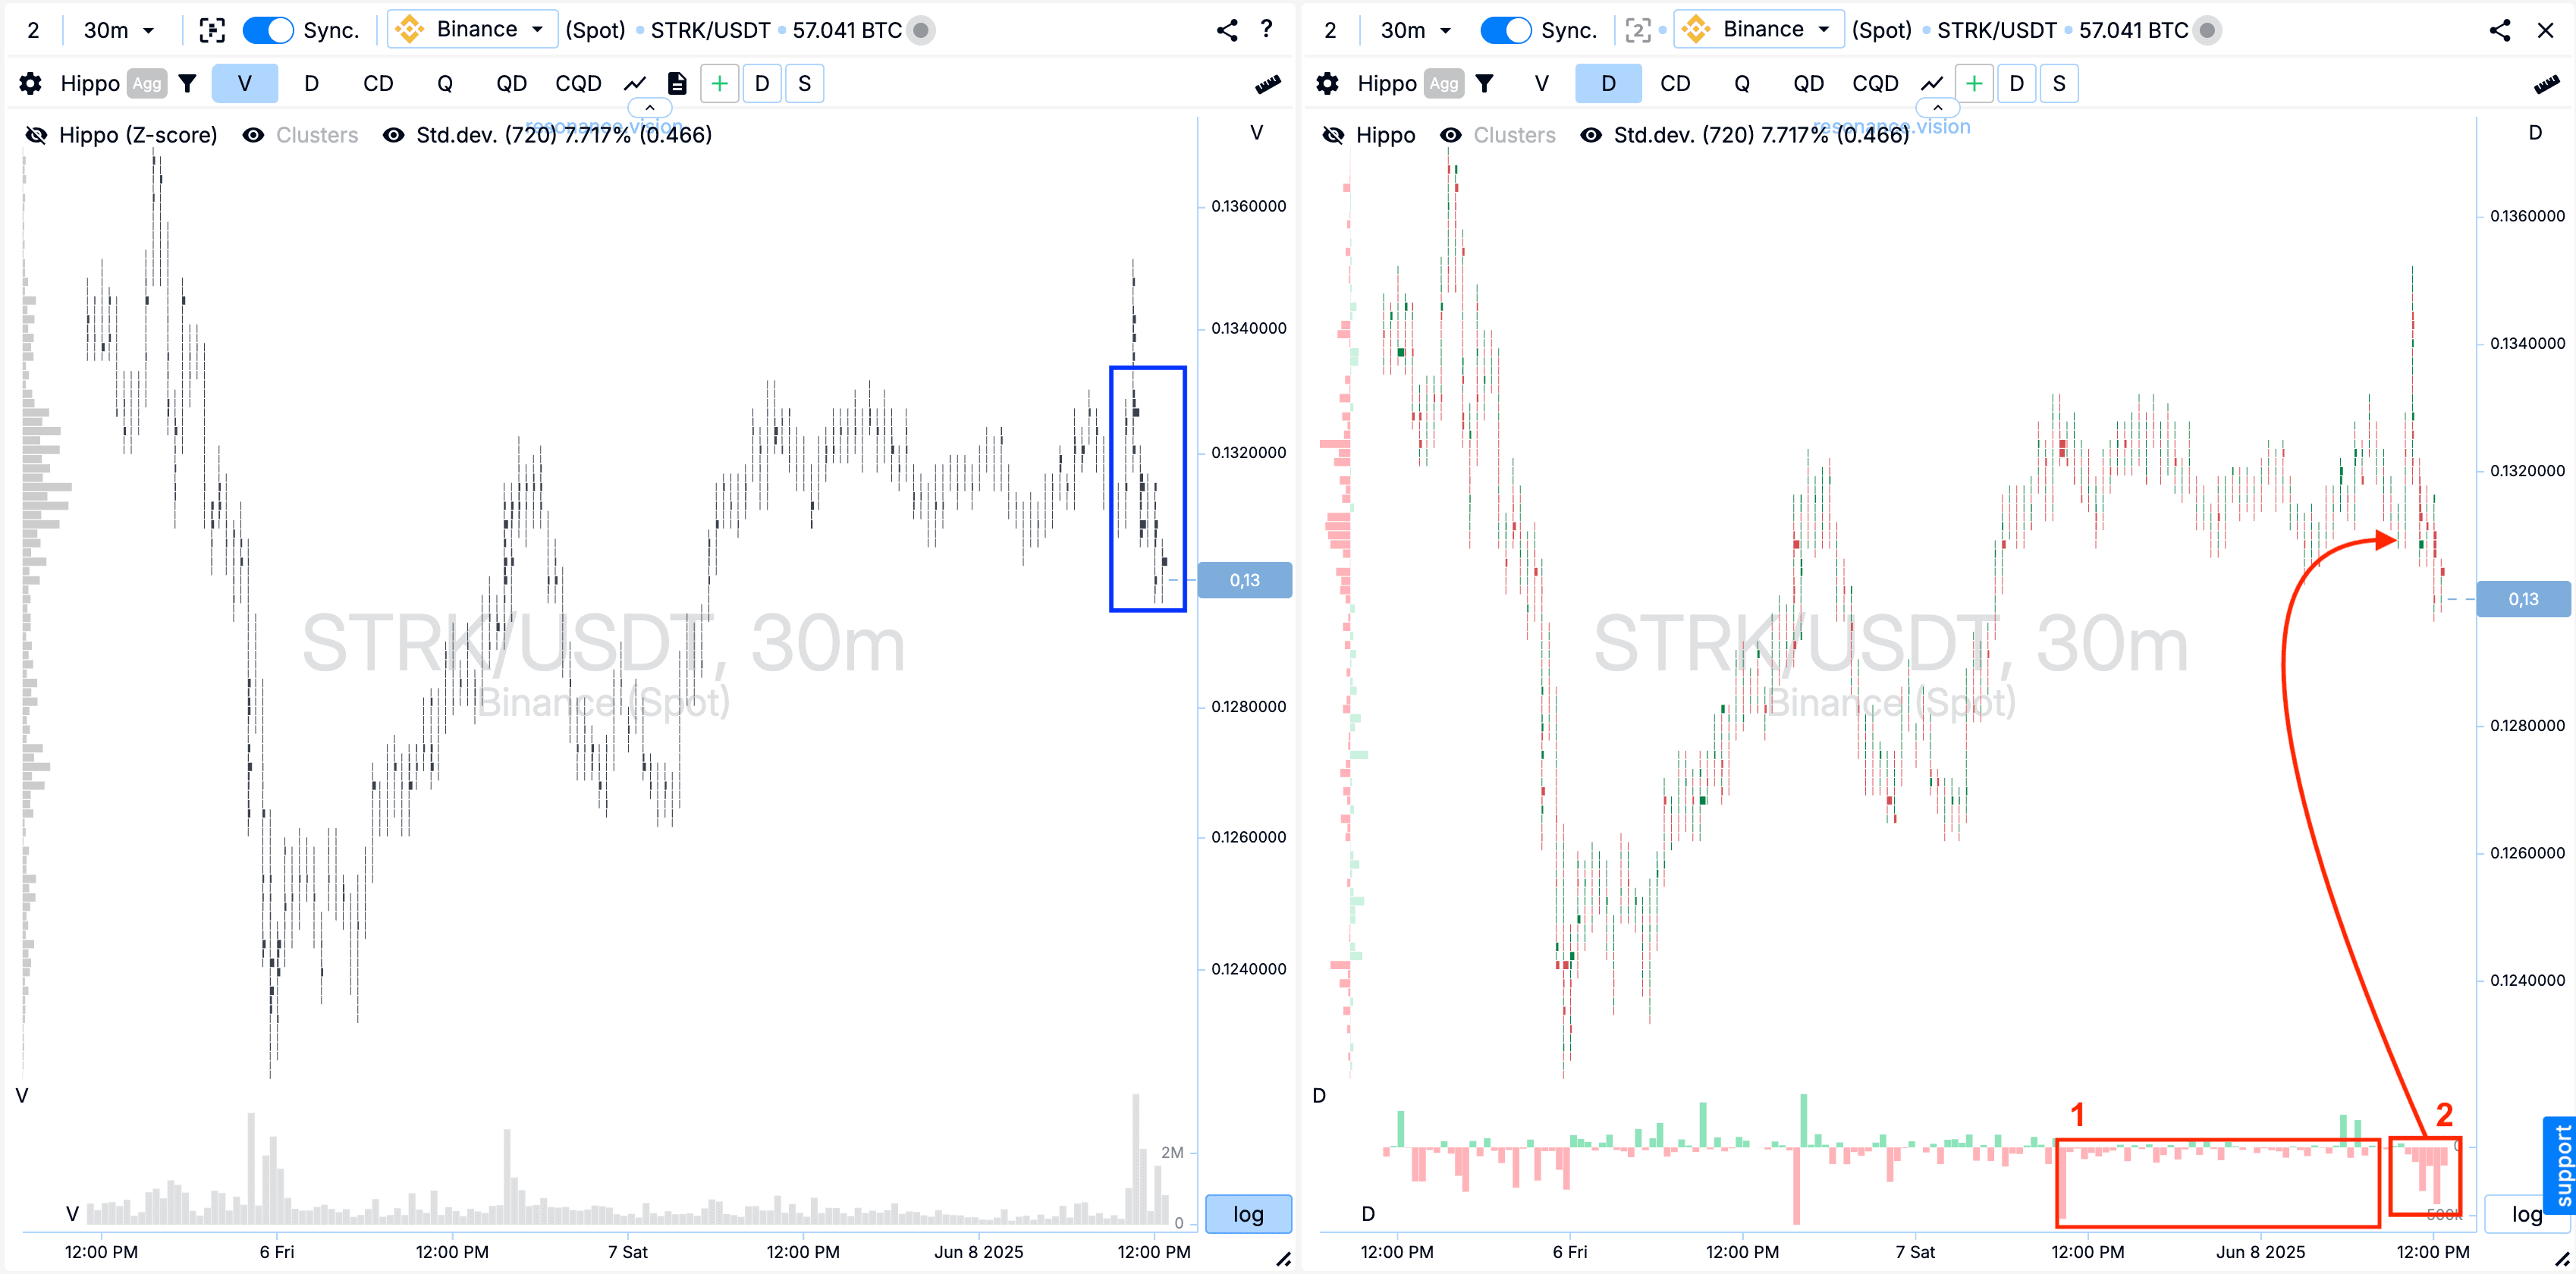
Cluster chart: In the price range, I noted the formed clusters by volume (blue rectangle).
Assessing the behavior of participants, I noted that despite the prolonged prevalence of sales (rectangle #1), the price didn’t decrease. Even with an increase in sales volume (rectangle #2), the price reaction remained minimal. This indicates a possible local deficit.
In the Dashboard
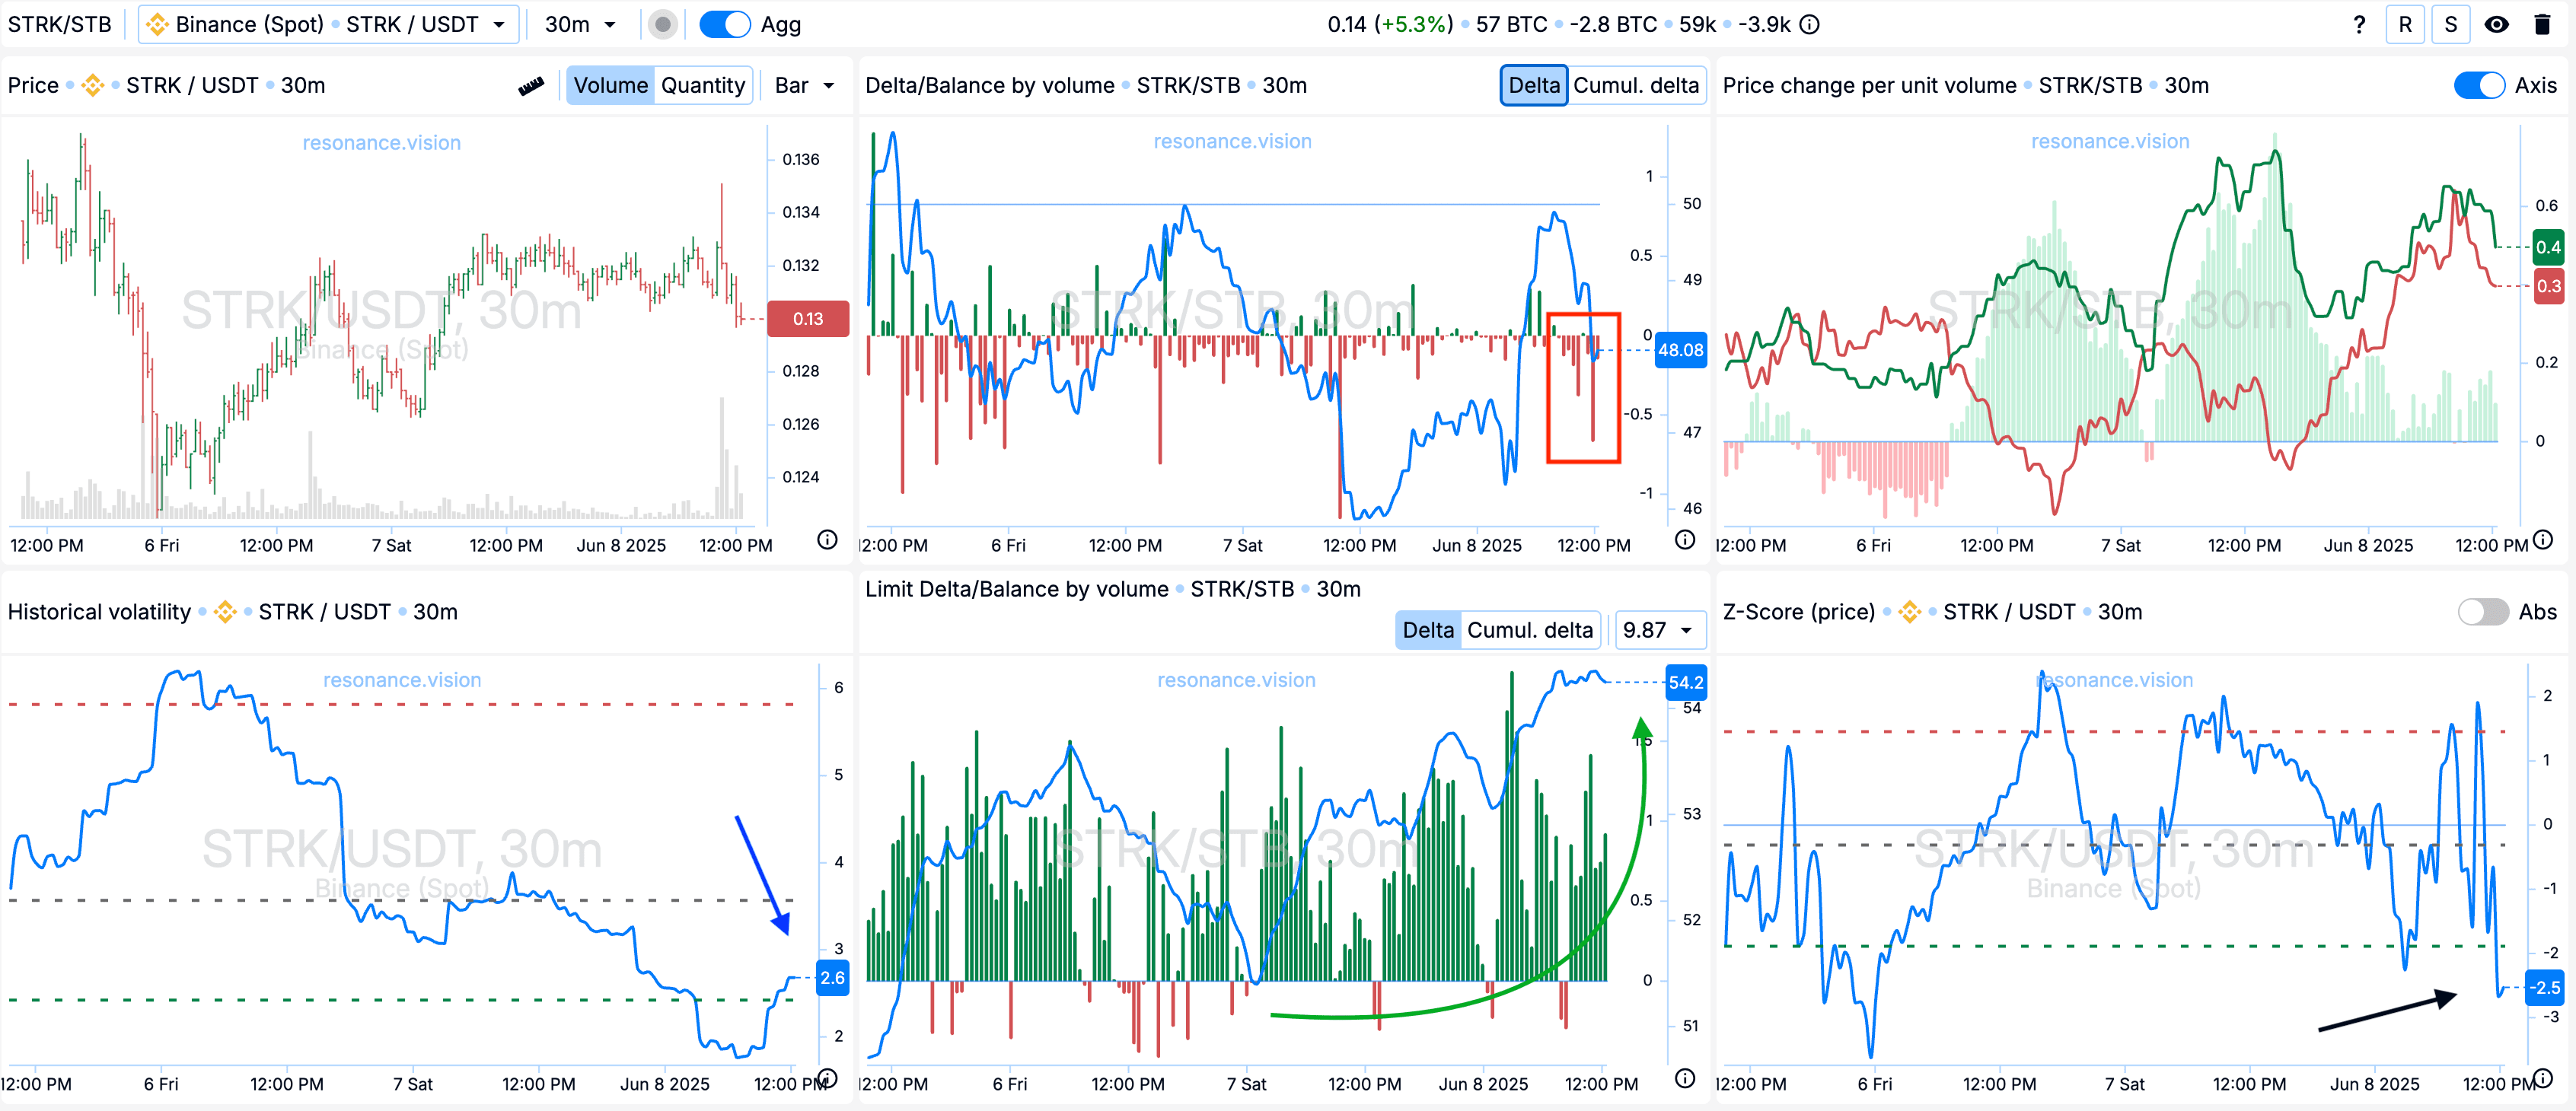
Delta/Balance by volume and limit delta: According to aggregated data, market sales prevail (red rectangle). At the same time, active substitution of buy orders is observed for limit orders - this can be seen in the delta histograms (green arrow). This situation indicates the presence of limit support ready to accept the incoming market sales volume.
Historical volatility: At the time of entering the position, volatility was at a fairly low value (blue arrow), which often precedes a significant price movement.
Z-Score (price): An abnormal downward price deviation of more than 2.5 standard deviations (black arrow) is also noted, which may indicate a potential reversal point or extreme value.
Exit reasons
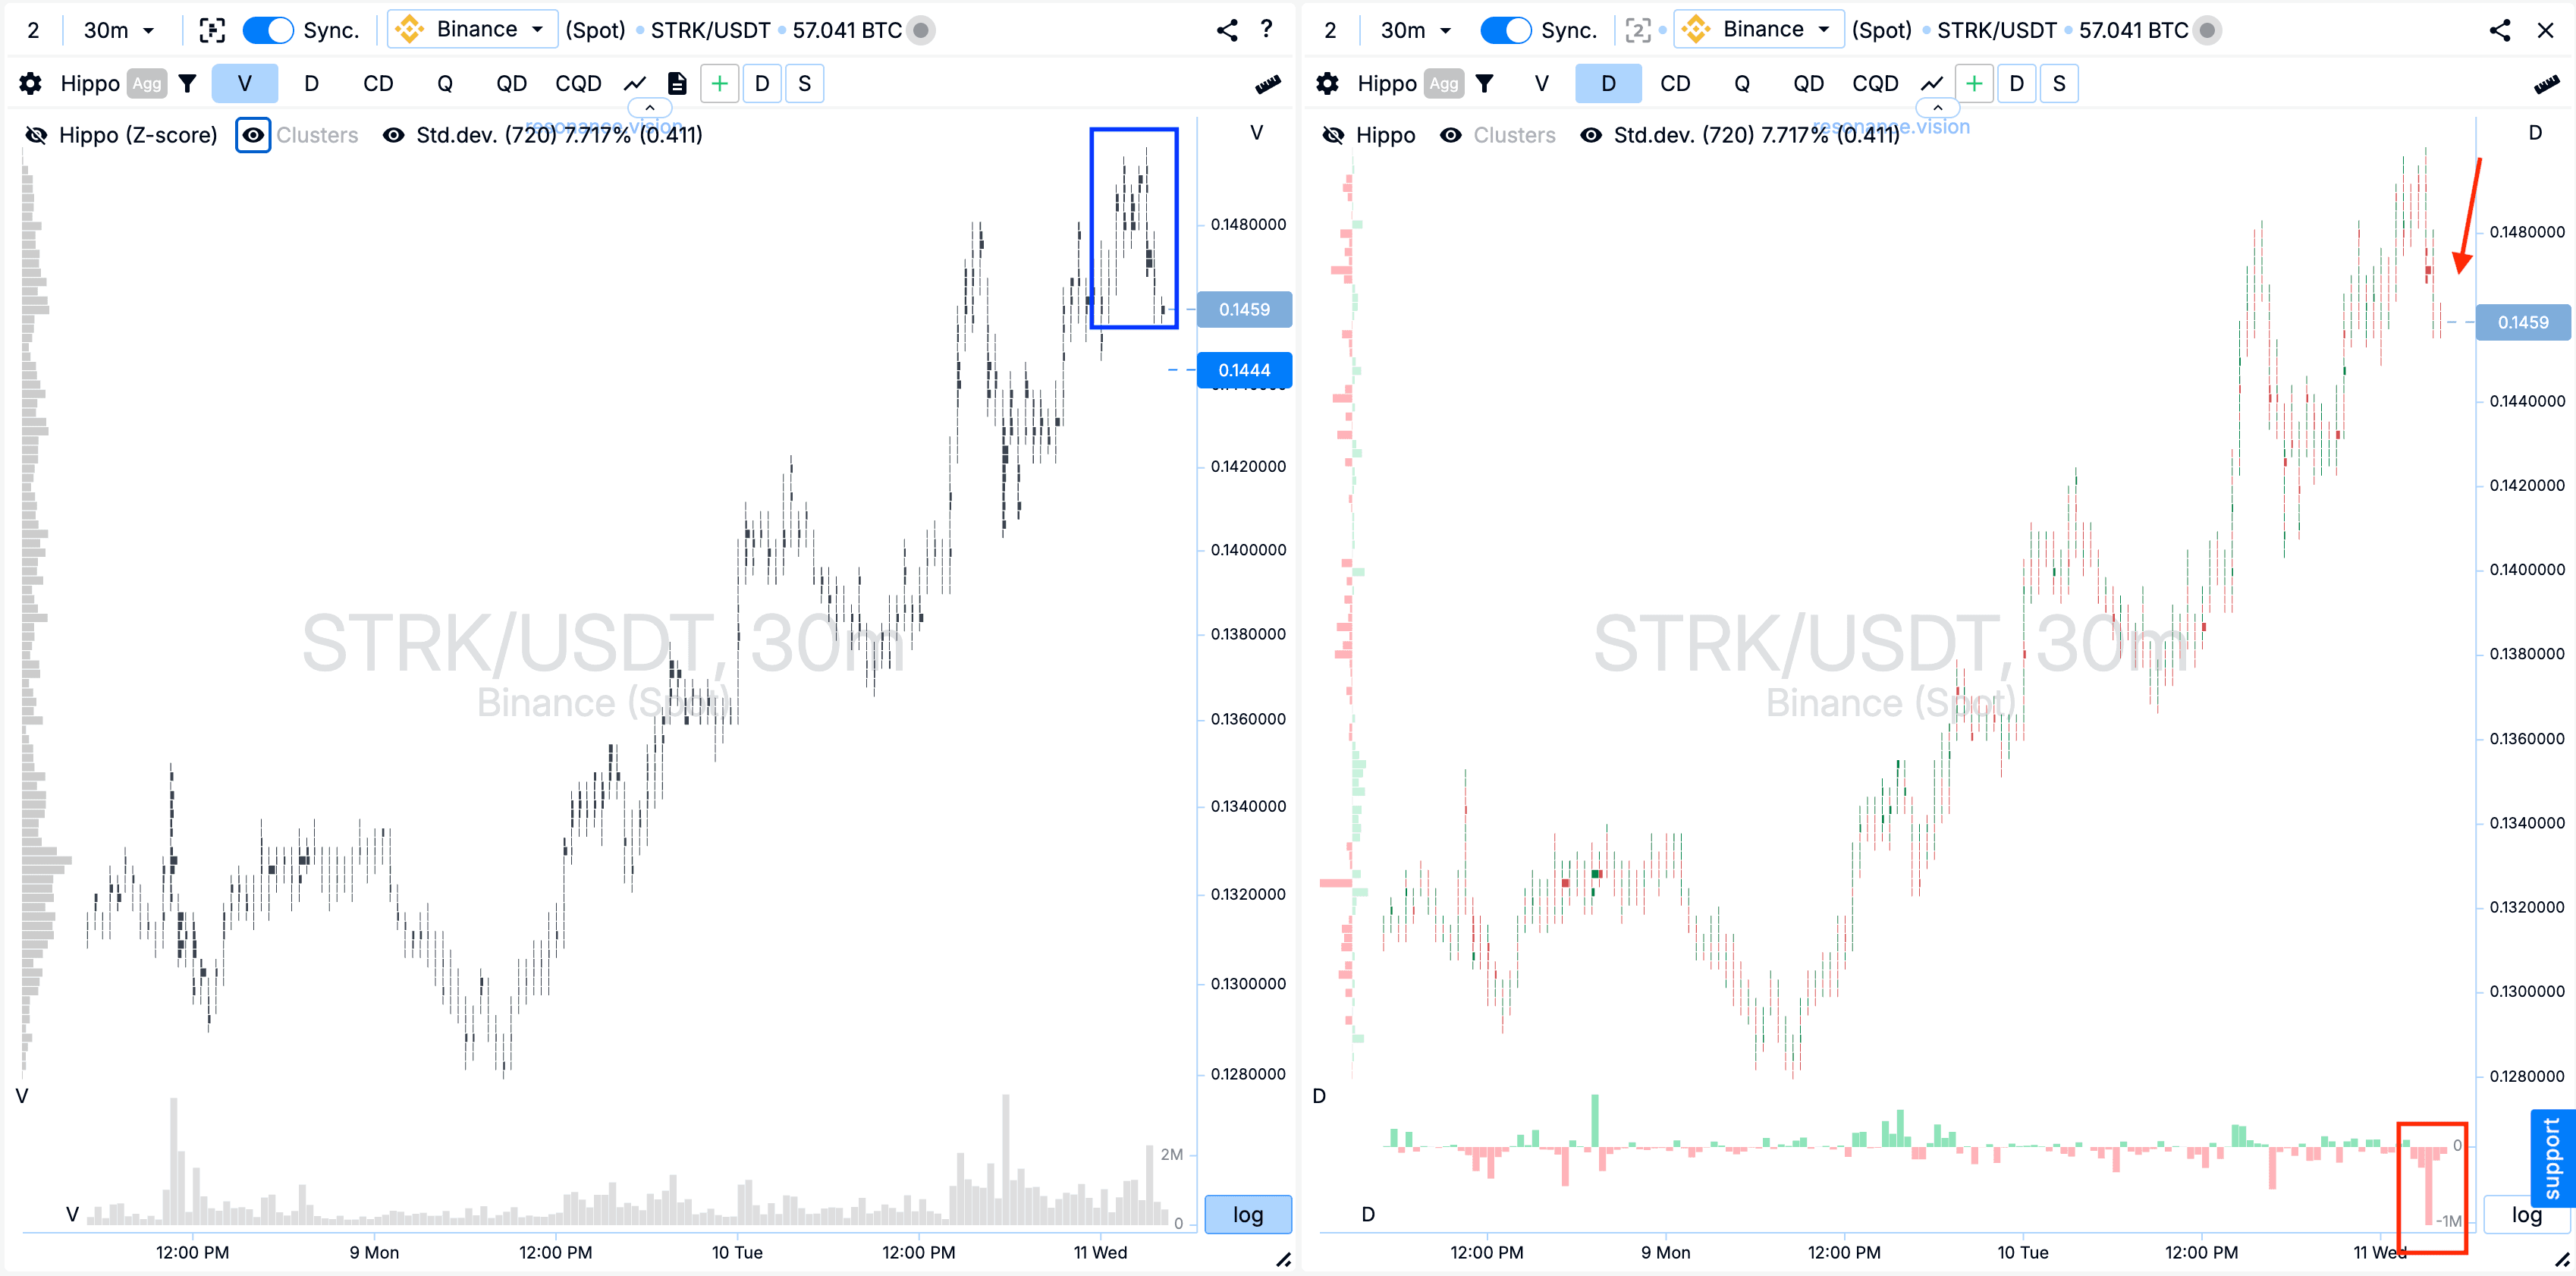
Cluster chart: In the formed clusters by volume (blue rectangle), there is a significant increase in sell volumes, which led to a decrease in the price. This is confirmed by the delta histogram, where sales are clearly visible (red rectangle with an arrow).
Looking at the Dashboard
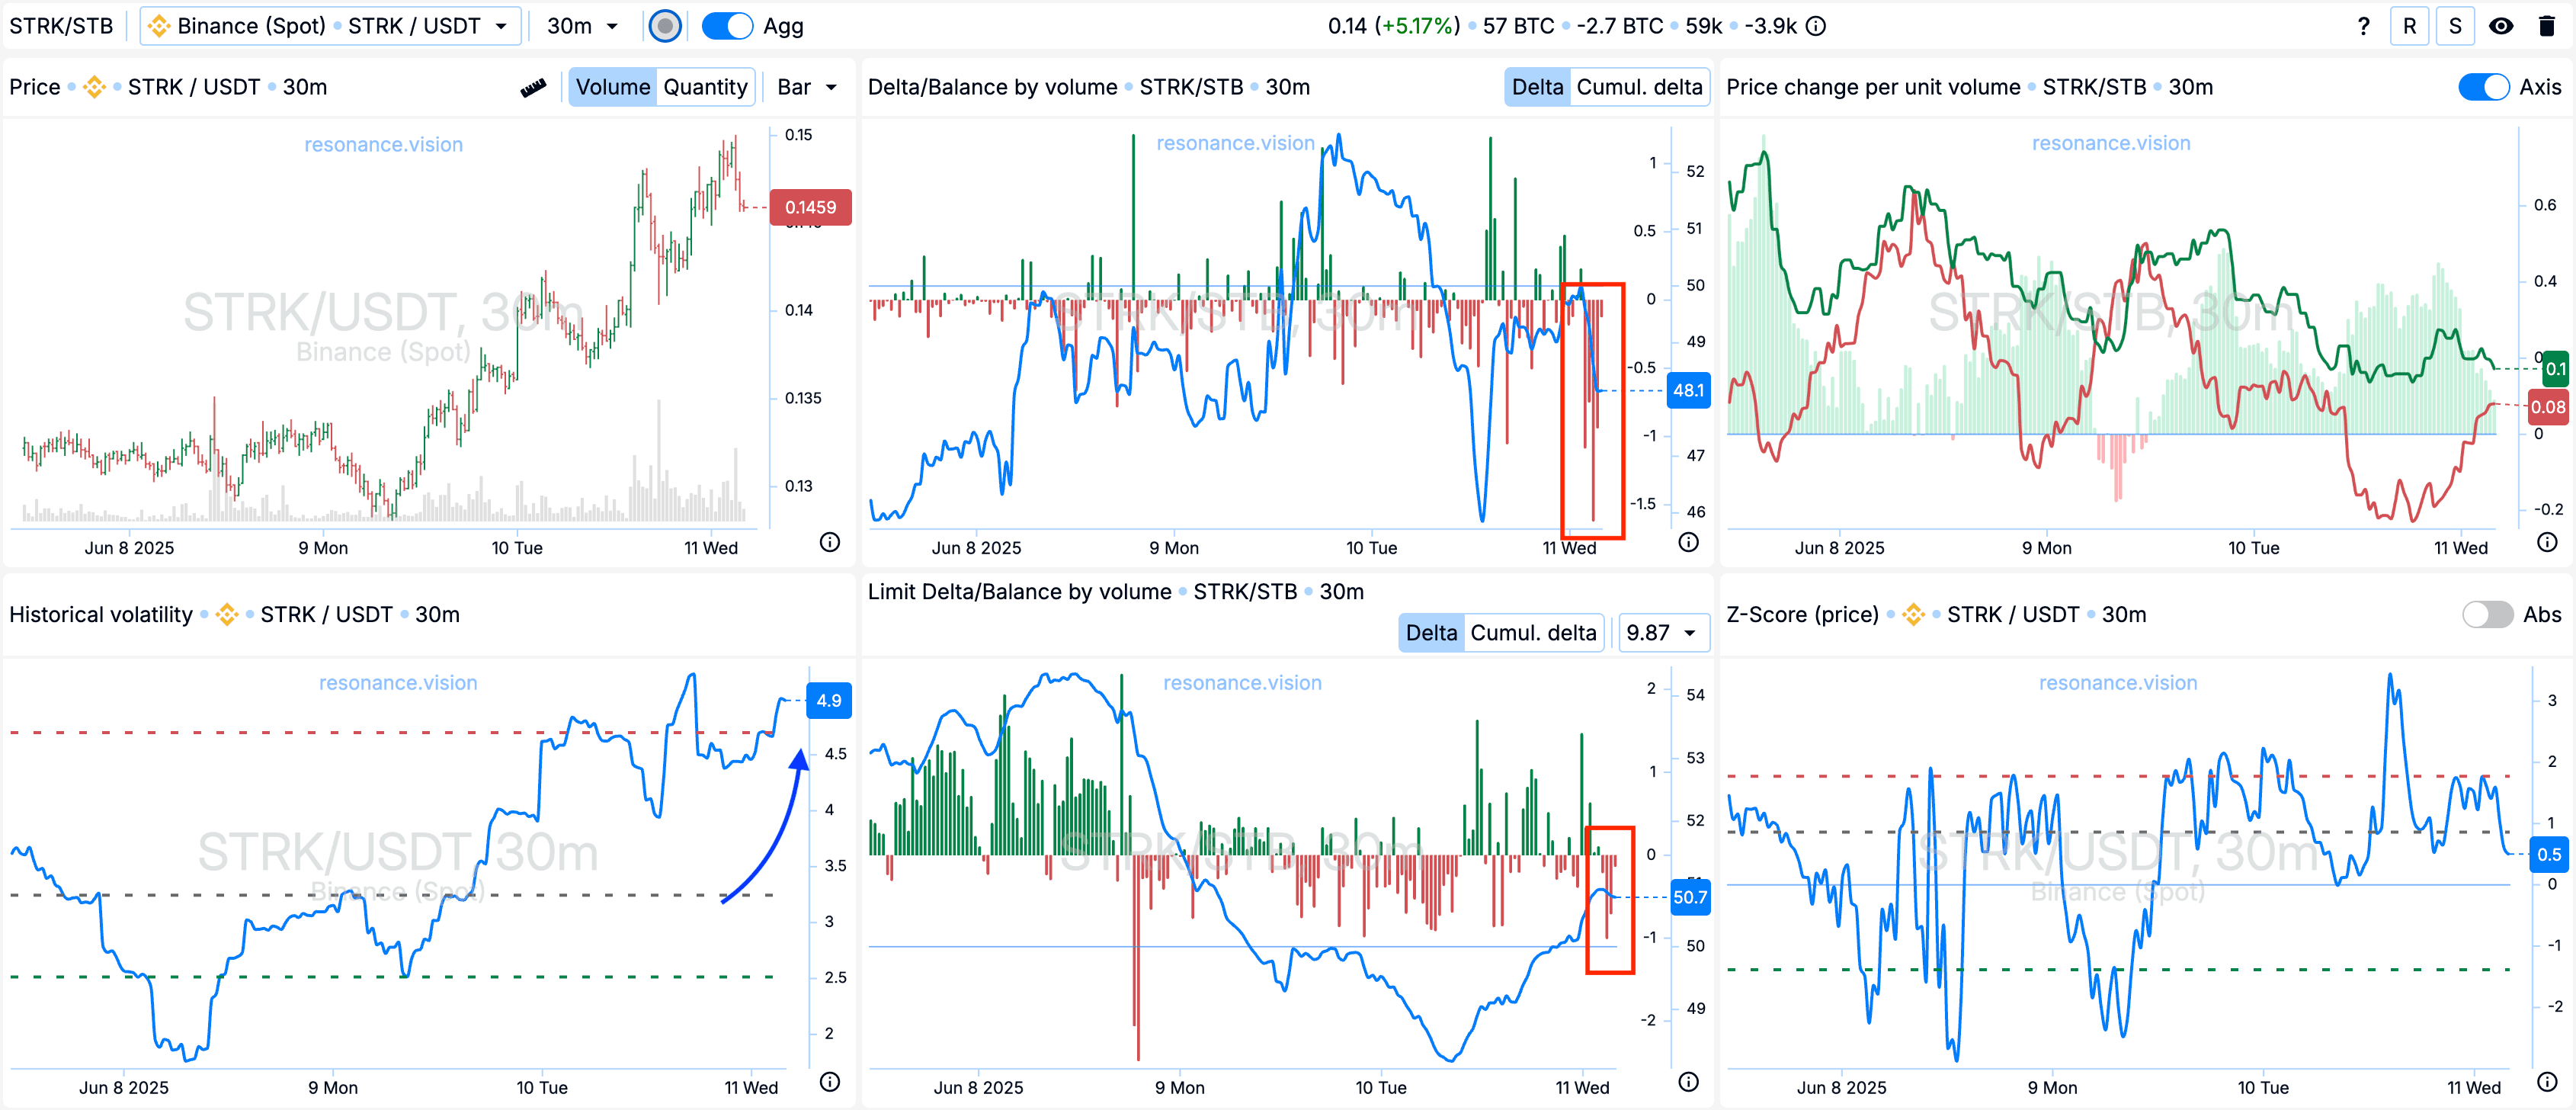
Delta/Balance by volume and limit delta: Both market orders and limit orders are dominated by selling - this can be seen in the delta and is highlighted by the red rectangles.
Historical Volatility: The volatility indicator has risen significantly and is at locally abnormal values according to the persentil (blue arrow).
Result
We managed to take a profit of +208.70%.

Conclusion
A clear example of how a weak price reaction to dominant market sales can signal an emerging deficit. Support from limit orders and low volatility at the time of entry created conditions for a justified entry point into a long. And timely fixation of volumes and monitoring of sellers’ activity allowed to exit the position before the reversal.
This approach, based on deep analysis of volume and market behavior, gives the trader confidence in his actions and helps to systematically fix profits.
Follow new articles in our telegram channel.
No need to invent complicated schemes and look for the “grail”. Use the tools of the Resonance platform.
Register using the link - get a bonus and start earning:
OKX | BingX | KuCoin.
Promo code TOPBLOG gives you 10% discount on any Resonance tariff plan.
Recommended articles