Simulator vs Simulator PRO: What’s the Difference?

Compare Simulator and Simulator PRO: features, analytics, Trade State, Trade Trust, Heatmap, BAS, Price Forecast and trading statistics.
Table of contents
- 01What Simulator and Simulator PRO Have in Common
- 02Simulator vs Simulator PRO Comparison
- 03Trade State: Structure and Flow Data
- 04Trade Trust: Confidence in Trading Activity
- 05Price Forecast / Aires Analytics
- 06Aggregated Data
- 07Statistics
- 08Why a PRO Feature May Be Unavailable Even After You Buy PRO
- 09Which Plan Should You Choose?
- 10Where to Find the Current Plan Details
Simulator PRO is not a different simulator and does not use different trading mechanics. Both plans use the same interface, the same trading panel and the same amount of historical data.
The main difference is analytics. PRO adds flow data to Trade State and unlocks Trade Trust, Aires Price Forecast, and aggregated data in Heatmap and BAS.
Importantly, some PRO analytics are available in random simulations only in Aires mode. Your plan determines whether you have access to a feature, while the random simulation mode determines whether that feature can be used in the current simulation.
What Simulator and Simulator PRO Have in Common
The core functionality is the same in Simulator and Simulator PRO. The trading mechanics, amount of historical data and overall simulation workflow do not differ between the two plans.
Both plans include:
- the same amount of historical data (History data amount);
- the same chart granularity — 25–400;
- the same set of timeframes within the corresponding random simulation mode;
- the trading panel: Balance, Equity, Free, Used, position size, leverage, Cross margin mode, TP %, SL % and estimated liquidation price;
- Long, Short and Close All buttons;
- simulation controls: +1 Bar, Bars scrolling and Restart;
- current simulation statistics: Total PnL, ROI, Win Rate, Profit Factor, Total Trades, Wins/Losses, Avg Win, Avg Loss and Max Drawdown;
- Heatmap for the current ticker;
- BAS without aggregation;
- Statistics Histogram;
- FTT markers;
- the structural component of Trade State in an Aires random simulation.
Both plans use launch-based packages. See the Plans page for the current number of launches included in each package.
Positions are therefore opened, managed, closed and calculated in the same way in Simulator and Simulator PRO. PRO changes the amount of analytical information available during practice, not the trading mechanics.
Simulator vs Simulator PRO Comparison
| Feature | Simulator | Simulator PRO | Where it works |
|---|---|---|---|
| Trading panel, timeframes, granularity | Yes | Yes | In both random simulation modes |
| Trade State | Structure only (price-based, without flow data) | Structure + flow data | Aires random simulation only |
| Trade Trust | No | Yes | Aires random simulation only |
| Aires Price Forecast | No | Yes | Aires random simulation only |
| Heatmap for the current ticker | Yes | Yes | Independent of Classic/Aires mode |
| Heatmap across all tickers (aggregation) | No | Yes | Independent of Classic/Aires mode |
| BAS without aggregation | Yes | Yes | Independent of Classic/Aires mode |
| BAS with aggregation | No | Yes | Independent of Classic/Aires mode |
| Statistics Histogram | Yes | Yes | Independent of Classic/Aires mode |
| FTT markers | Yes | Yes | Independent of Classic/Aires mode |
| All-Time Statistics | No | Yes | Independent of Classic/Aires mode |
Trade State: Structure and Flow Data
In an Aires random simulation, Trade State is available on both plans. The difference lies in the data it displays.
Structure (Simulator and Simulator PRO) shows how price is moving. Simulator builds Trade State using price data only, without volume-based flow data. You can see:
- periods: consolidation (blue block), uptrend and downtrend (green and red backgrounds);
- transitions between states: Formation, Trend Stop and Breakout;
- Swing Median and Path Roughness;
- state bands across several timeframes below the chart.
This is enough to practise reading market structure: identifying where a range is forming, where a trend is developing and where the market state is changing.
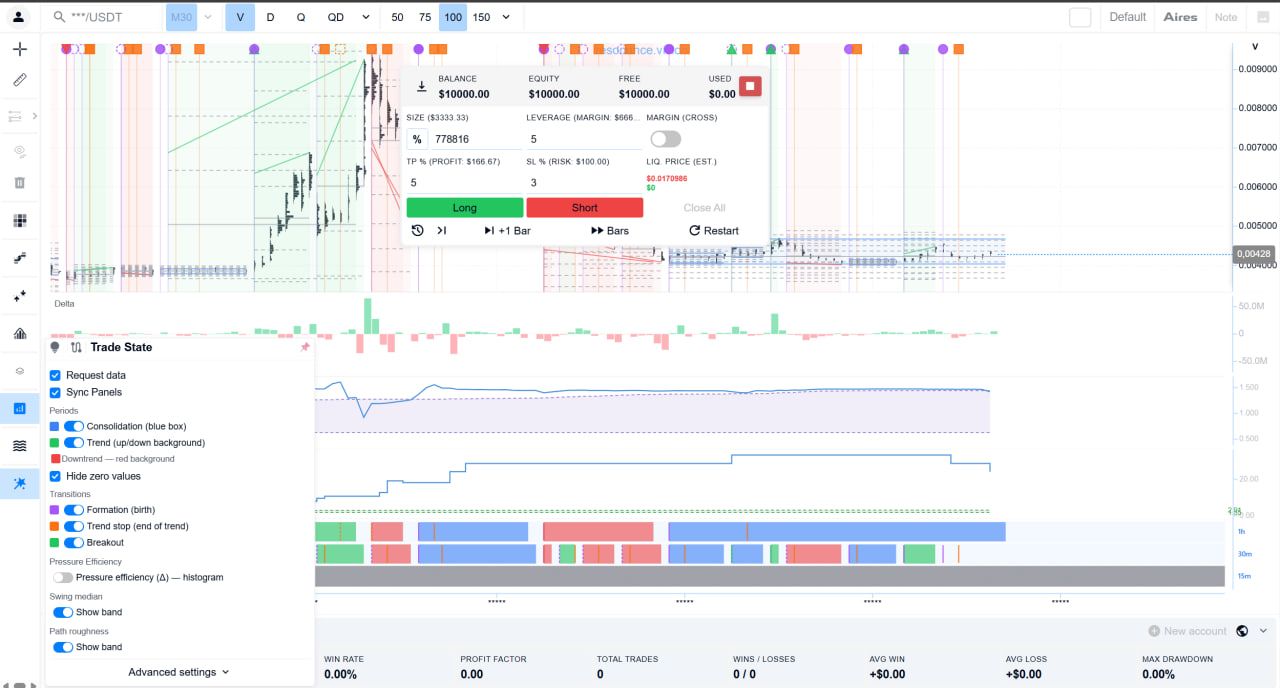
Flow data (Simulator PRO only) adds information about buying and selling activity to the structure:
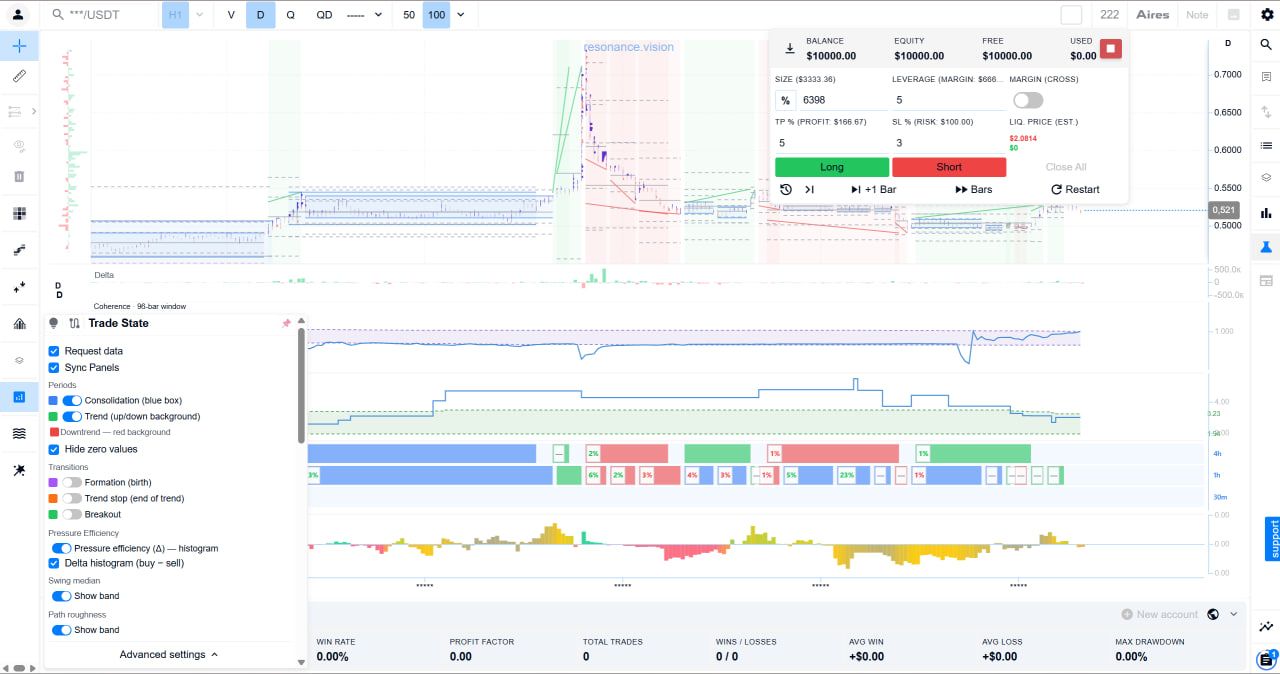
- Pressure Efficiency (Δ) — a histogram showing pressure efficiency;
- Delta Histogram (buy − sell) — the difference between buying and selling;
- percentage values in the state bands showing the strength of each segment.
Put simply, Simulator shows the structure of the price move. Simulator PRO also shows the buying and selling flow accompanying that move.
In random simulations, Trade State is available only in Aires mode, regardless of the plan.
Trade Trust: Confidence in Trading Activity
Trade Trust is available only in Simulator PRO. It helps you assess trading activity within a price zone using two parameters: volume and the number of trades.
A panel with two rows of data appears below the chart:
- Volume — confidence based on volume;
- Trades — confidence based on the number of trades.
Next to the panel name, you can see the current percentage values and a state label — for example, Noise.
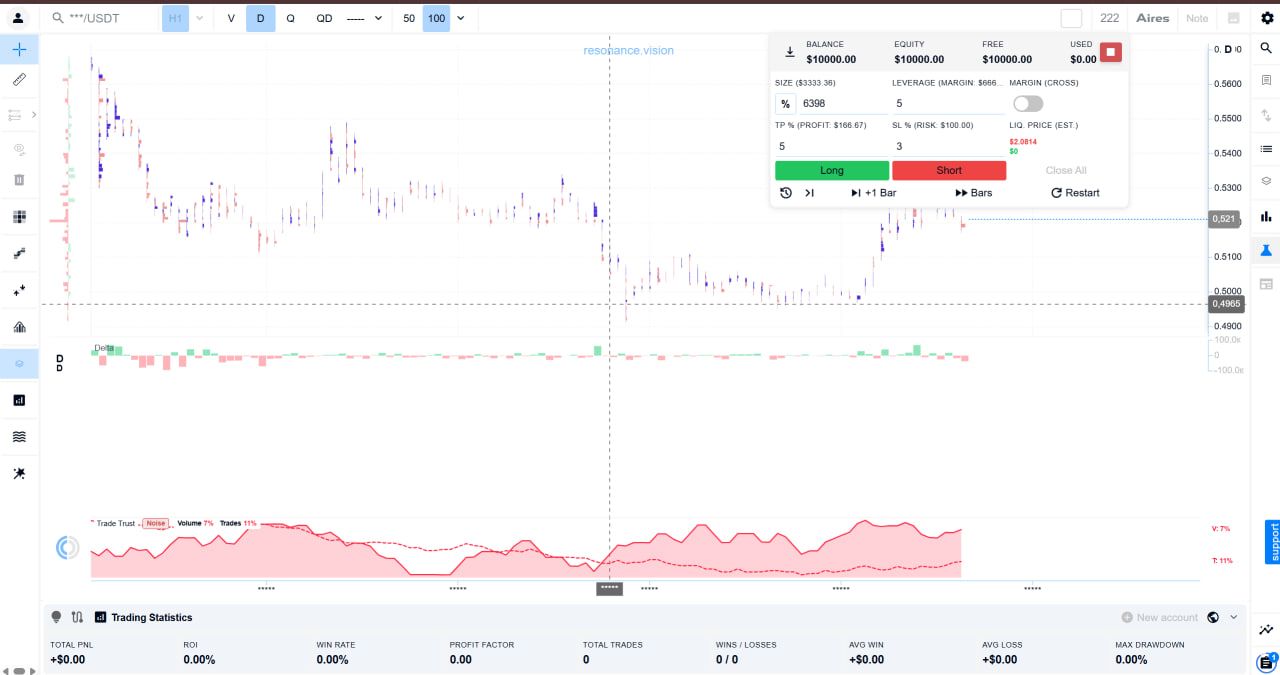
Why this matters: it helps distinguish a move backed by capital from retail noise. Similar price moves can be accompanied by very different levels of trading activity. Trade Trust provides additional context for evaluating volume and the number of trades within a price zone.
Trade Trust is not available in Simulator. Clicking its icon opens a window with information about access to the feature. You can still analyse market structure using Trade State, but Trade Trust data is unavailable.
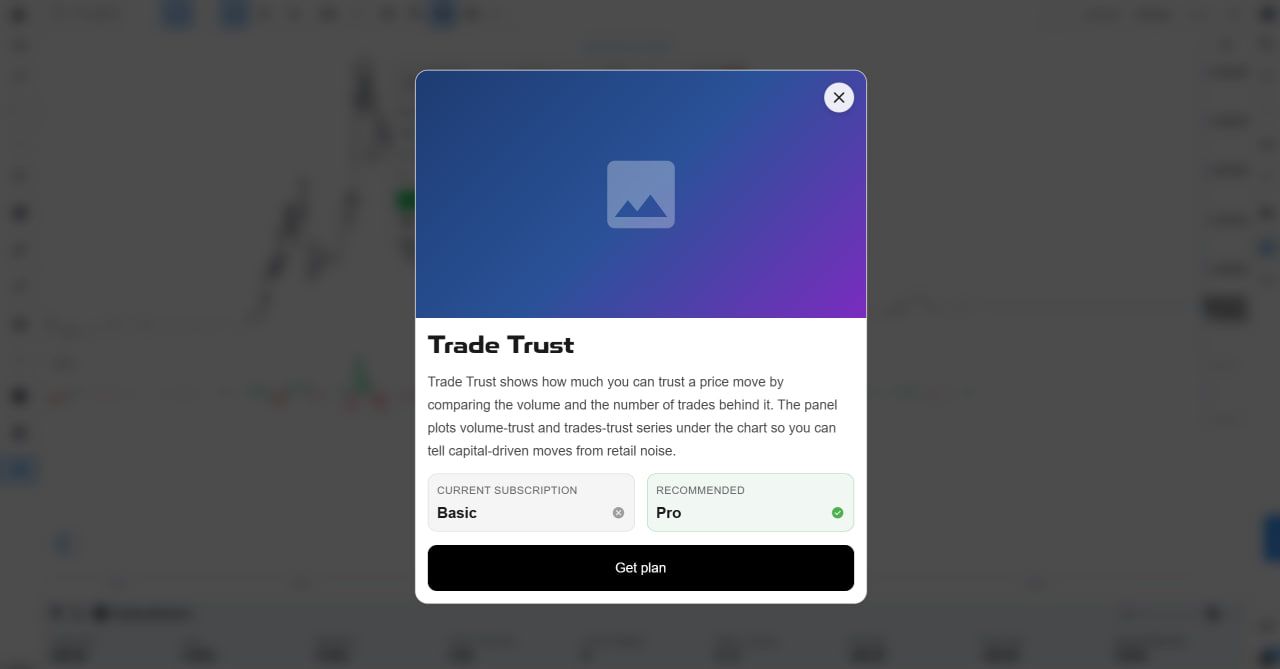
In random simulations, Trade Trust works only in Aires mode and only with Simulator PRO.
Price Forecast / Aires Analytics
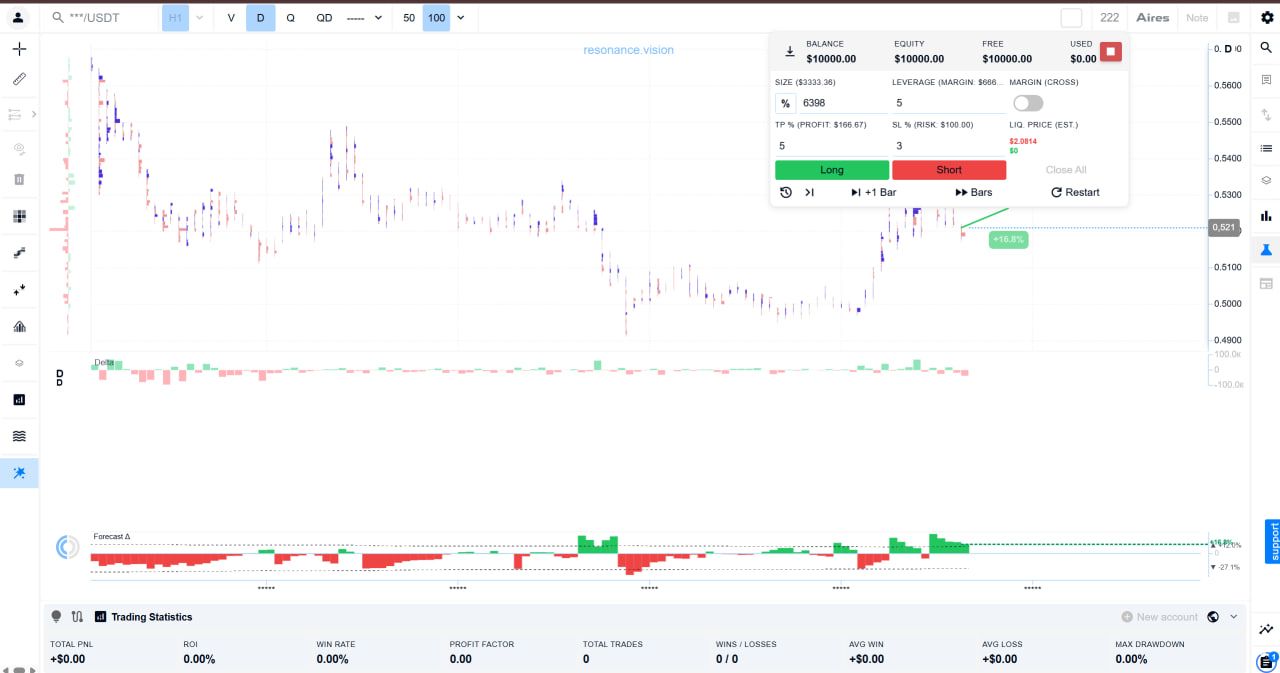
Aires Price Forecast is available only in Simulator PRO. In random simulations, it works only in Aires mode.
When enabled, it displays two elements:
- a forecast line extending from the current price, with the projected percentage change;
- the Forecast Δ panel below the chart — a histogram of the projected price change with upper and lower percentage bounds.
Price Forecast provides an additional reference point for analysing potential price movement. It is not a trading signal and does not guarantee that price will follow the projected scenario.
In Simulator, you can compare the forecast with your own analysis and see where your view aligns with the model and where it differs.
Aggregated Data
Heatmap and BAS are available on both plans. The difference is aggregation.
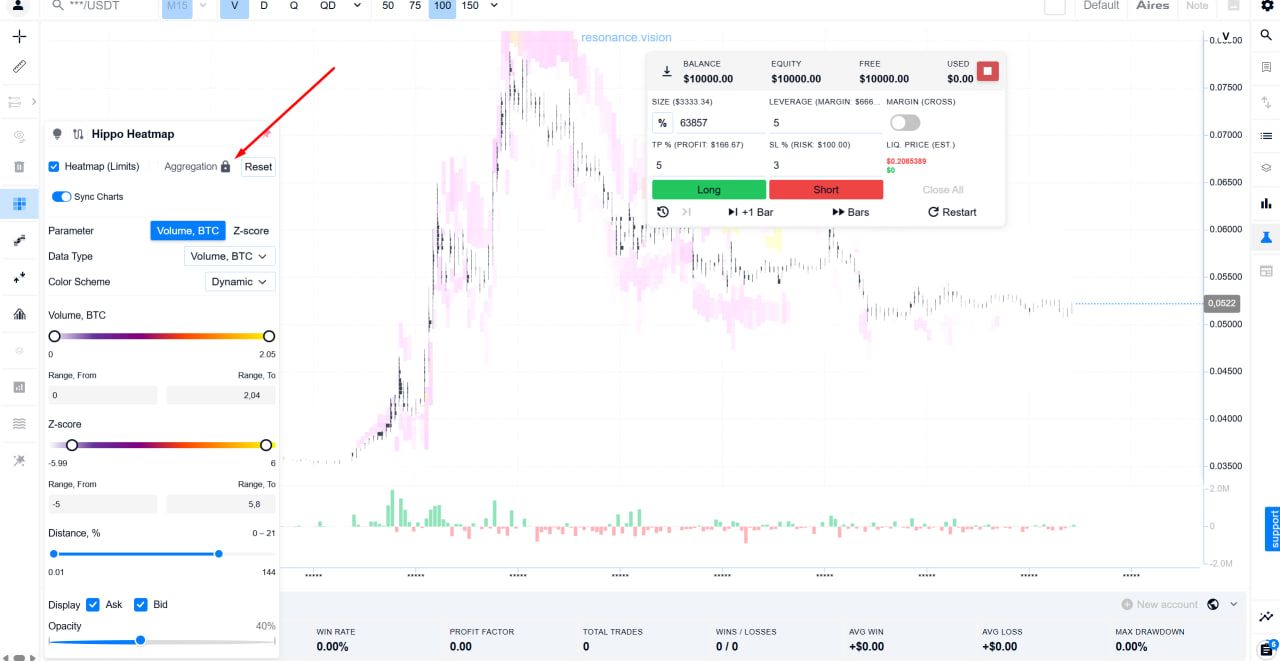
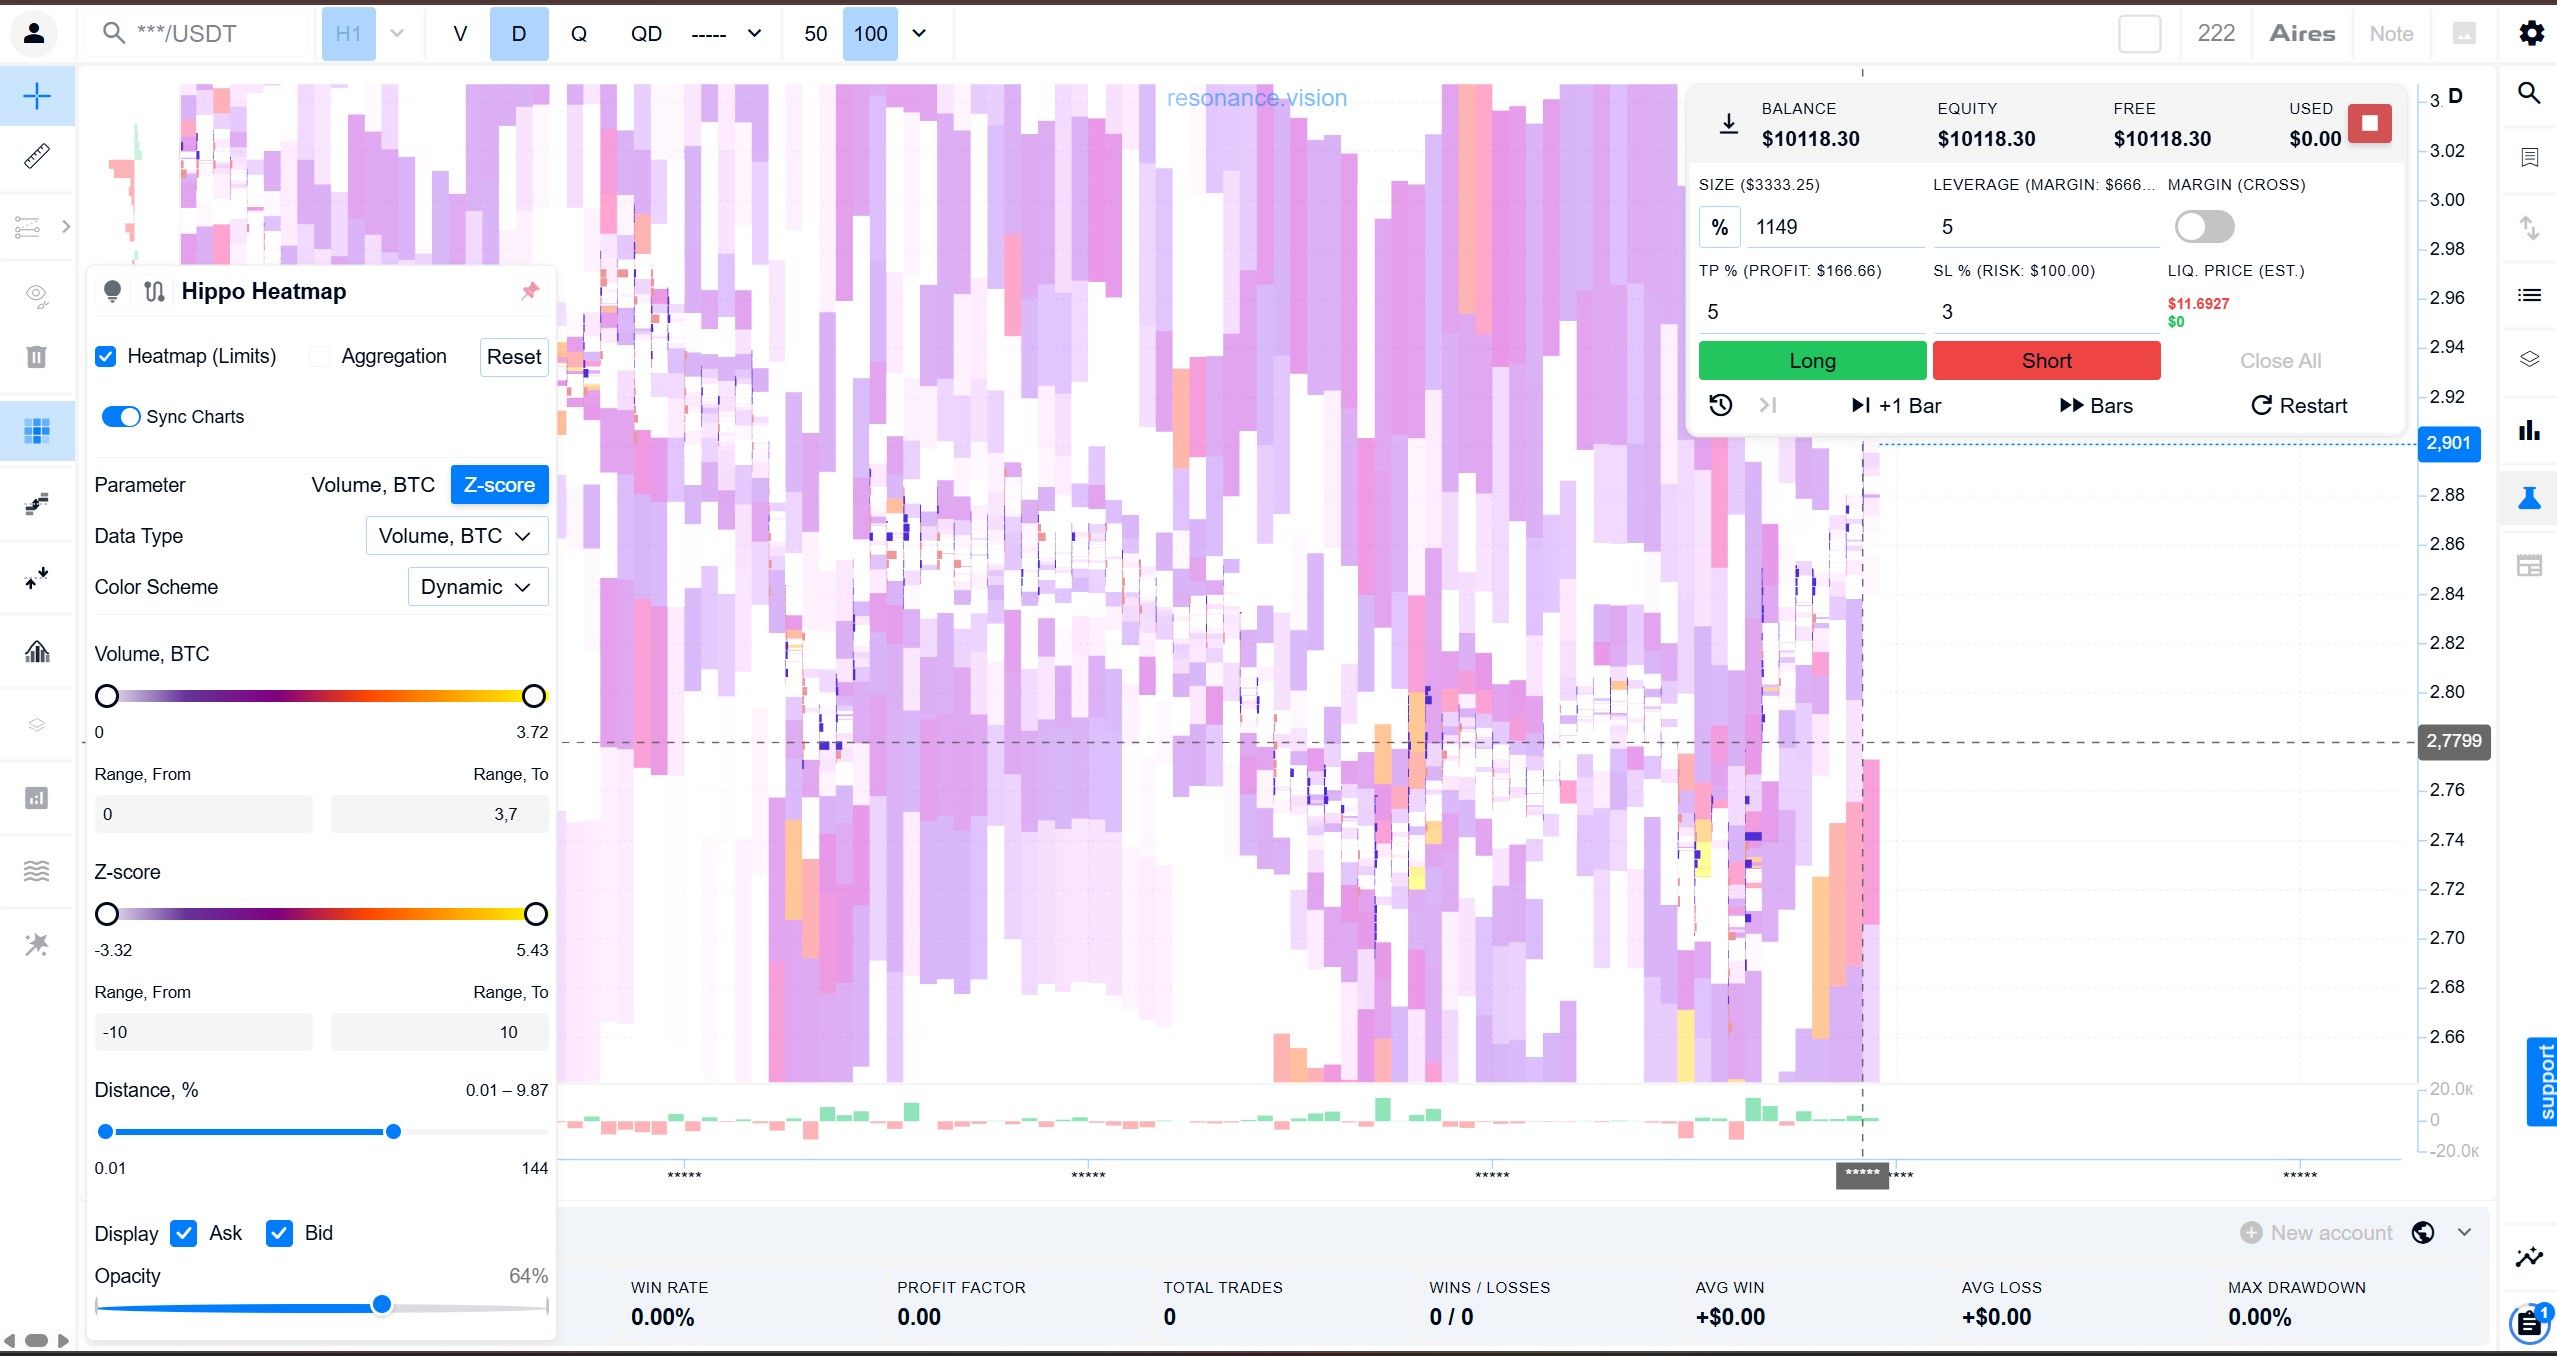
Heatmap (the Hippo Heatmap panel) displays limit-order volumes on the chart. In Simulator, you can view data for the current ticker. Simulator PRO also lets you enable aggregation — combined data across all tickers.
BAS (the Limit Volumes panel) shows the relationship between buy and sell limit-order volumes. In Simulator, BAS works without aggregation, while Simulator PRO also provides an aggregated mode.
In Simulator, the Aggregation switch in both panels is marked with a lock. This means the tool itself is available, but aggregation is not.
Aggregation provides broader market context. Instead of seeing data only for the current ticker, you can view a combined picture of the wider market.
Statistics
Current simulation statistics are available in both Simulator and Simulator PRO. They show the result of the current session only: Total PnL, ROI, Win Rate, Profit Factor, Total Trades, Wins/Losses, Avg Win, Avg Loss and Max Drawdown.
All-Time Statistics is available only in Simulator PRO. It combines the results of all completed random simulations on the active account, allowing you to evaluate performance over a longer period.
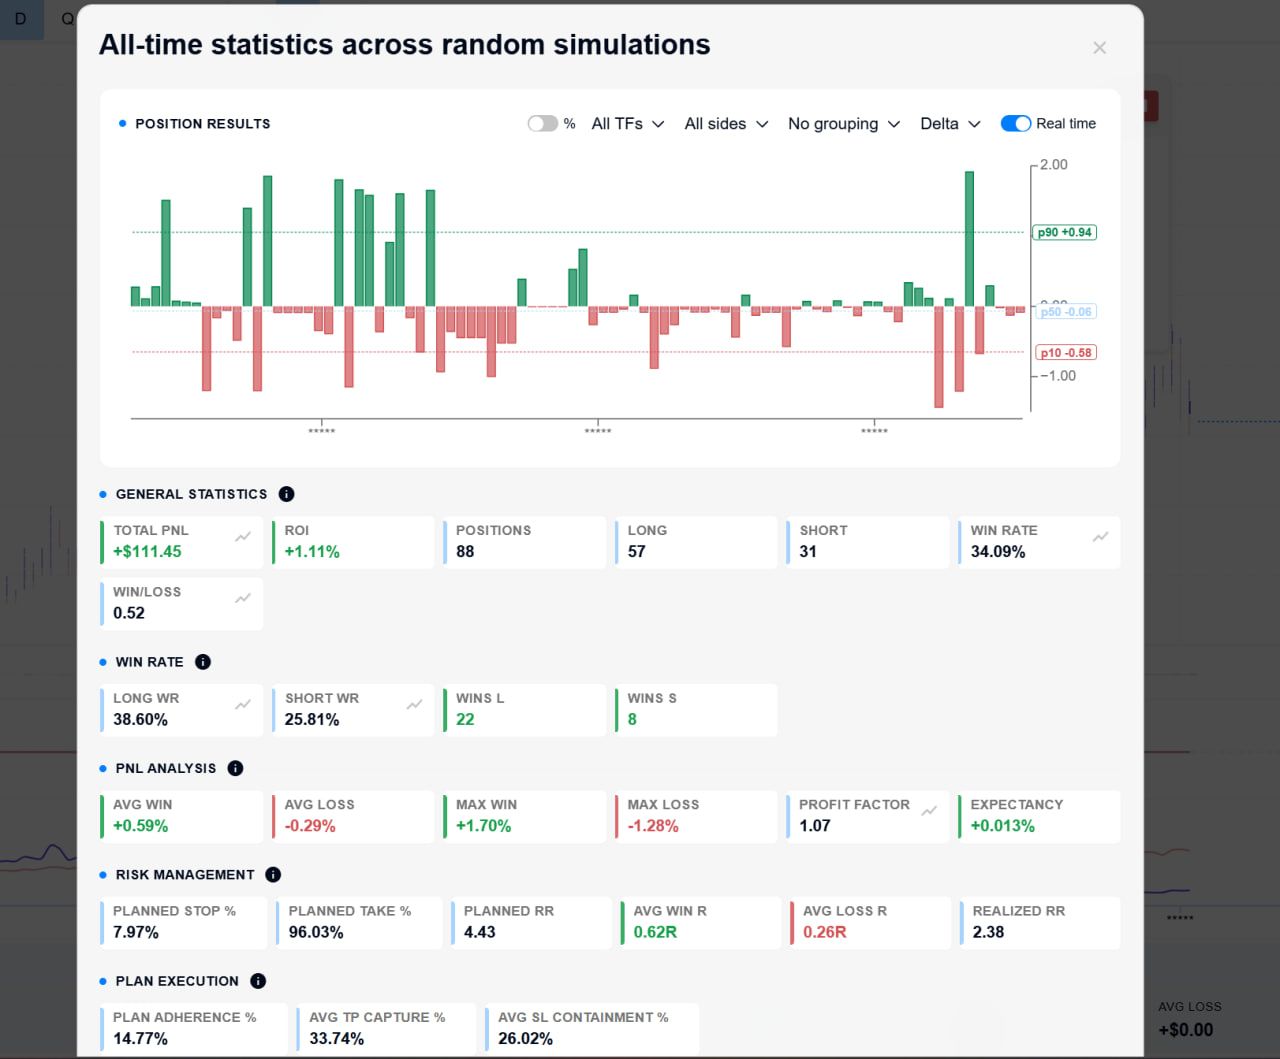
The All-Time Statistics window includes the following sections:
- Position Results — a histogram of position results with p10, p50 and p90 percentile lines. Results can be filtered by timeframe and trade direction, grouped, displayed using different metrics and shown as percentages.
- General Statistics — Total PnL, ROI, number of positions, Long and Short, Win Rate and Win/Loss.
- Win Rate — separate statistics for Long and Short, including the number of profitable trades in each direction.
- PnL Analysis — average and maximum profit and loss, Profit Factor and Expectancy.
- Risk Management — planned Stop Loss and Take Profit, planned and realised RR, and average profit and loss in R.
- Plan Execution — shows how closely you follow your trade plan and how much of the planned Take Profit and Stop Loss the position actually covers.
- Statuses — shows how positions were closed: by Take Profit, Stop Loss, manually, through liquidation or by time expiry (Expired), as well as how many positions remain open.
- Streaks — the longest winning and losing streaks, plus the current streak.
- Position Duration — position duration: median, p10 and p90, both overall and separately for Long and Short.
- Projected Returns Based on Current Statistics — models possible balance trajectories based on your current statistics and shows the median result after 500 trades.
- Play with the Metrics — sliders for Win Rate, Avg Win and Avg Loss. Adjusting these metrics shows how they affect the expected result per trade.
Unlike current simulation statistics, All-Time Statistics shows results over a longer period and helps you identify recurring patterns in your practice rather than judging performance based on a single simulation.
For a detailed explanation of all metrics, see How to Read Trading Simulator Statistics.
Why a PRO Feature May Be Unavailable Even After You Buy PRO
Analytical tools in random simulations have two independent access conditions: your plan and the simulation mode. A feature is available only when both conditions are met.
In random simulations, Trade State, Trade Trust and Aires Price Forecast are available only in Aires mode. In a standard Classic simulation, they are unavailable on any plan, including Simulator PRO.
What this looks like:
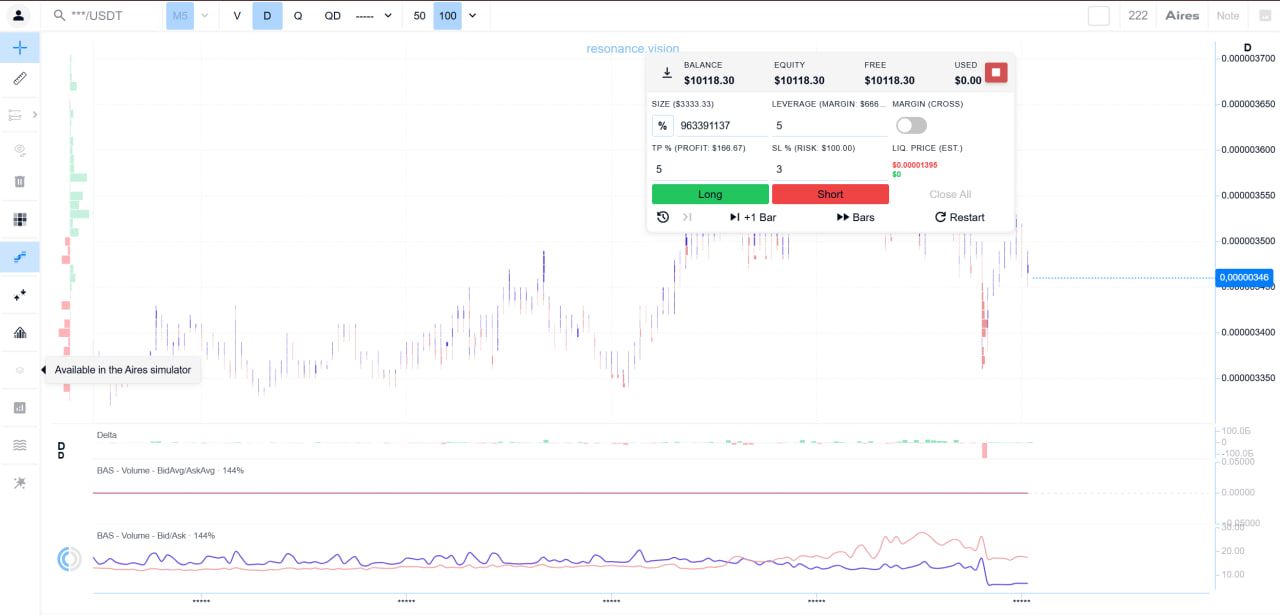
- the icons for these tools in the left-hand panel are greyed out and inactive;
- when you hover over them, the tooltip Available in the Aires simulator appears.
This is not a payment issue or a system error. Your Simulator PRO access is active, but the current simulation mode does not support these features. They cannot be enabled manually in Classic mode.
To use these tools, start a random simulation in Aires mode.
For more information about the differences between the modes and how to choose the right one, see Classic vs Aires: Random Simulation Modes.
Which Plan Should You Choose?
Choose based on what you want to practise and analyse.
Trading mechanics. Entries, exits, Stop Loss, Take Profit and leverage work the same way on both plans. Simulator is sufficient for this.
Market structure. If you are learning to identify ranges, trends and transitions between them, Simulator provides the structural component of Trade State in Aires mode.
Flow data. If you want to see the buying and selling flow accompanying a price move, you need Simulator PRO.
Aggregated data. If you want to view Heatmap and BAS not only for the current ticker but also as aggregated market-wide data, you need Simulator PRO.
Additional analytics. Trade Trust and Aires Price Forecast are available only in Simulator PRO and, in random simulations, work only in Aires mode.
Long-term statistics. If you want to analyse the results of all completed random simulations on the active account, you need Simulator PRO.
Simulator is sufficient if you need the trading mechanics, structural Trade State analytics and data for an individual ticker. Simulator PRO adds flow data, Trade Trust, Aires Price Forecast, Heatmap and BAS aggregation, and All-Time Statistics.
Where to Find the Current Plan Details
See the Plans page for current pricing, the number of launches included in each package and the full list of features available in Simulator and Simulator PRO.
Promo code TOPBLOG gives you a 10% discount on any Resonance tariff plan
Follow new insights in our Telegram channel.
There is no need to invent complex schemes or look for the "grail". Use the Resonance platform tools for market analysis and trading practice.
Trading Simulator is a tool for practising trading decisions and analysing simulation results in a simulated trading environment.
Register via the link and explore the Resonance platform:
OKX | BingX | KuCoin.
Recommended articles