Trading Simulator: Interface Tour
A step-by-step tour of the Trading Simulator interface, from launching and selecting a scenario to opening a position, working with bars, reviewing statistics and trade history, and completing the simulation.
Table of contents
- 01Trading Simulator: Interface Tour
- 021. How to Open Simulator
- 032. How to Choose a Scenario
- 043. Instructions for a Learning Scenario
- 054. The Control Panel
- 065. How to Open a Position
- 076. Open Positions
- 087. How to Move Forwards Through the History
- 098. Statistics During a Simulation
- 109. Closed Trade History
- 1110. Accounts and Balance
- 1211. Completing a Learning Scenario
- 1312. How to End a Random Simulation Manually
- 1413. How to Return to an Unfinished Simulation
Trading Simulator: Interface Tour
Trading Simulator opens directly from the Resonance cluster chart. After choosing a scenario, you move to the control panel, where you can configure a position, move forwards through historical bars, monitor your trading results and end the simulation.
This tour follows the full workflow: Simulator → choose a scenario → instructions → control panel → position → next bars → statistics → history → finish.
If you first want to understand the basic principles behind Simulator, see How Trading Simulator Works.
1. How to Open Simulator
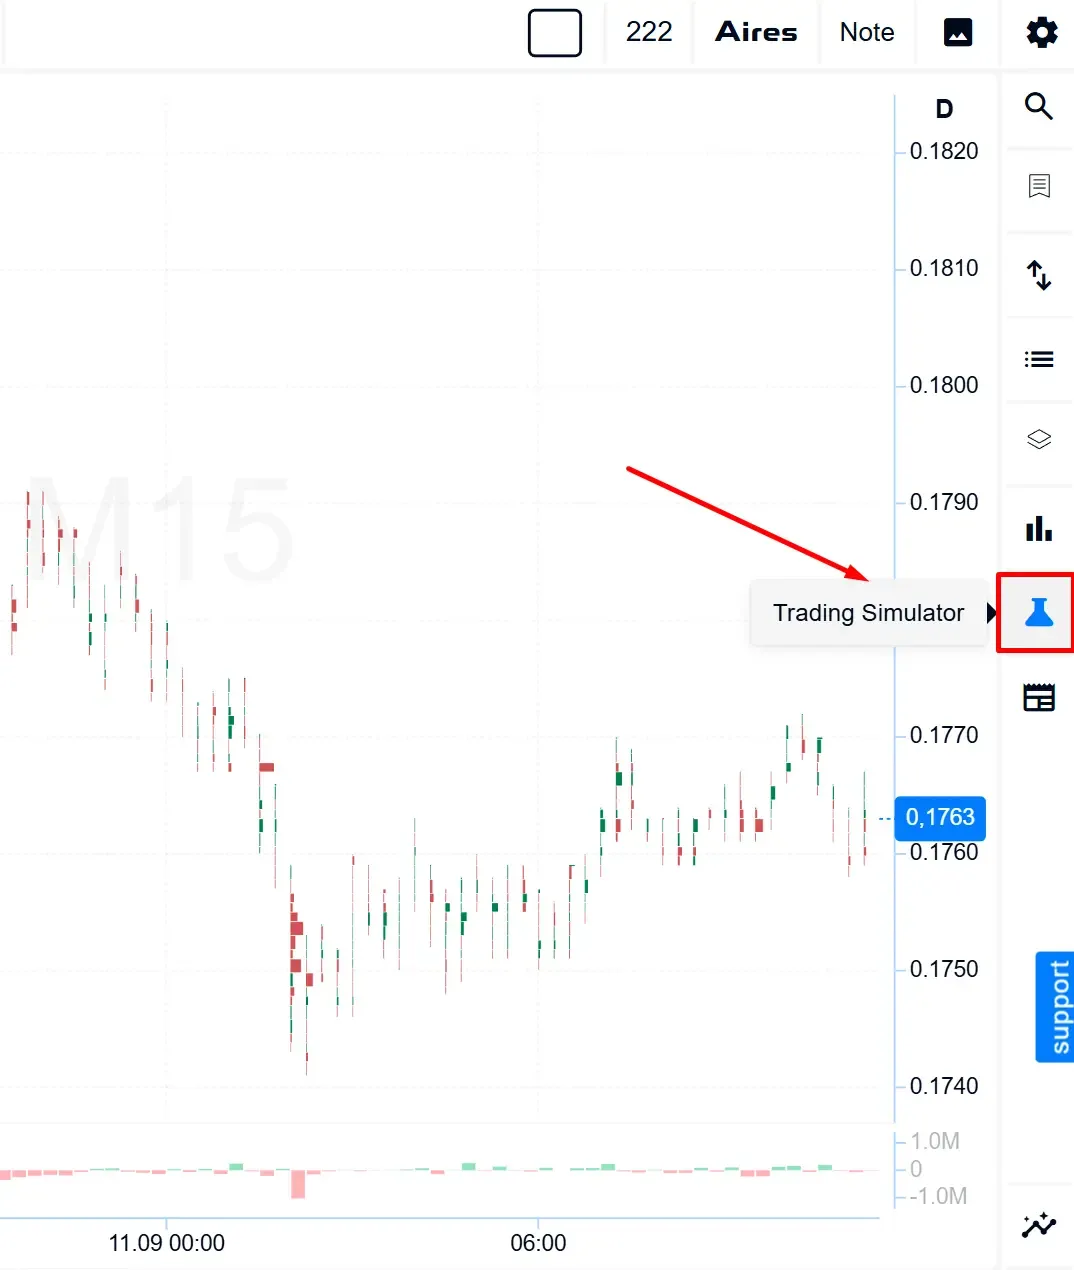
The entry point is the flask icon on the right-hand vertical panel of the cluster chart. Clicking it opens the Practice Examples side panel, which serves as the main Simulator menu.
2. How to Choose a Scenario
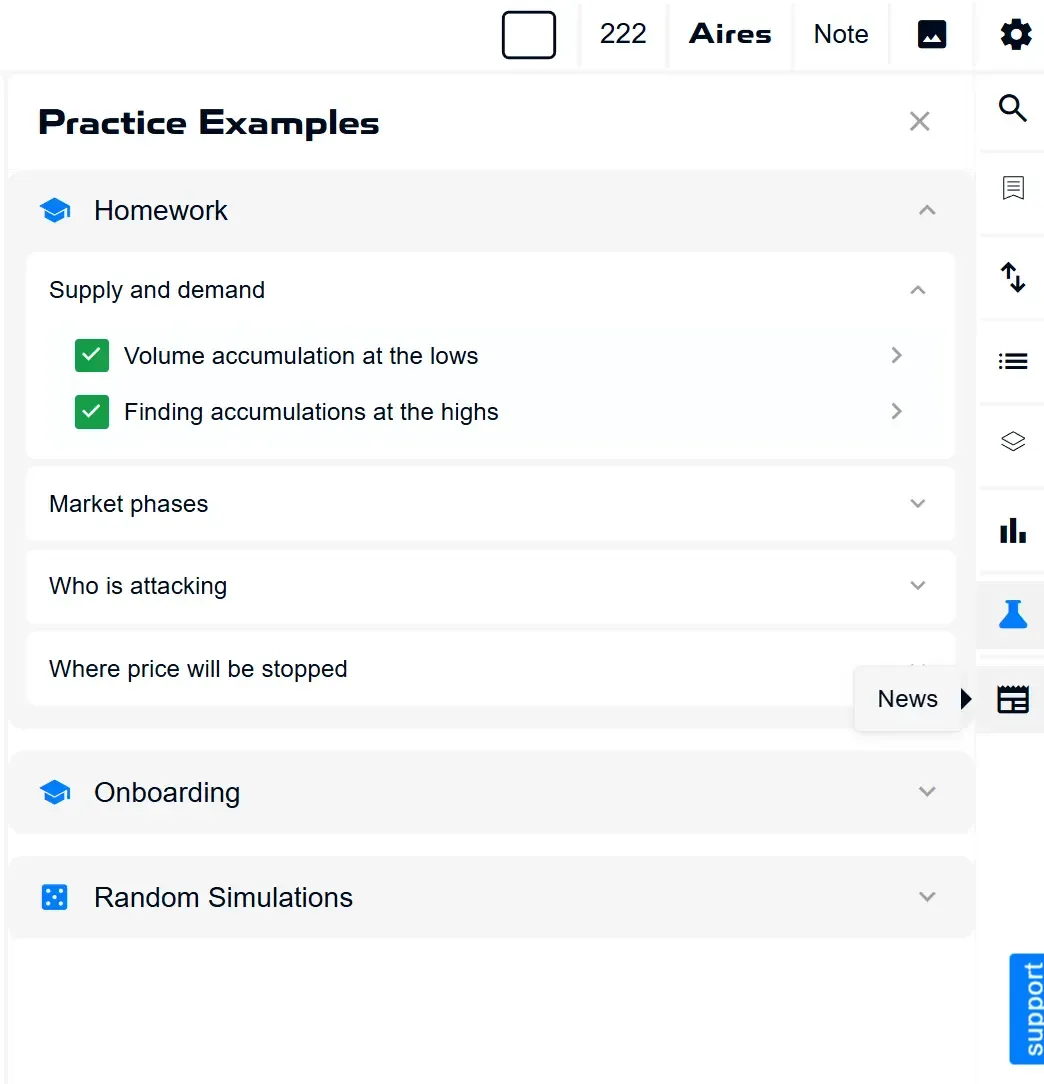
The panel contains three sections in a fixed order: Homework, Onboarding and Random Simulations. The order does not change, while completed examples within each section are marked with green ticks.
Homework assignments are grouped by topic. For example, Supply and Demand includes exercises such as Volume Accumulation at the Lows and Finding Accumulations at the Highs. Other topics include Market Phases, Who Is Attacking? and Where Will the Price Be Stopped?
Onboarding is a sequence of exercises completed step by step, ranging from Profit in the Accumulation Zone, Long Near a Large Bid Wall on the Heatmap and Intentional Stop Loss and Moving to Breakeven through to the final exercise, Complete Freedom: Trading Without Hints.
The Random Simulations section does not contain pre-prepared examples. It is intended for independent practice. You can start one by selecting Random Simulation or Random Simulation (Aires). The difference between them is explained in Classic and Aires in Trading Simulator: What’s the Difference?
3. Instructions for a Learning Scenario
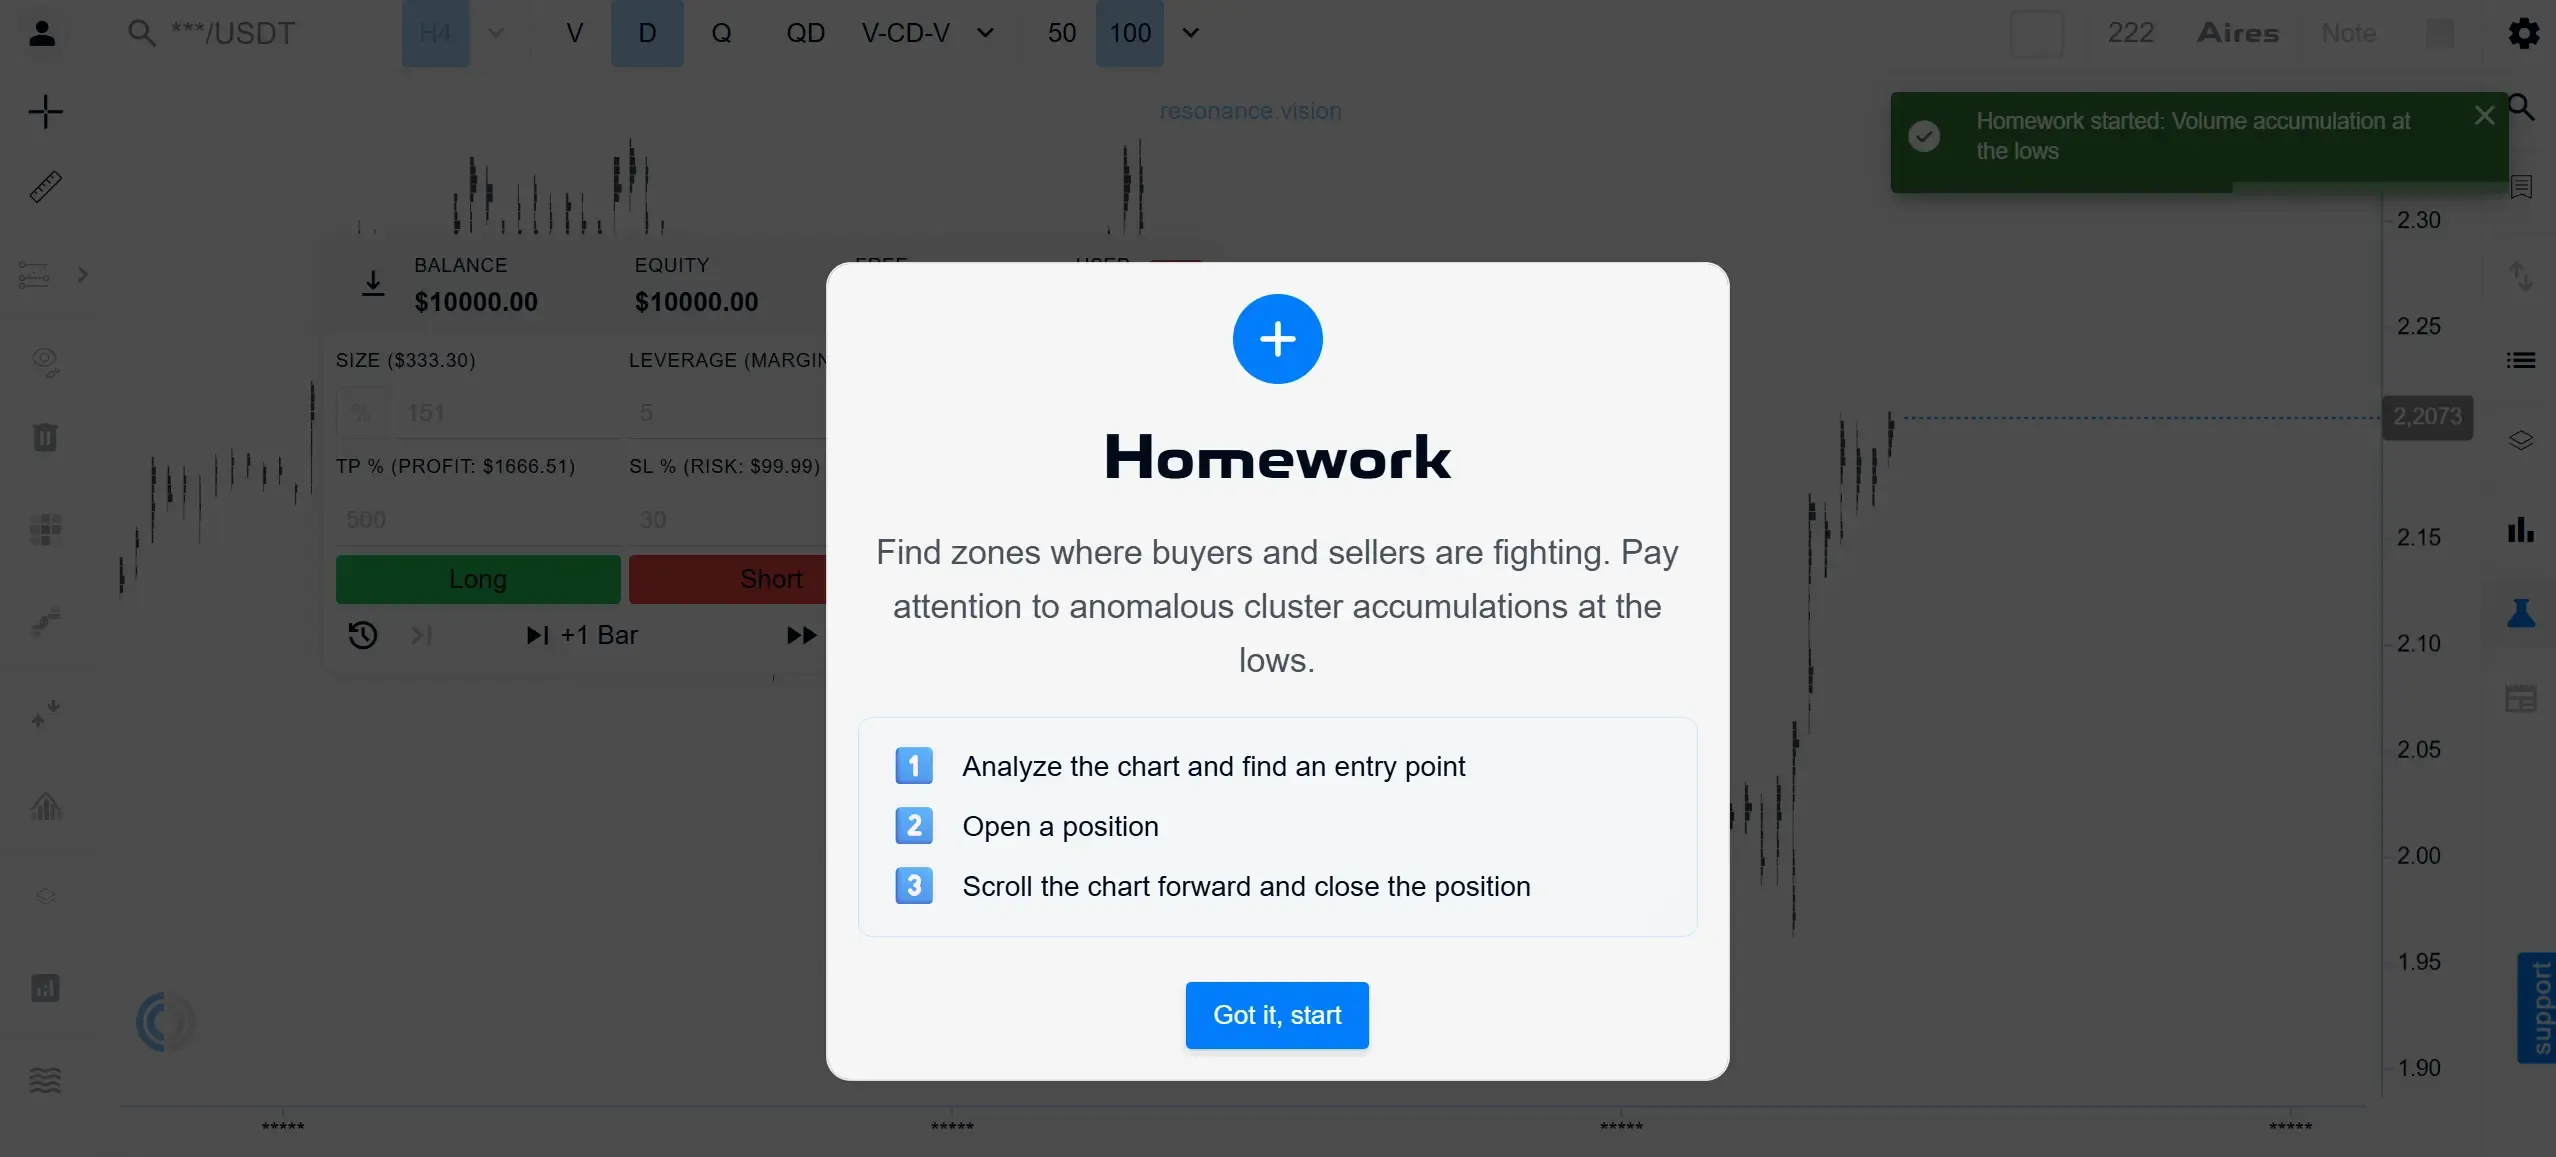
As soon as you select a specific learning example, a modal window appears with the objective of the exercise and a numbered list of actions.
This usually consists of three steps: analyse the chart and find an entry point, open a position, then move the chart forwards and close the position.
The button at the bottom closes the instructions and opens the control panel immediately, often with parameters already preset for that particular exercise.
Random Simulations do not include these step-by-step instructions. Instead, you move directly to the control panel.
4. The Control Panel
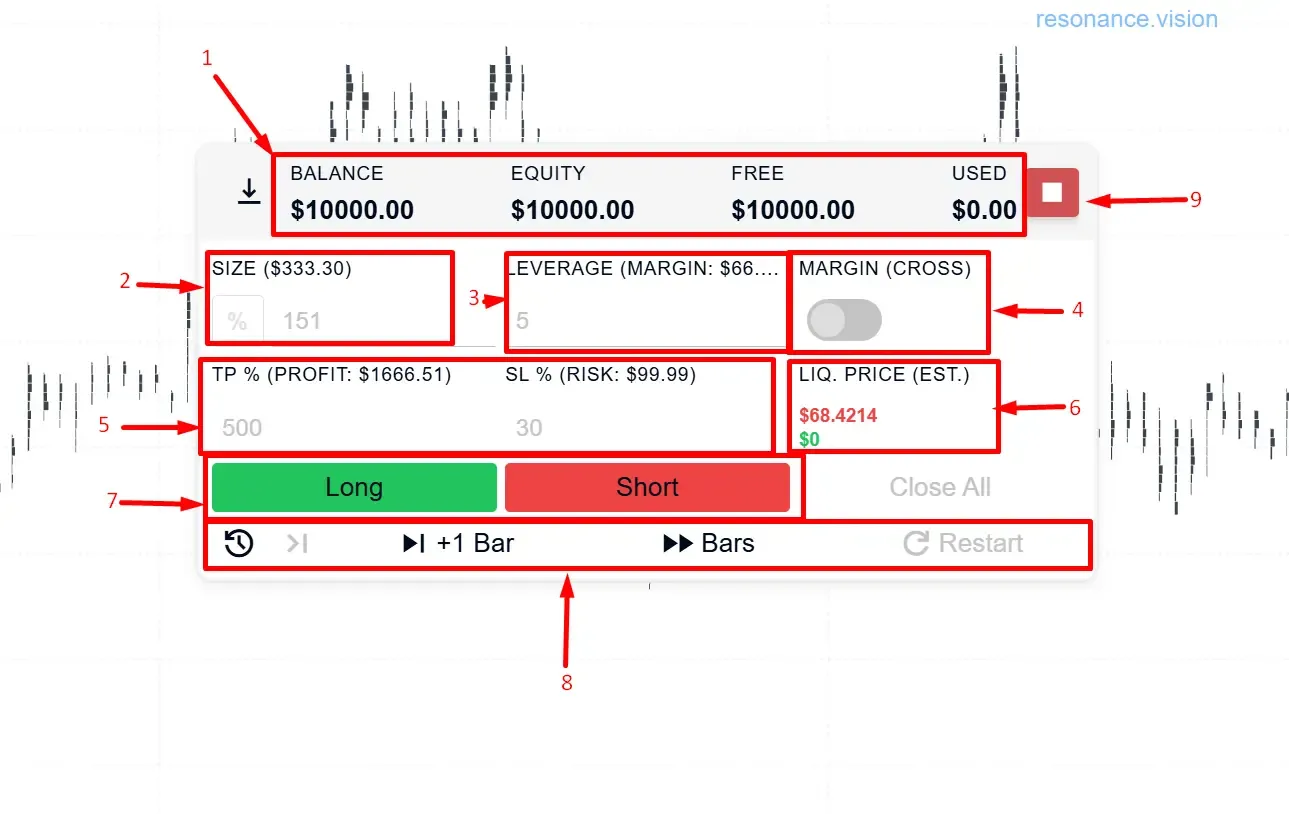
The control panel appears over the chart as soon as the scenario starts:
- Balance, Equity, Free, Used — the current state of the virtual account.
- Size — the position size, set either as a percentage of the balance or manually in dollars.
- Leverage — the leverage multiplier, which is immediately converted into the corresponding margin amount.
- Margin (Cross) — the margin mode switch.
- TP % and SL % — Take Profit and Stop Loss levels, with the corresponding profit or loss automatically calculated in dollars.
- Liquidation Price (est.) — the estimated liquidation price.
- Long / Short — buttons for opening a position.
- Close All — available only when there are open positions.
- Navigation controls — the history icon, +1 Bar, ▶▶ Bars and Restart.
- Red square button next to Balance — force-stops the simulation.
5. How to Open a Position
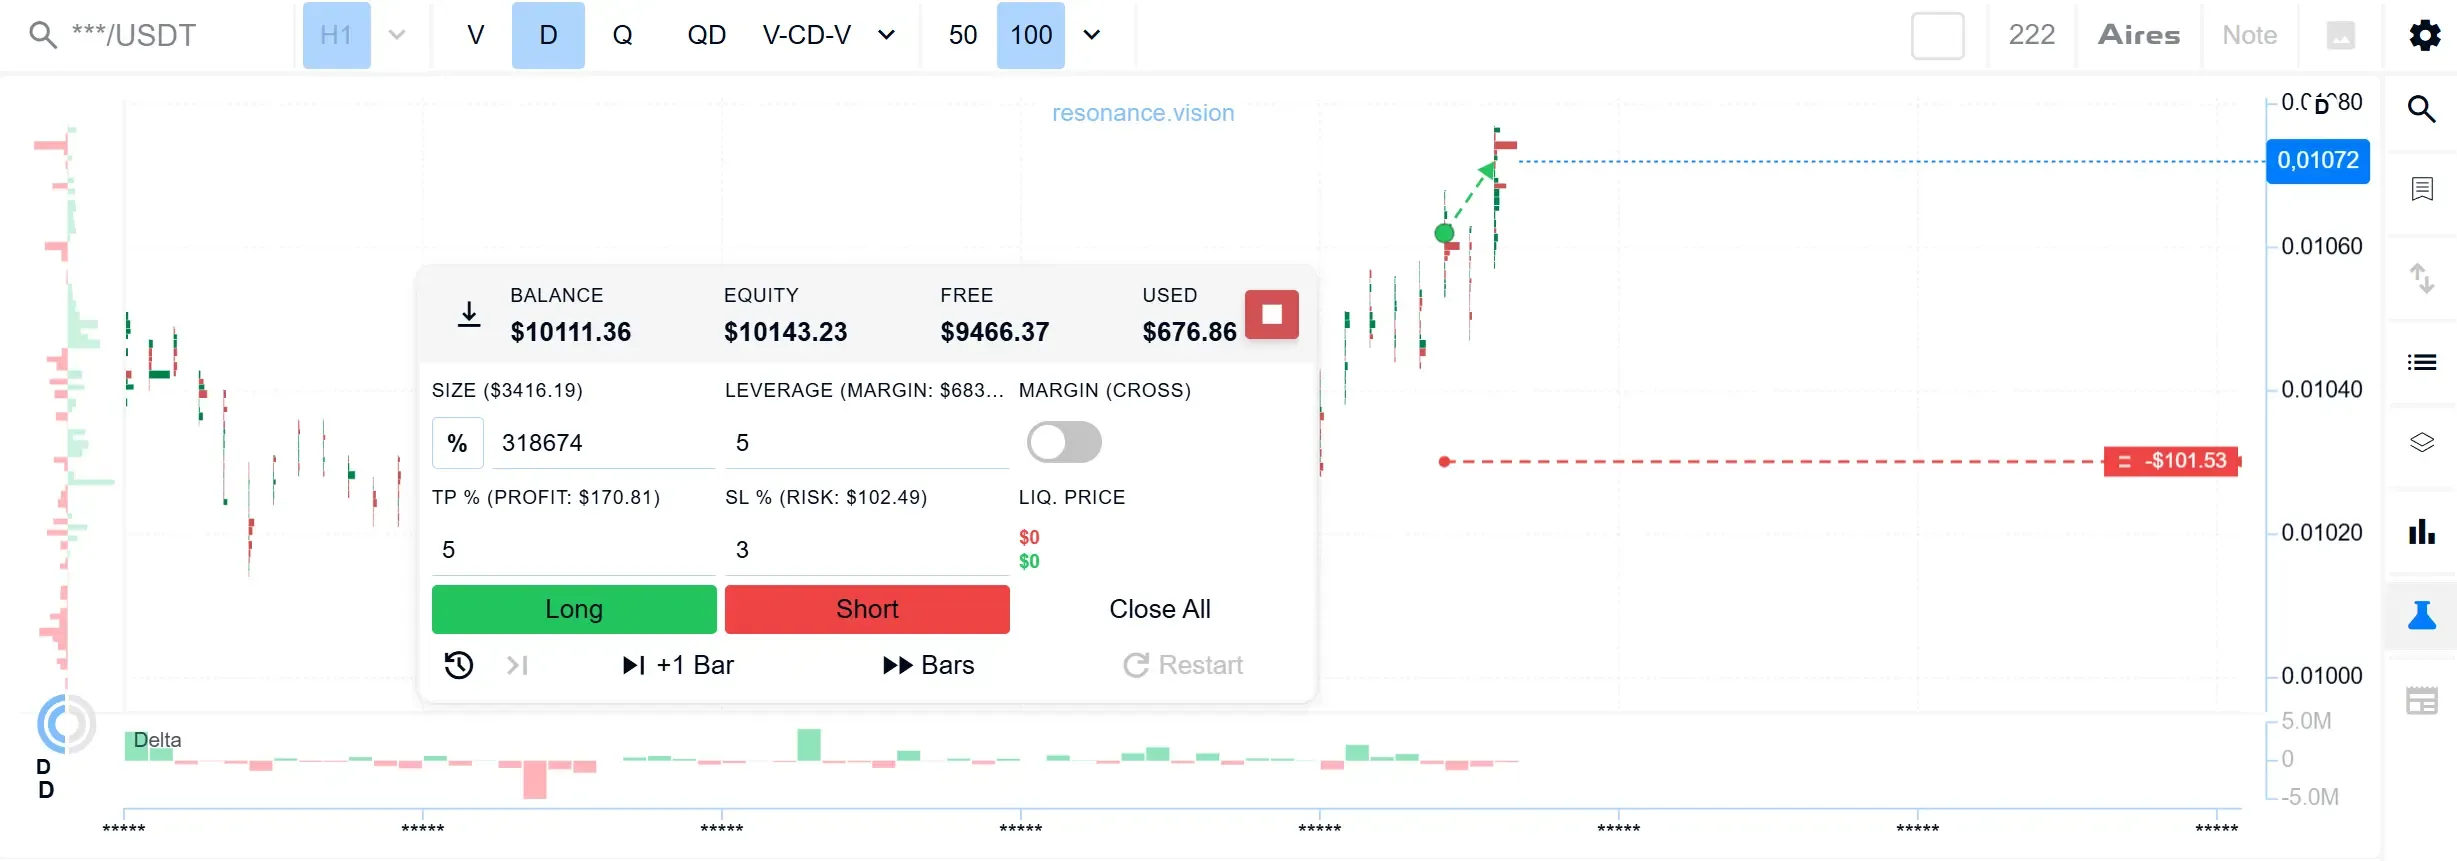
After you select Long or Short, the position opens at the current simulated price.
An entry marker and two dotted lines appear on the chart extending to the right. The green line represents the Take Profit level and shows the calculated profit, while the red line represents the Stop Loss level and shows the calculated loss.
6. Open Positions
A table of open positions appears below the chart. It shows the position type (Long/Short), size, leverage, entry price, holding time, current simulated price, SL and TP levels, liquidation price, and current PnL in both dollars and percentages.
Each row includes a close button for exiting the position manually.
7. How to Move Forwards Through the History
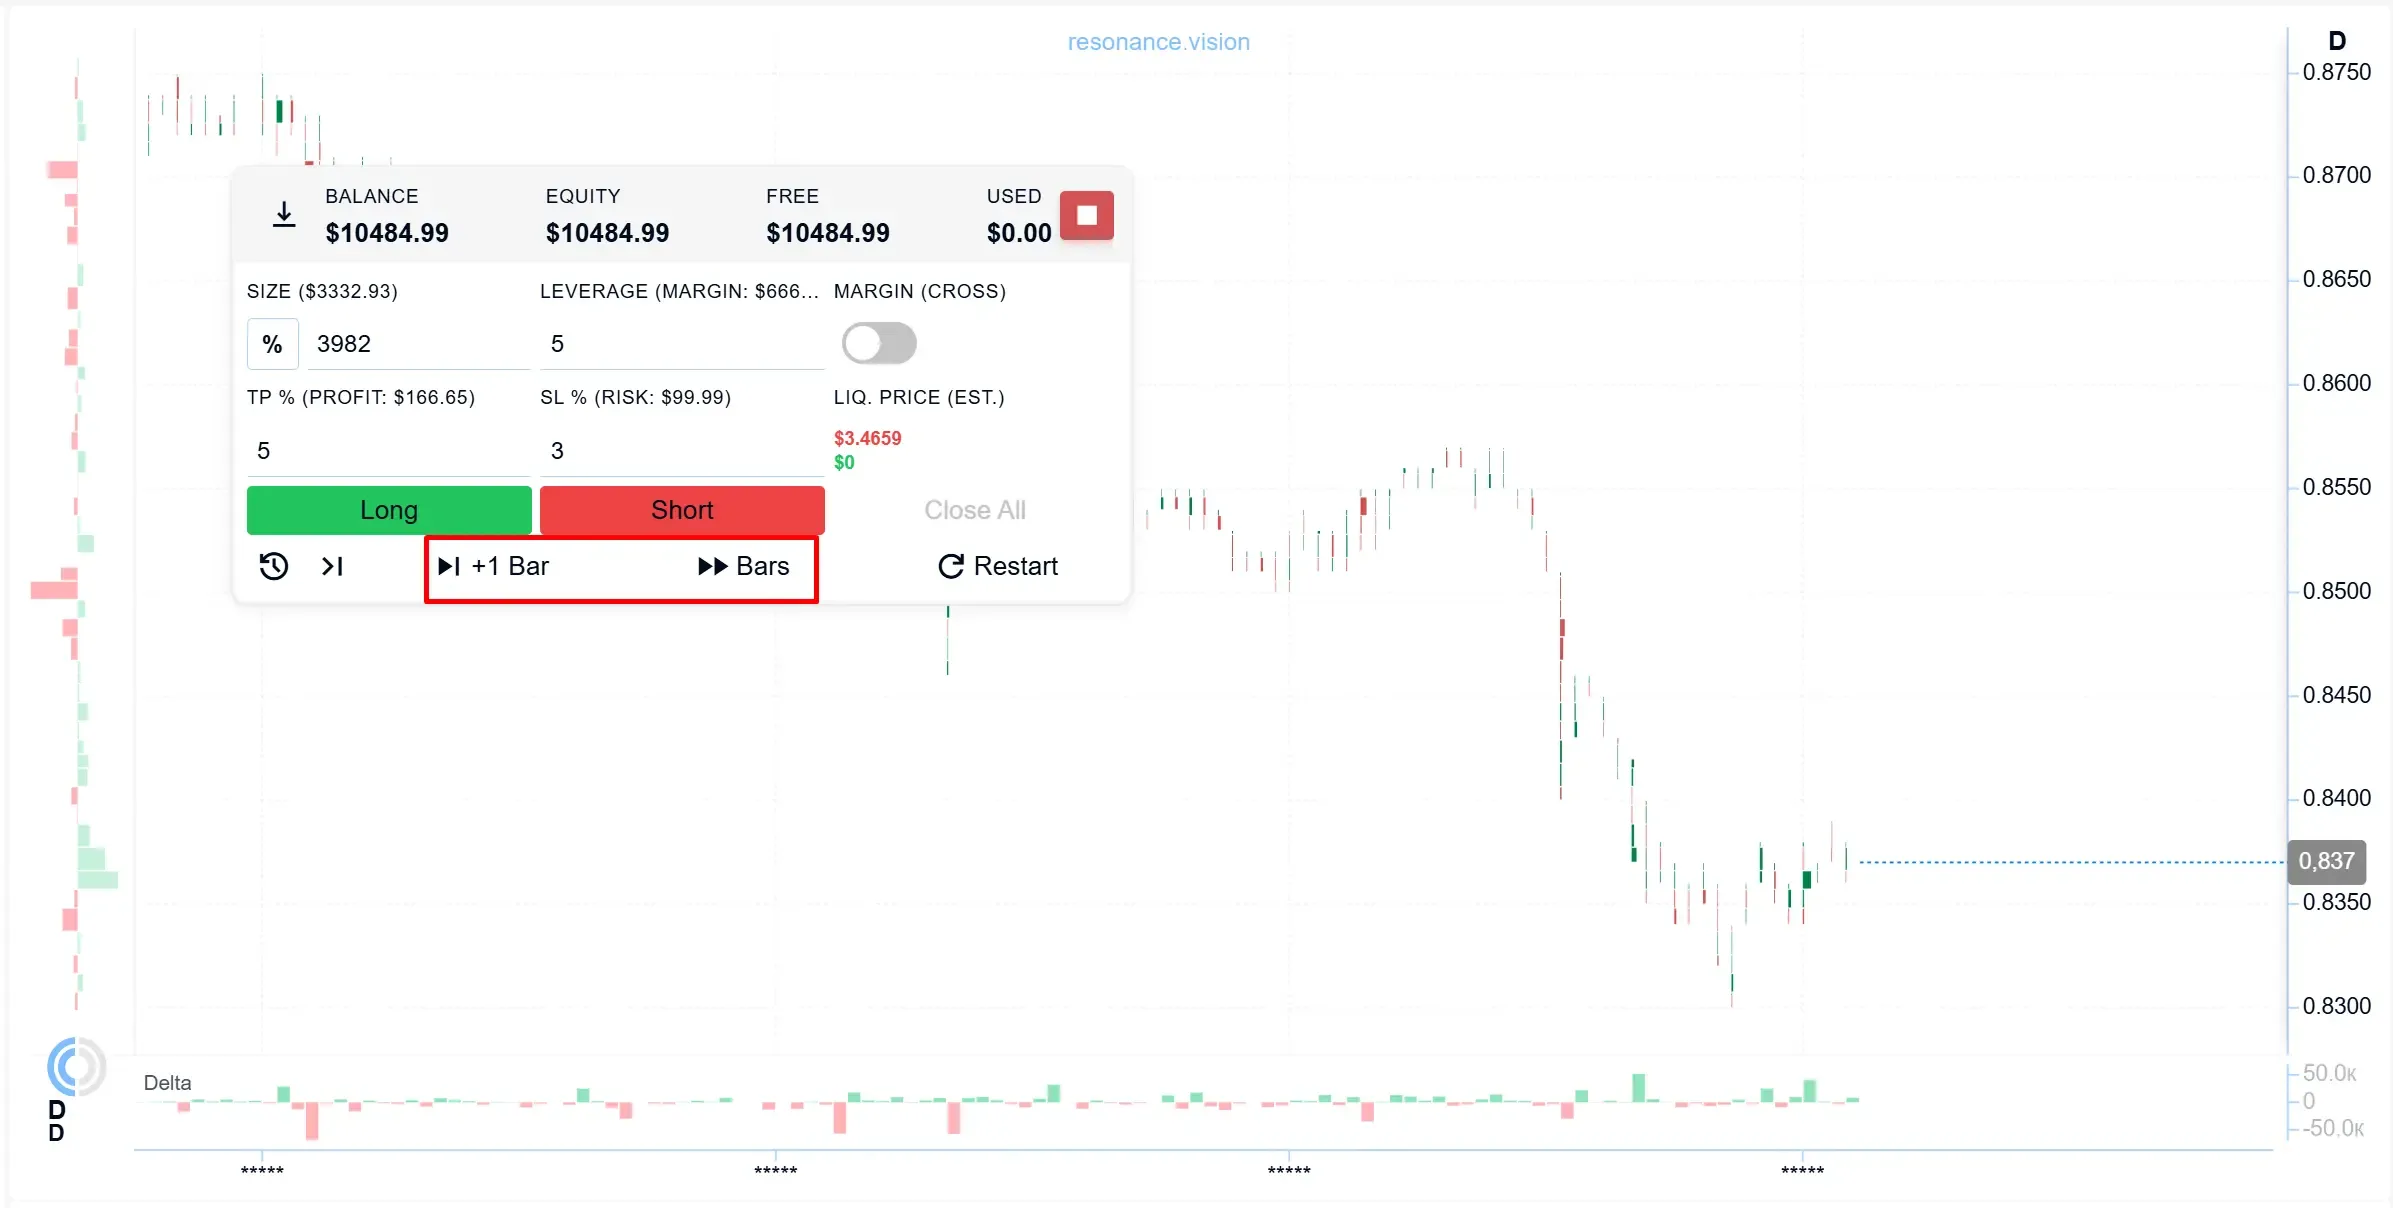
The left and right arrow keys and the space bar can be used to move through historical bars that are already available on the chart.
Once a position has been opened, however, moving the simulation itself forwards — in other words, revealing the next “future” bar — is done only through +1 Bar and ▶▶ Bars.
+1 Bar reveals one new bar, while ▶▶ Bars automatically plays a sequence of subsequent bars. The keyboard does not move the simulation itself forwards.
8. Statistics During a Simulation
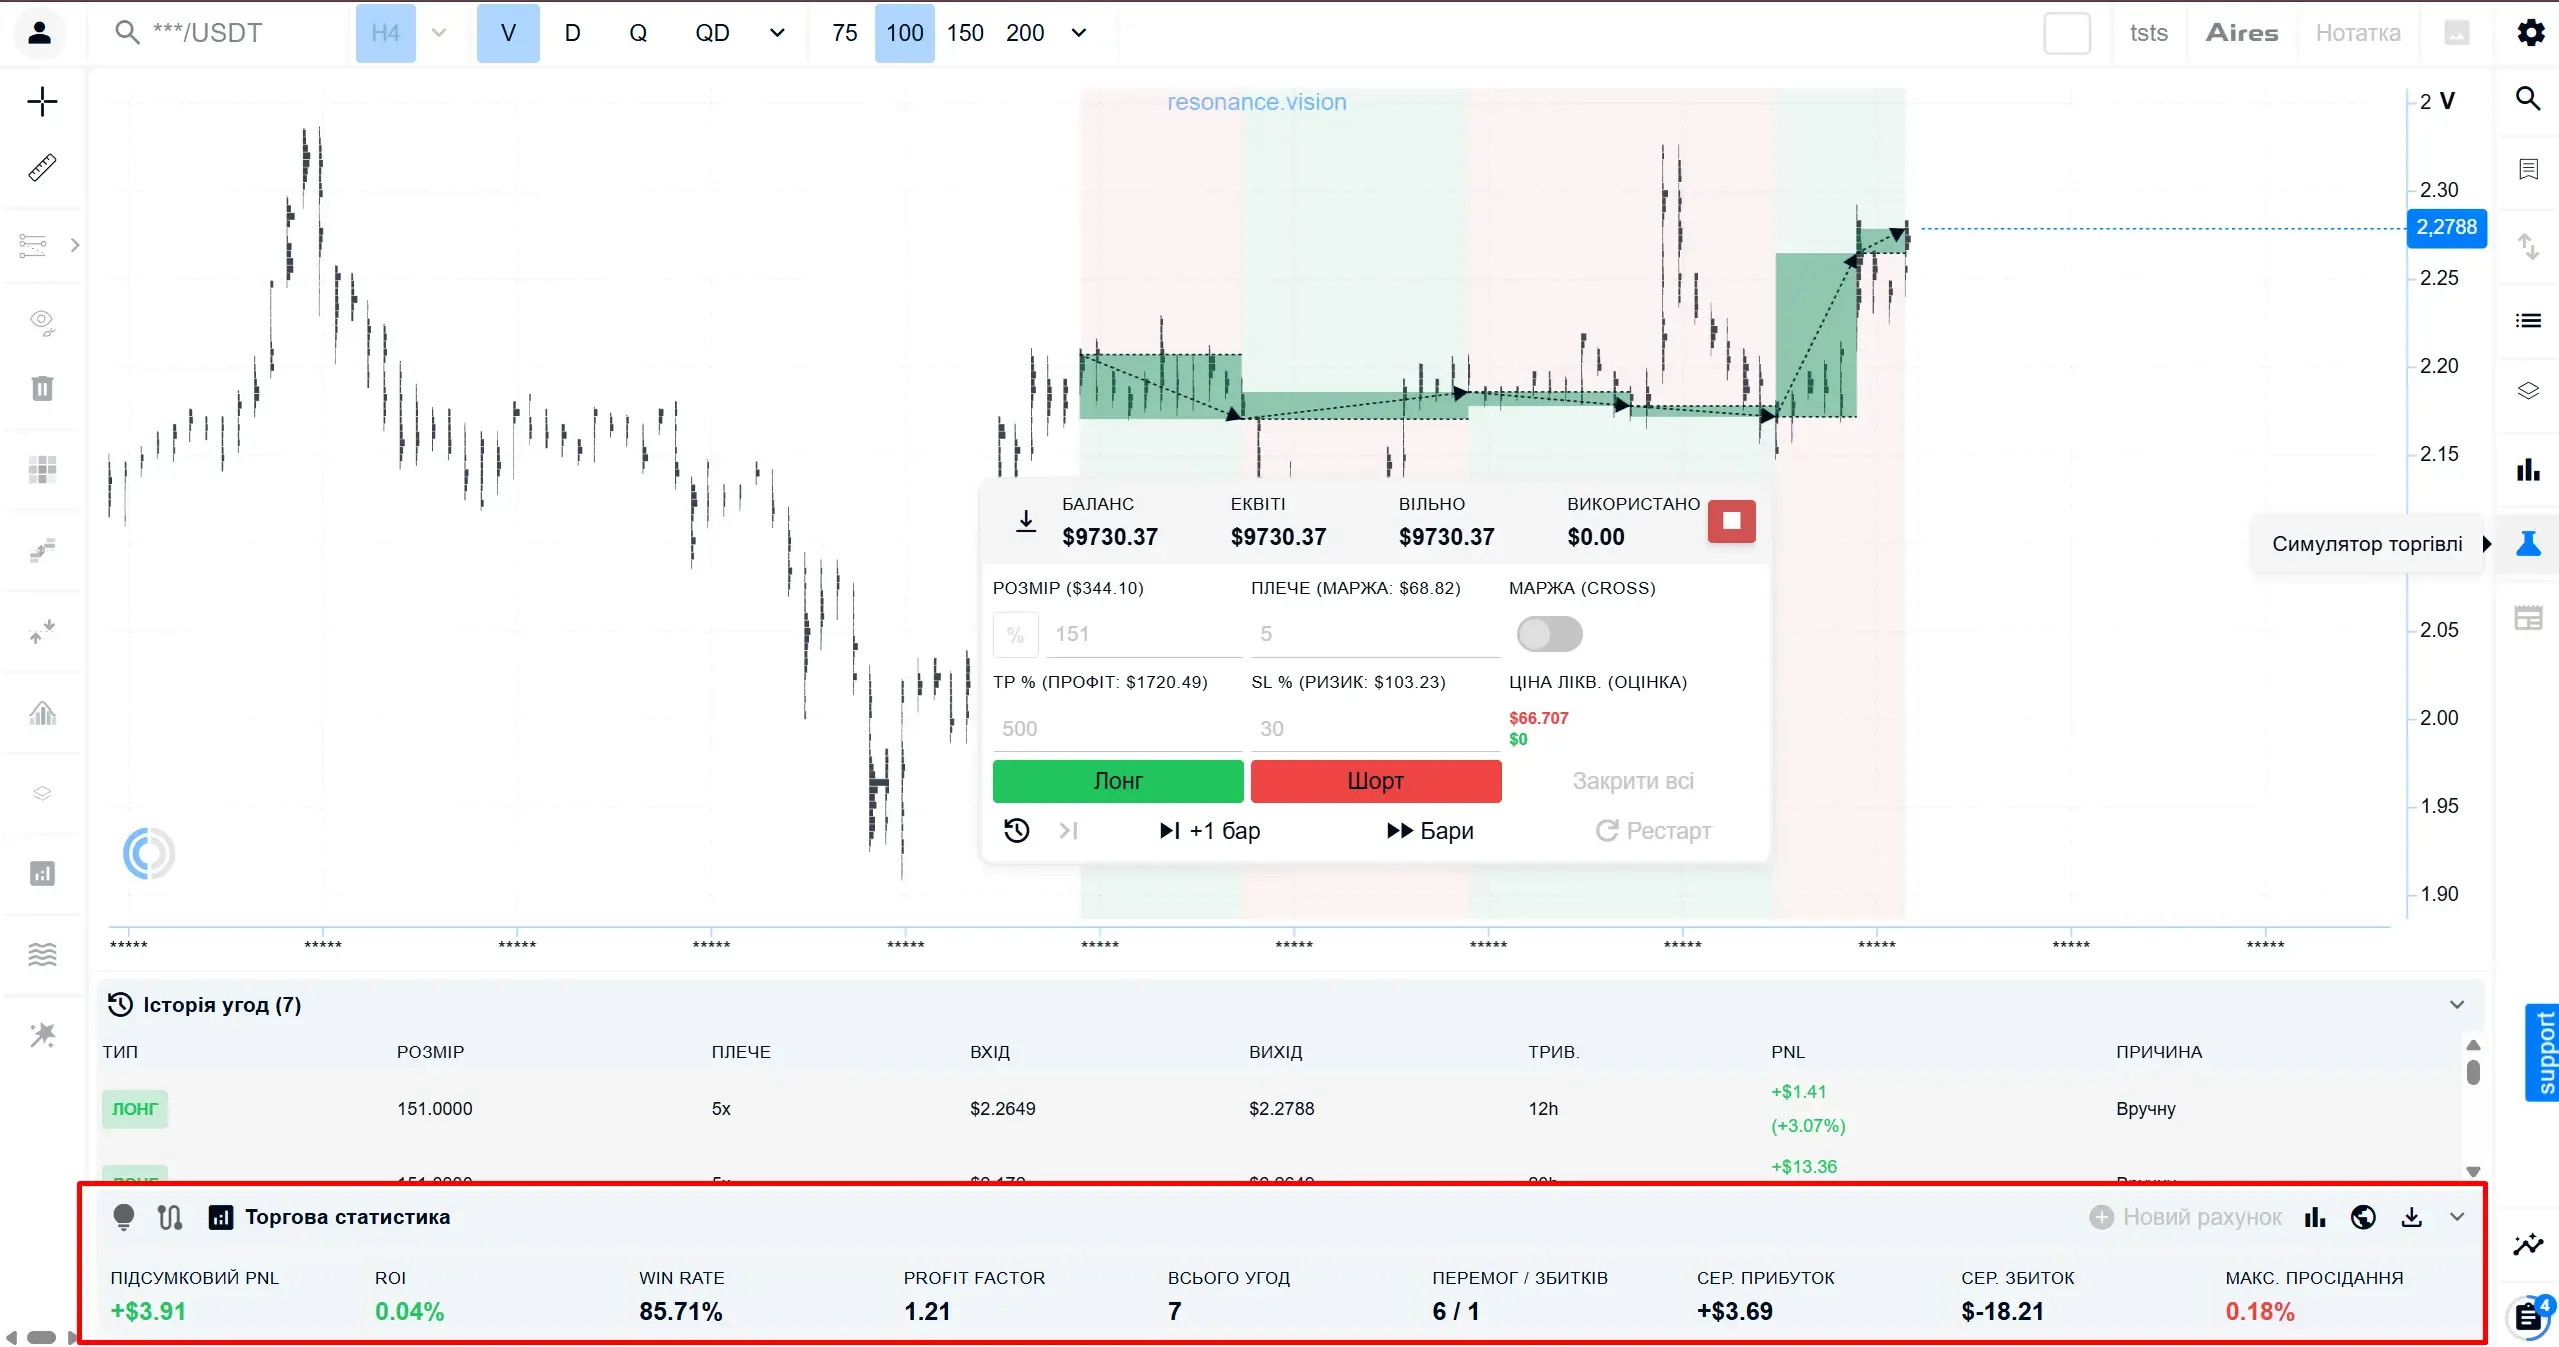
The trading statistics panel is located at the bottom of the screen. When collapsed, it displays the overall PnL and ROI for the current session.
Expanding it opens a more detailed table with additional metrics, including Win Rate, Profit Factor, number of trades, average profit and loss, and maximum drawdown.
For a detailed explanation of these metrics, see How to Read Trading Simulator Statistics.
9. Closed Trade History
The trade history table is located above the statistics panel. It shows the trade type, size, leverage, entry and exit prices, holding time, result in dollars and percentages, and the reason for closing — either manually or because SL/TP was triggered.
This table allows you to review not only the overall figures but also the specific sequence of trading decisions made during the simulation.

10. Accounts and Balance
The New Account button in the statistics panel is disabled by default. It becomes available when the virtual balance falls by 50% from its starting level or reaches $100 or less.
This acts as a safeguard after a series of losing trades rather than as an option to reset the balance at any time.

11. Completing a Learning Scenario
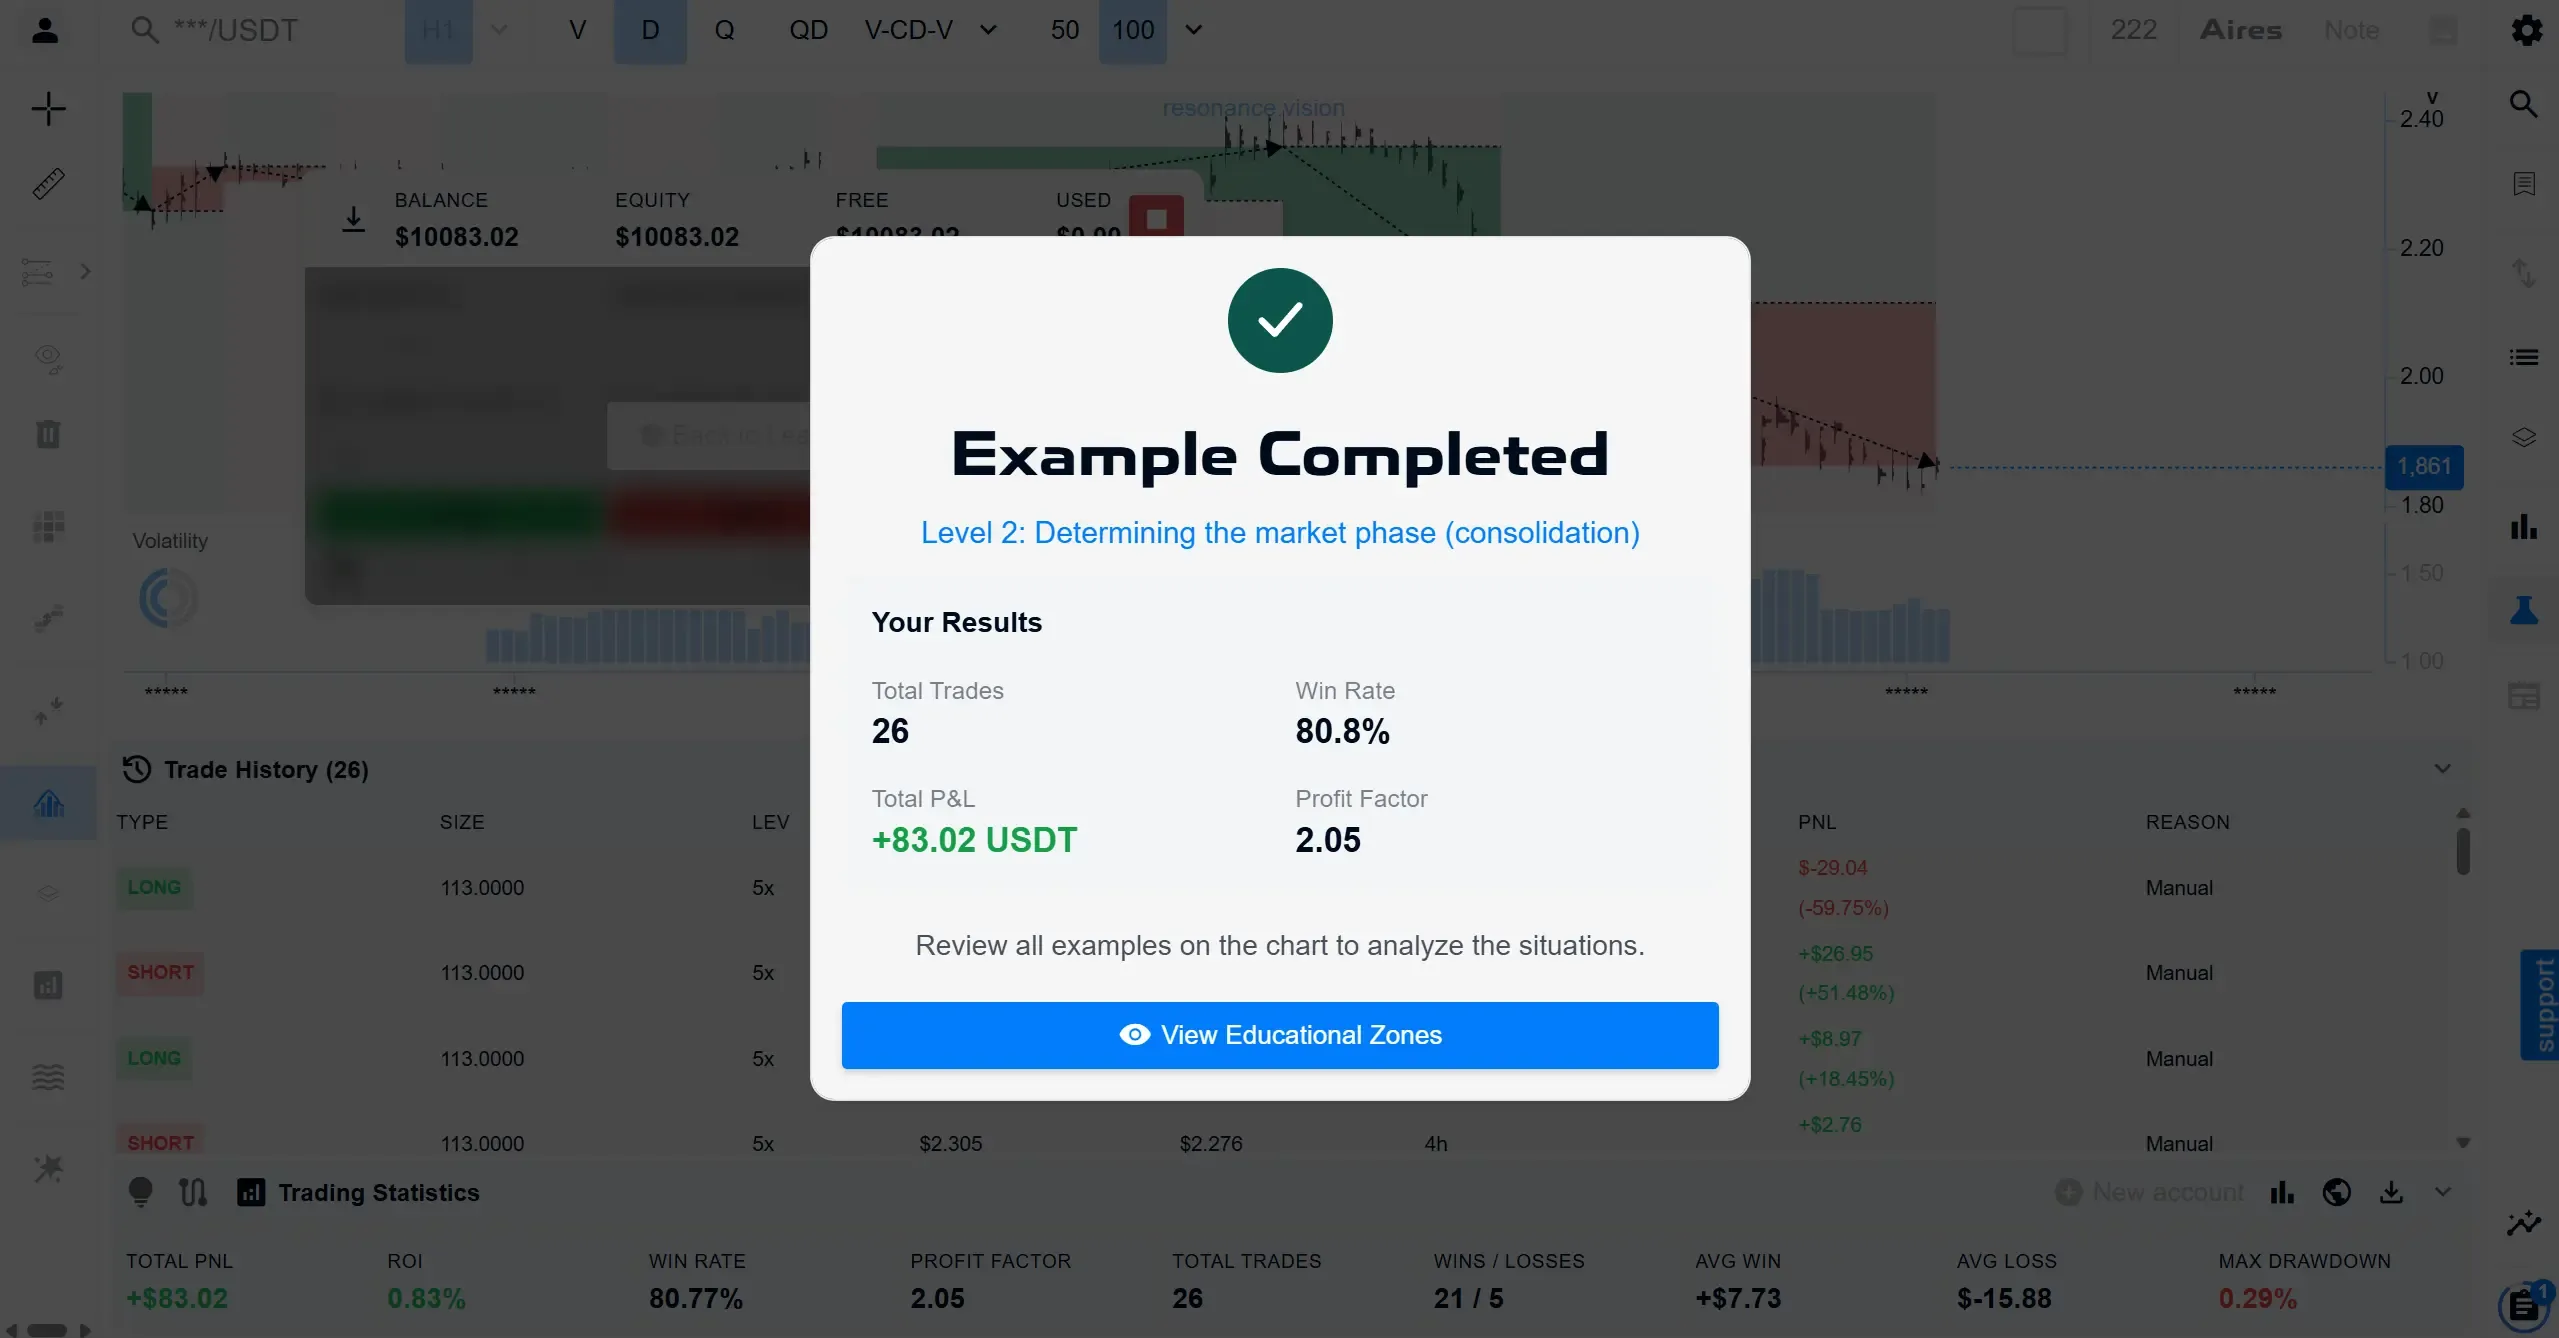
Once the conditions of the exercise have been met, a modal window appears showing the level name and the results for that specific example, including the number of trades, Win Rate, total P&L and Profit Factor.
The same window includes a button for viewing the educational zones on the chart.
After the window is closed, the highlighted zones remain visible on the chart, showing where the learning situation occurred. This allows you to compare your own decision with the situation the exercise was designed to illustrate.
12. How to End a Random Simulation Manually
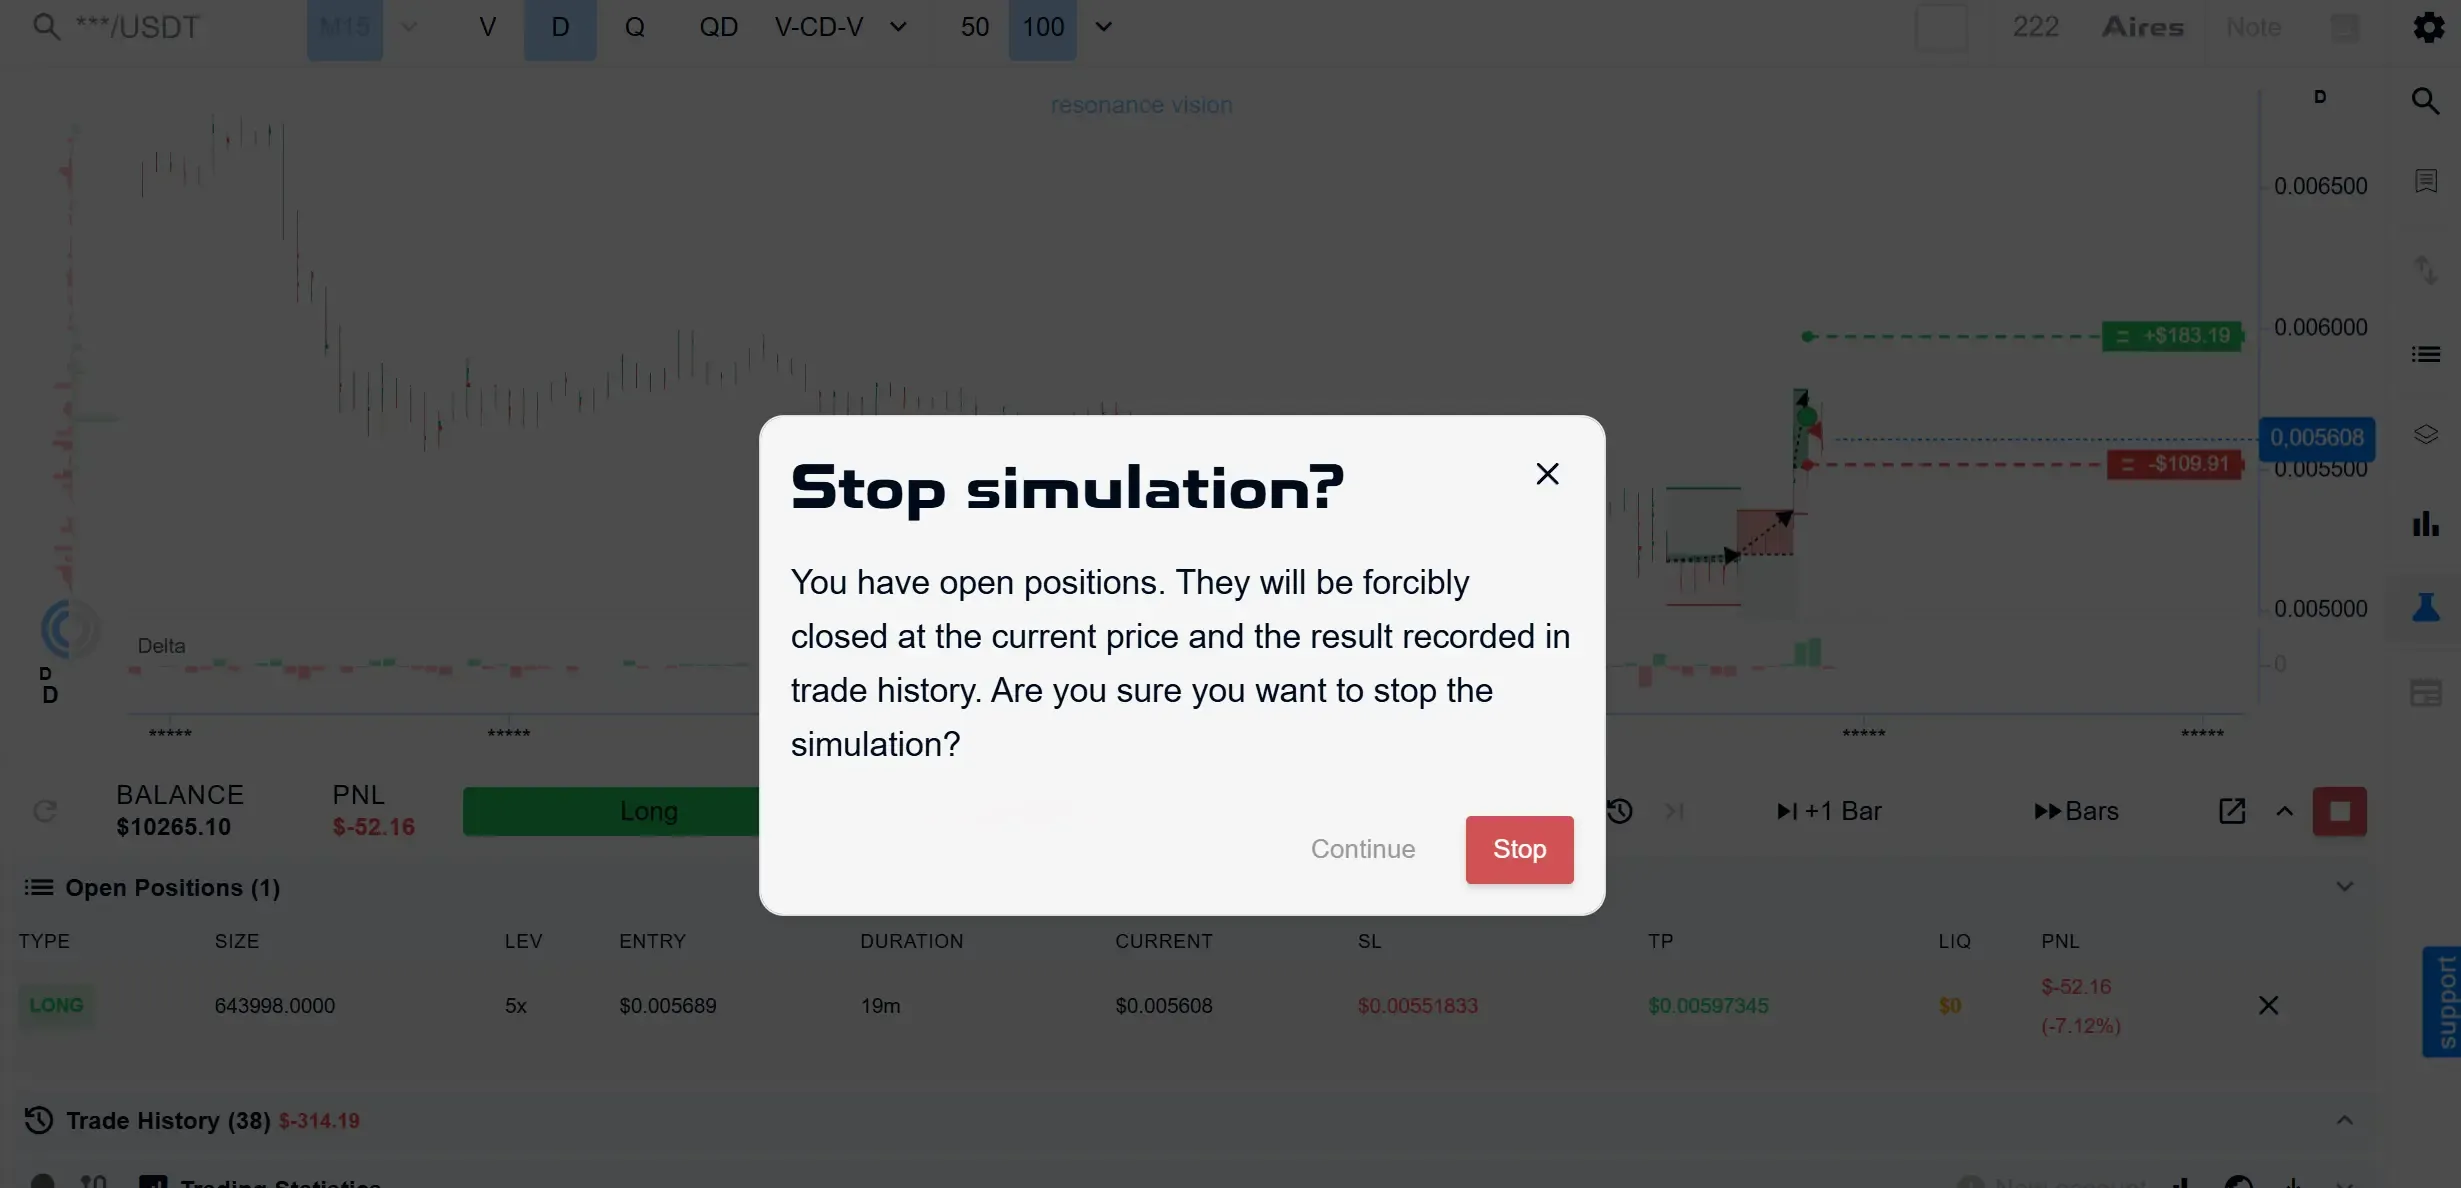
The red square button next to Balance opens the Stop Simulation? confirmation window.
If there are open positions, the system warns that they will be force-closed at the current simulated price and that the result will be recorded in the trade history.
You can confirm by selecting Stop, or cancel the action and return to the simulation by selecting Continue.
This is separate from Restart, which immediately starts a new simulation from scratch.
13. How to Return to an Unfinished Simulation
Simulator does not provide a separate function for restoring a completed or interrupted simulation.
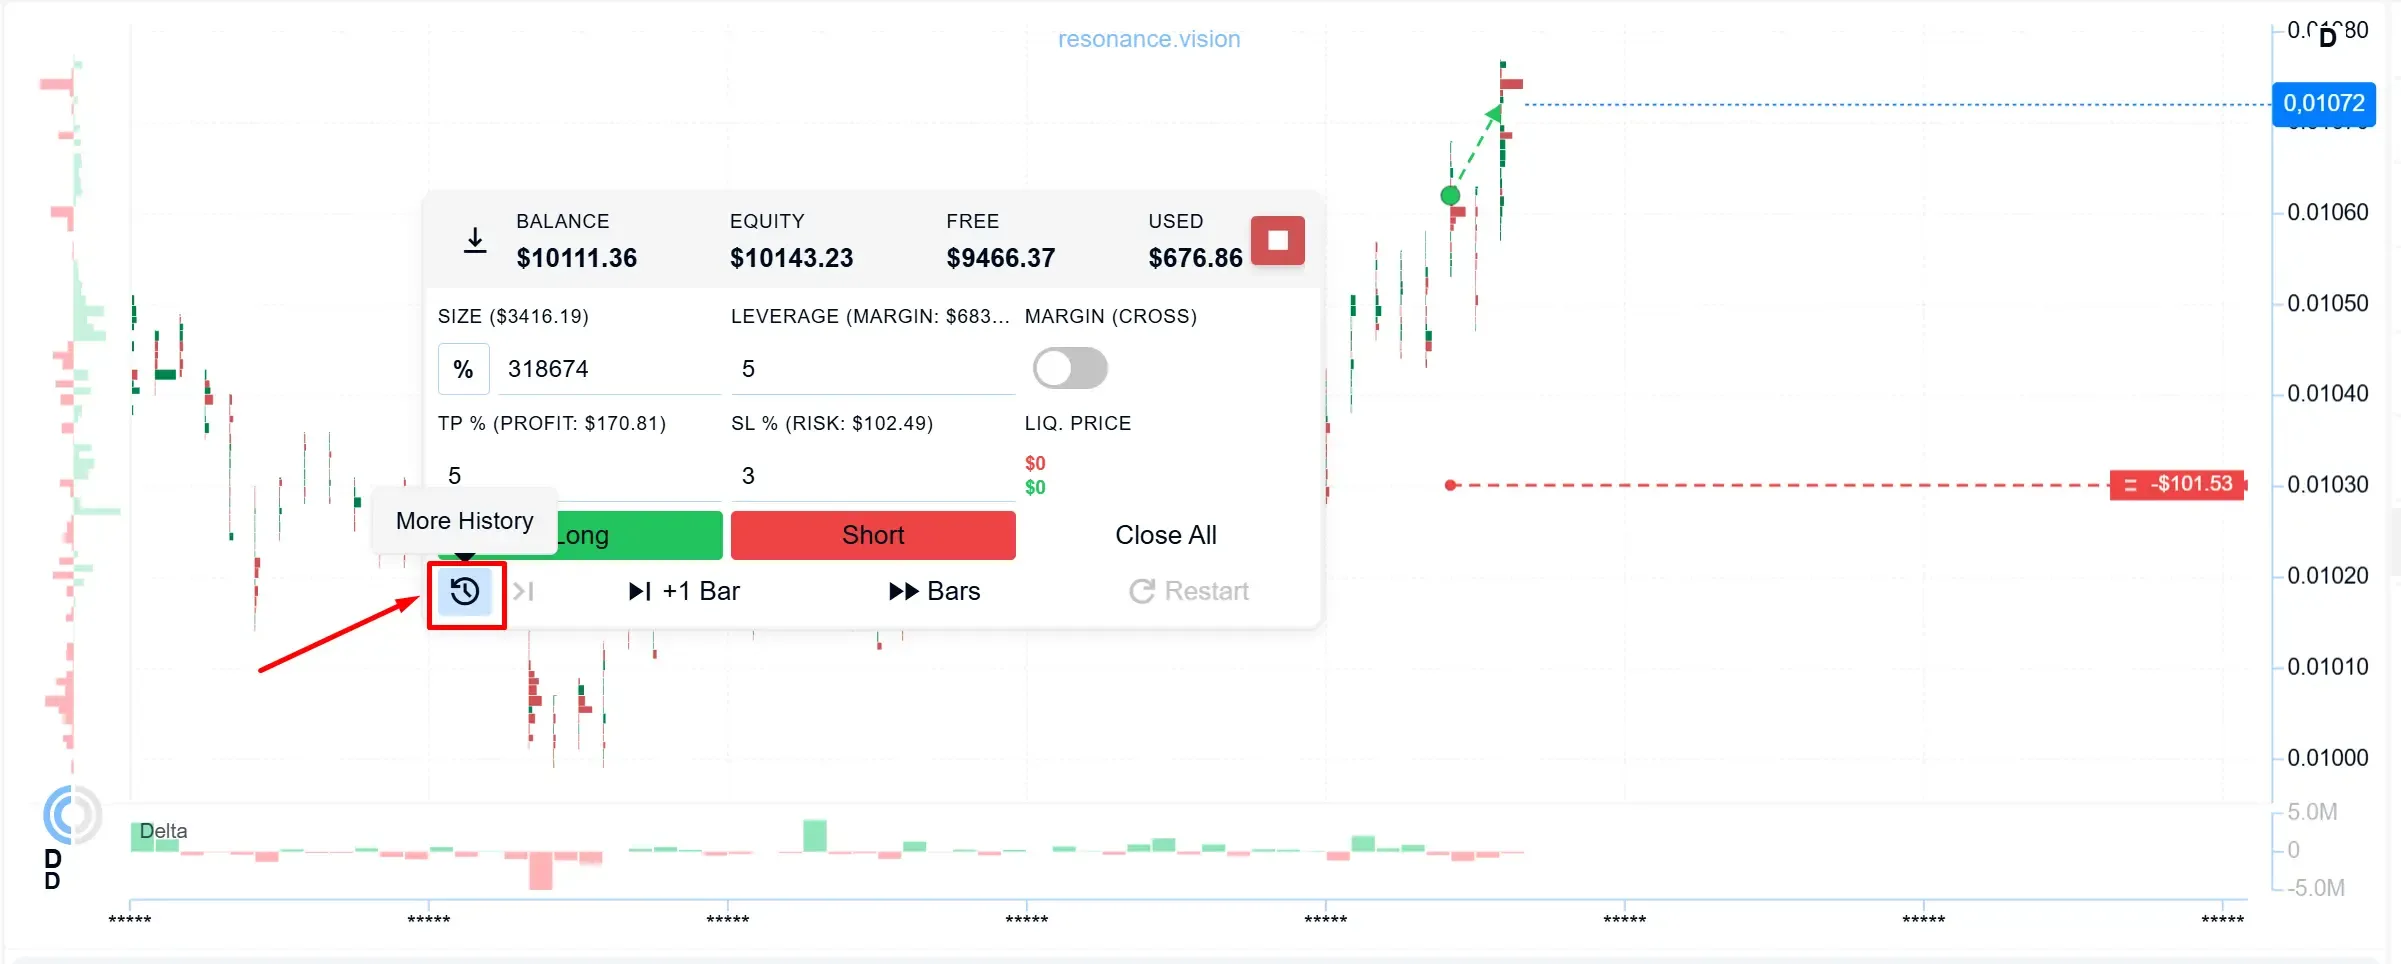
The history icon next to +1 Bar does not restore the previous session. Instead, it opens additional historical data for the current ticker.
A simulation can be ended using the relevant stop control or restarted using Restart. For details on how Restart affects the number of available simulation launches, see What Counts as One Trading Simulator Launch.
Follow new insights in our Telegram channel.
There is no need to invent complex schemes or look for the "grail". Use the Resonance platform tools for market analysis and trading practice.
Trading Simulator is a tool for practising trading decisions and analysing simulation results in a simulated trading environment.
Register via the link and explore the Resonance platform:
OKX | BingX | KuCoin.
Promo code TOPBLOG gives you a 10% discount on any Resonance tariff plan.
Recommended articles
