Обзор рынка по ALT - 06.03.2026

Despite the predominance of market selling, the price is gradually rising. Limit buy orders are forming support, and abnormal liquidity clusters on the heat map are strengthening this price range.
Table of contents

In this market review, we are not attempting to predict the future; our task is to state the facts we have at the current moment. We base our actions on these facts, not on our expectations and hopes.
Market Orders and Limit Orders
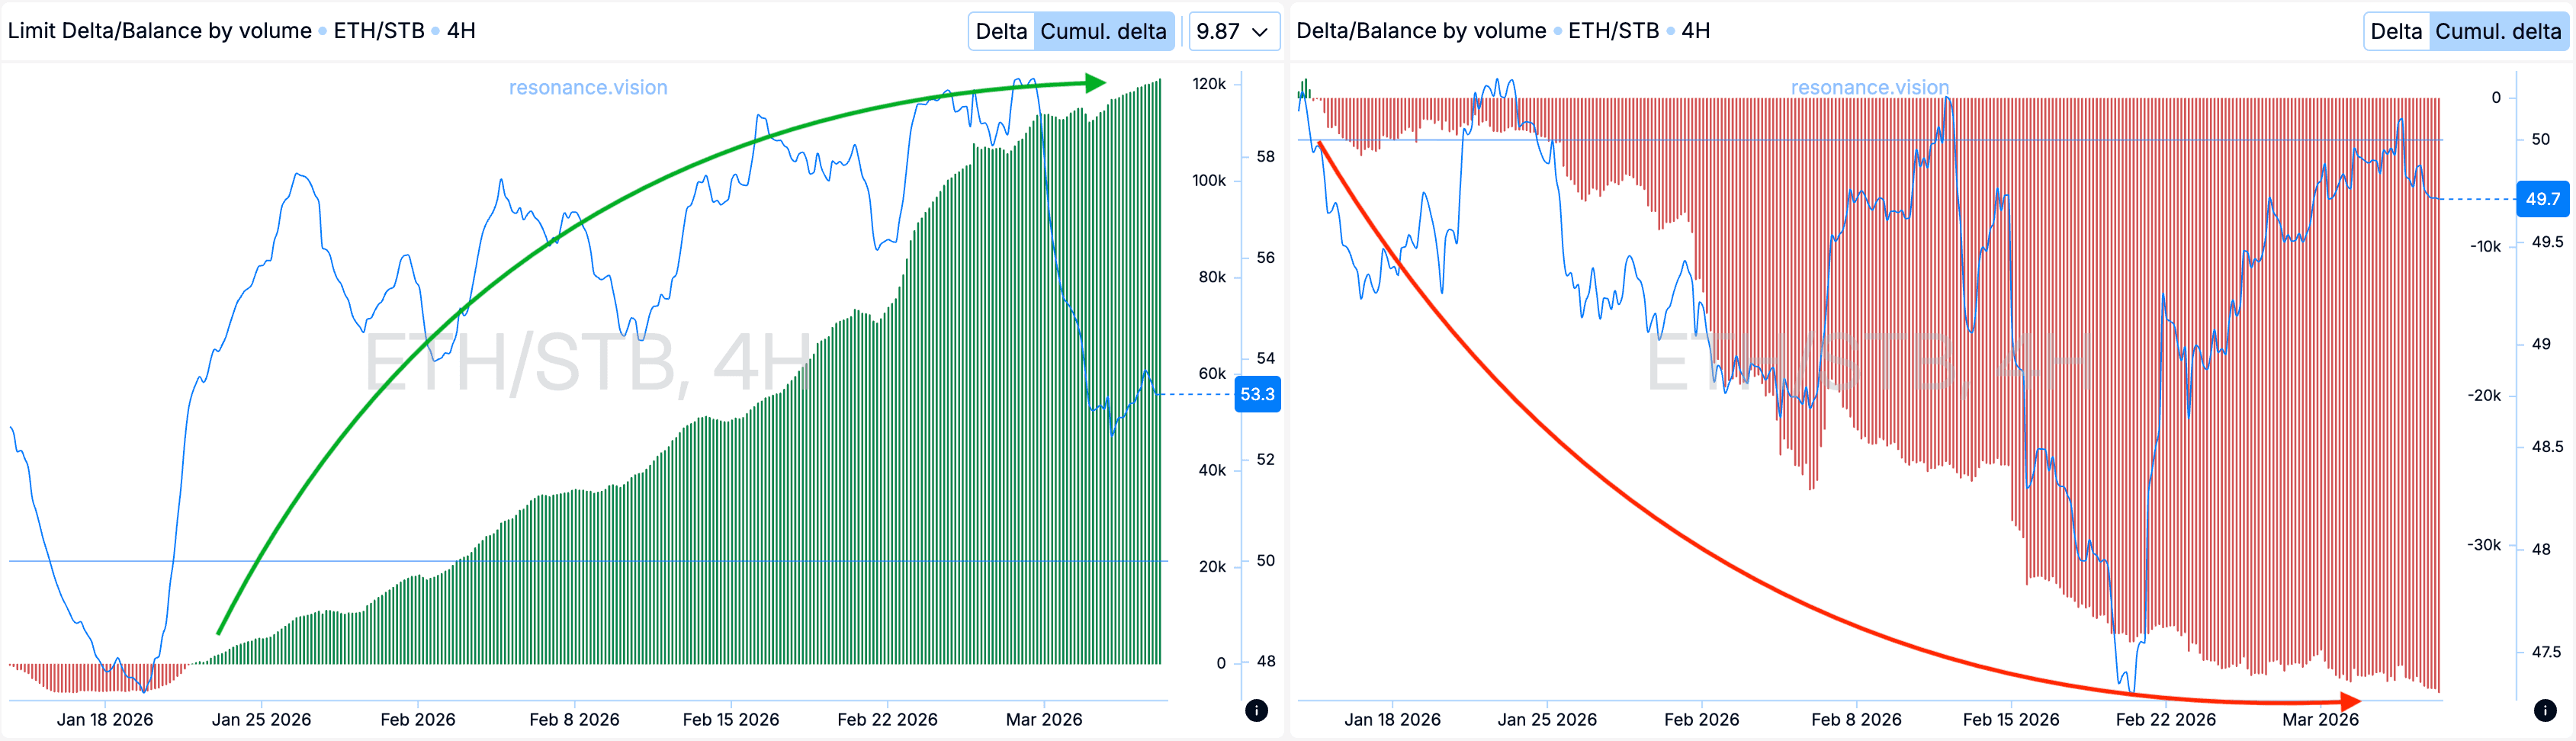
Cumulatively, in aggregated form, sell market orders remain dominant (red arrow). This is clearly reflected in the cumulative delta histogram and indicates ongoing pressure from market sellers.
At the same time, buy orders consistently predominate in limit orders (green arrow). In the current market structure, it is these volumes that act as support, containing market selling pressure and limiting further declines.
Heatmap in Volume Mode (blue rectangle)
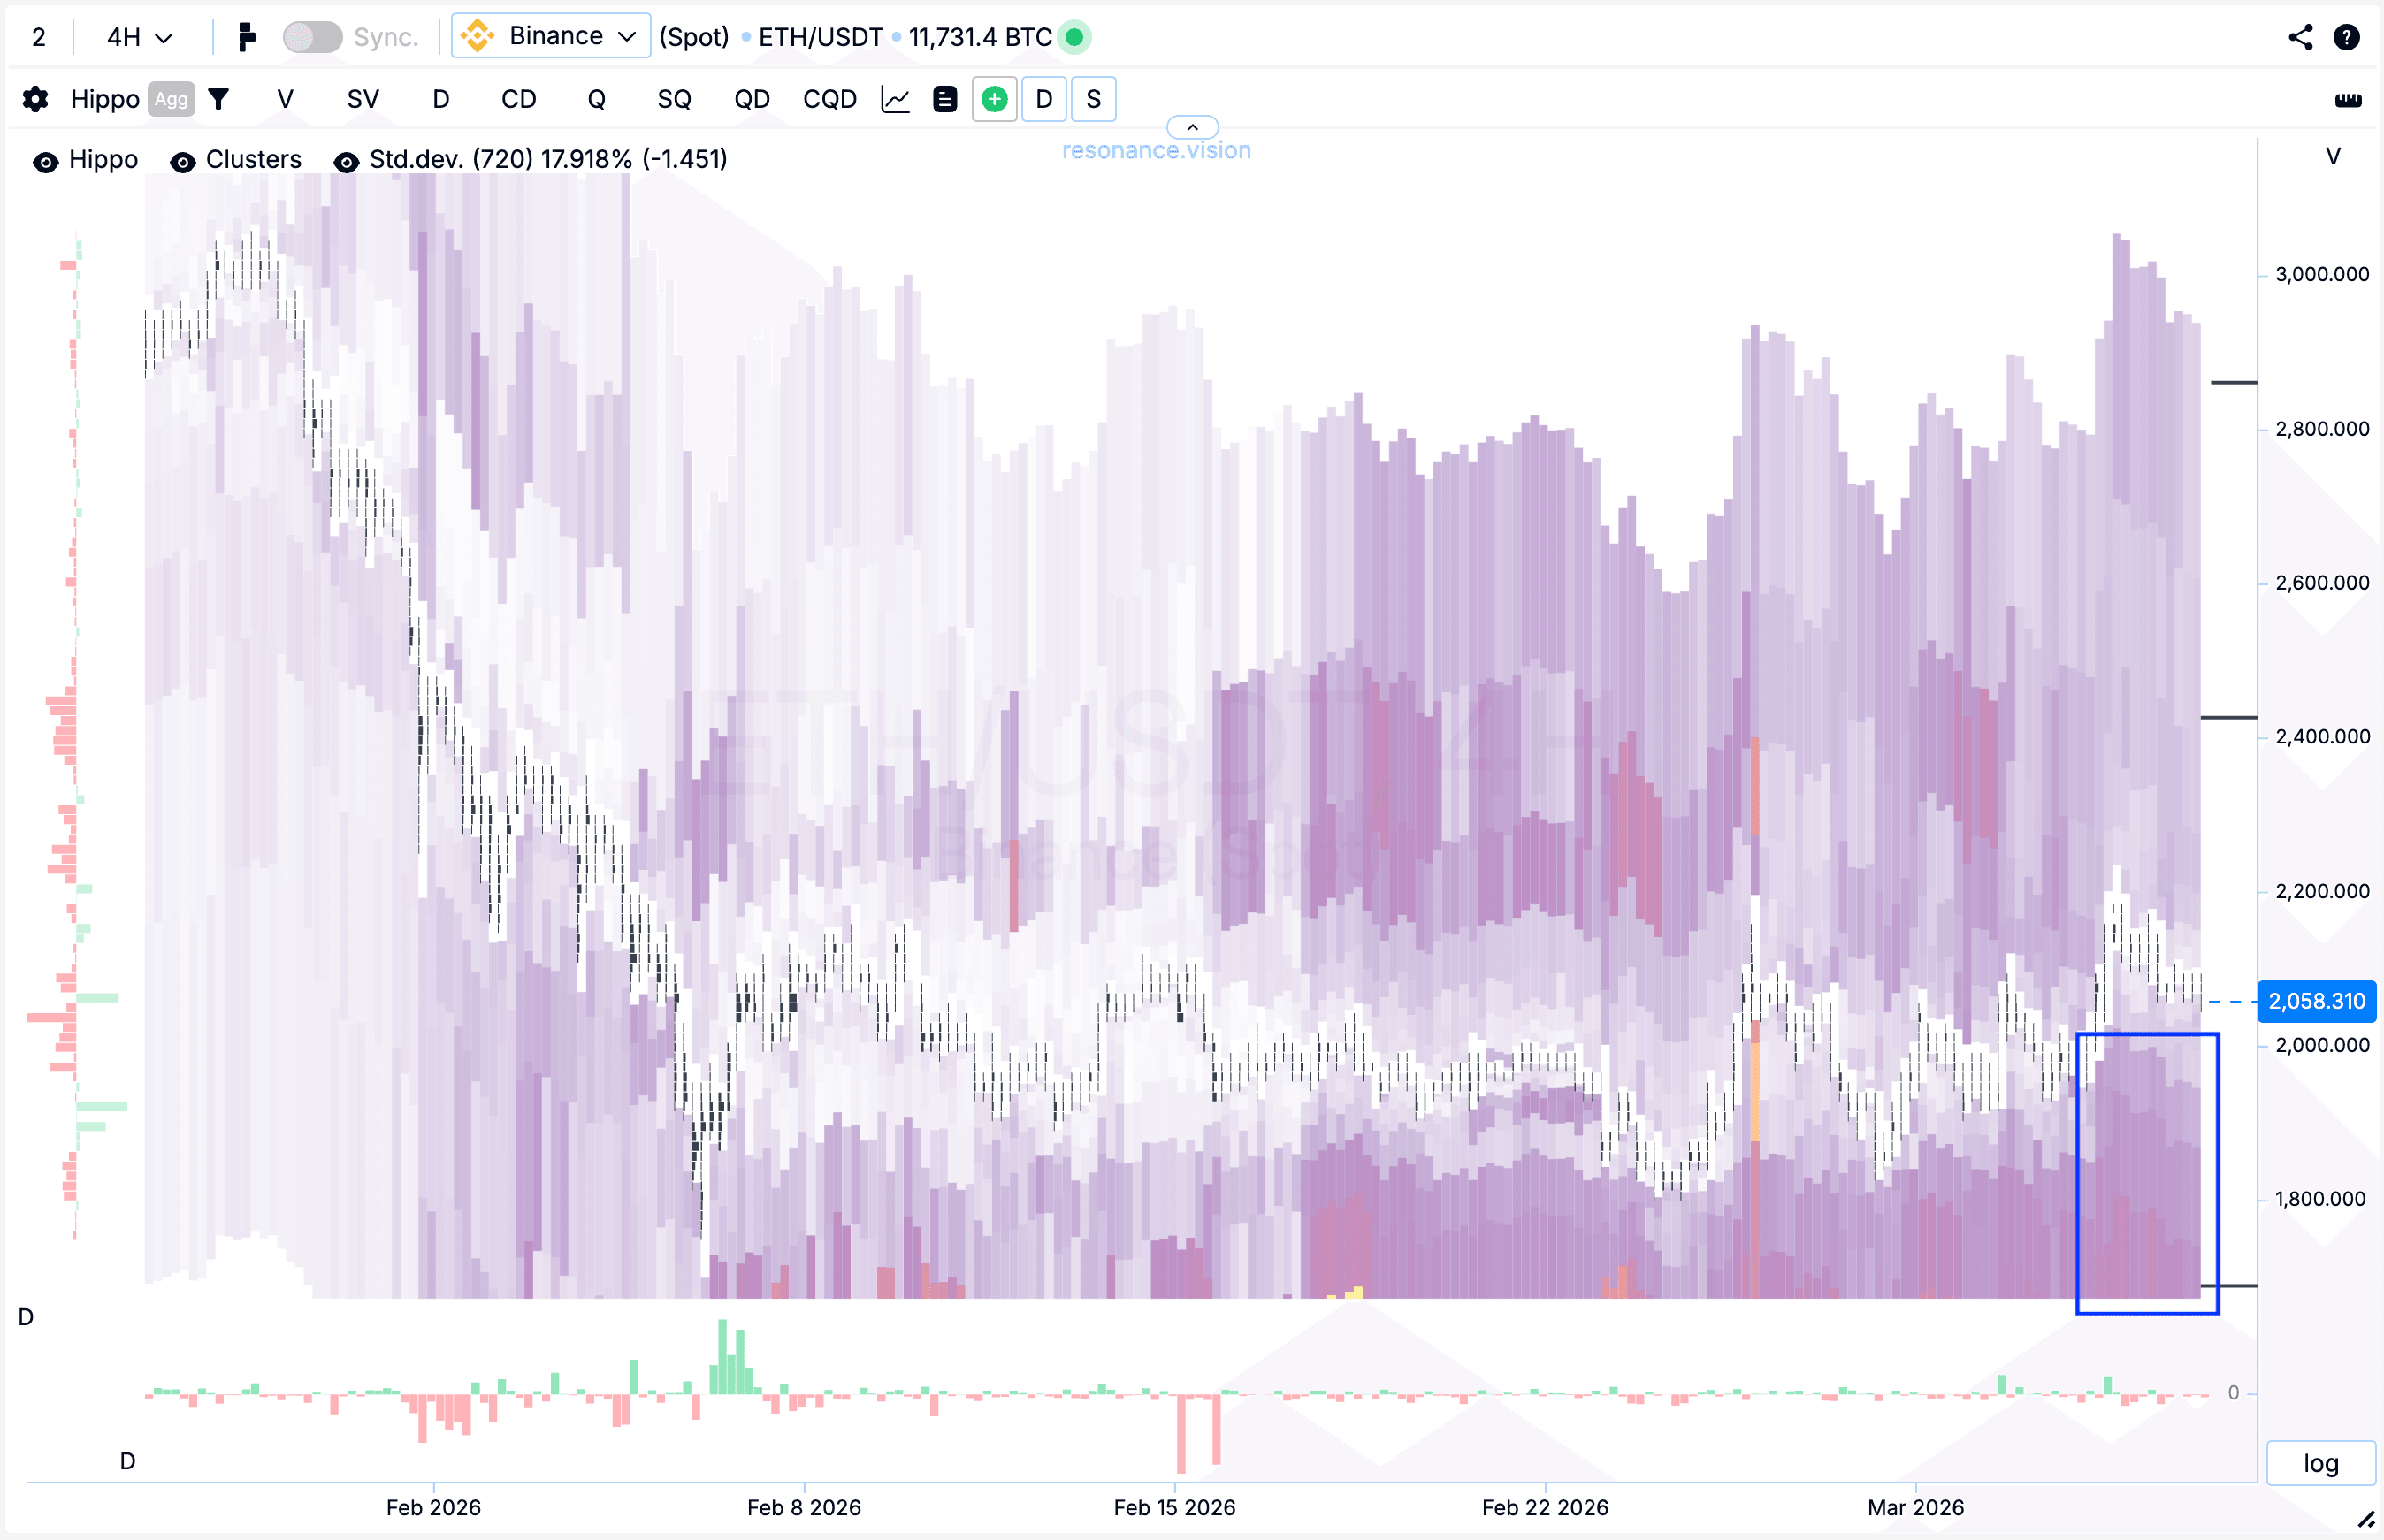
The heatmap shows pronounced anomalous clusters of limit buy orders slightly below the current price. Moreover, density data gradually increases as the price moves higher (blue rectangle).
Above the current price, however, no comparable anomalous clusters of liquidity are observed, highlighting the concentration of limit demand at the bottom of the range.
Balance Index
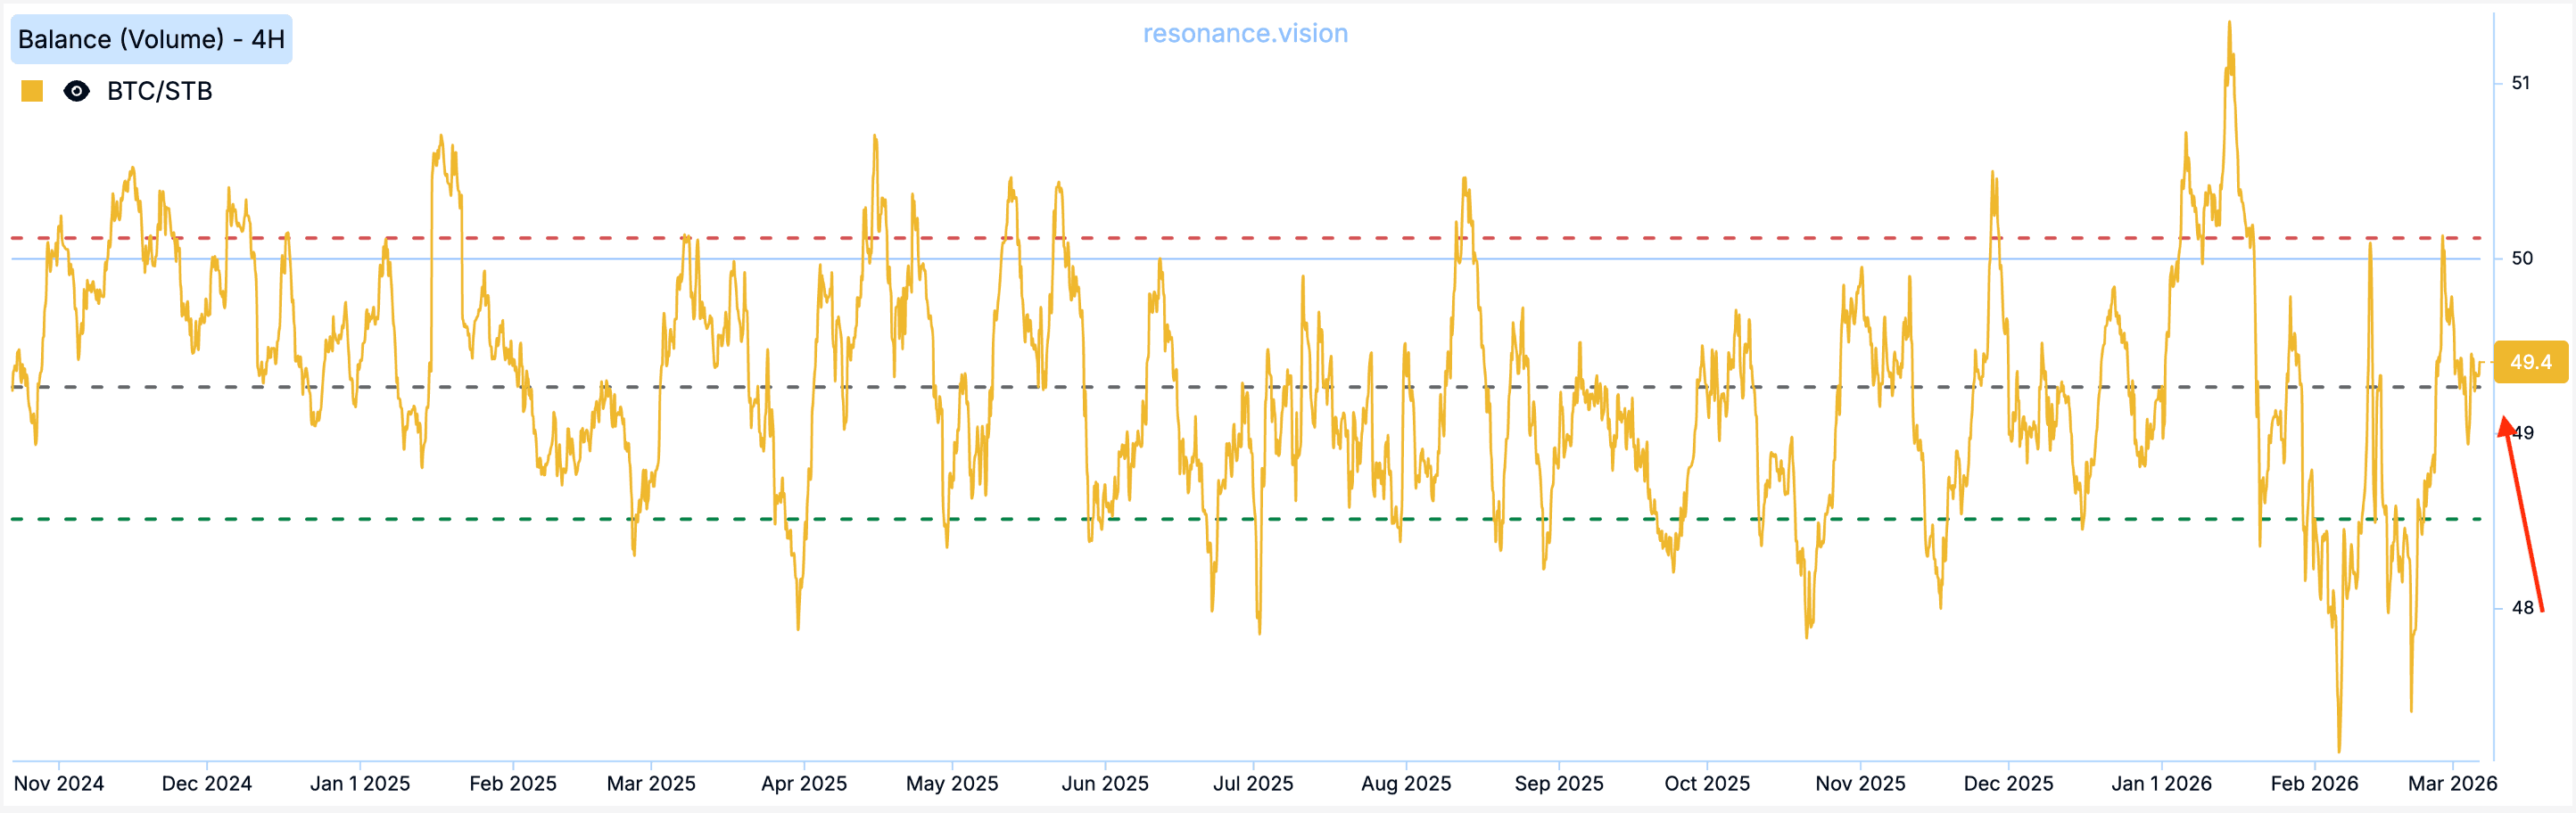
The Balance Index is within the normal percentile range and does not show a significant bias toward either buyers or sellers.
Price Dynamics
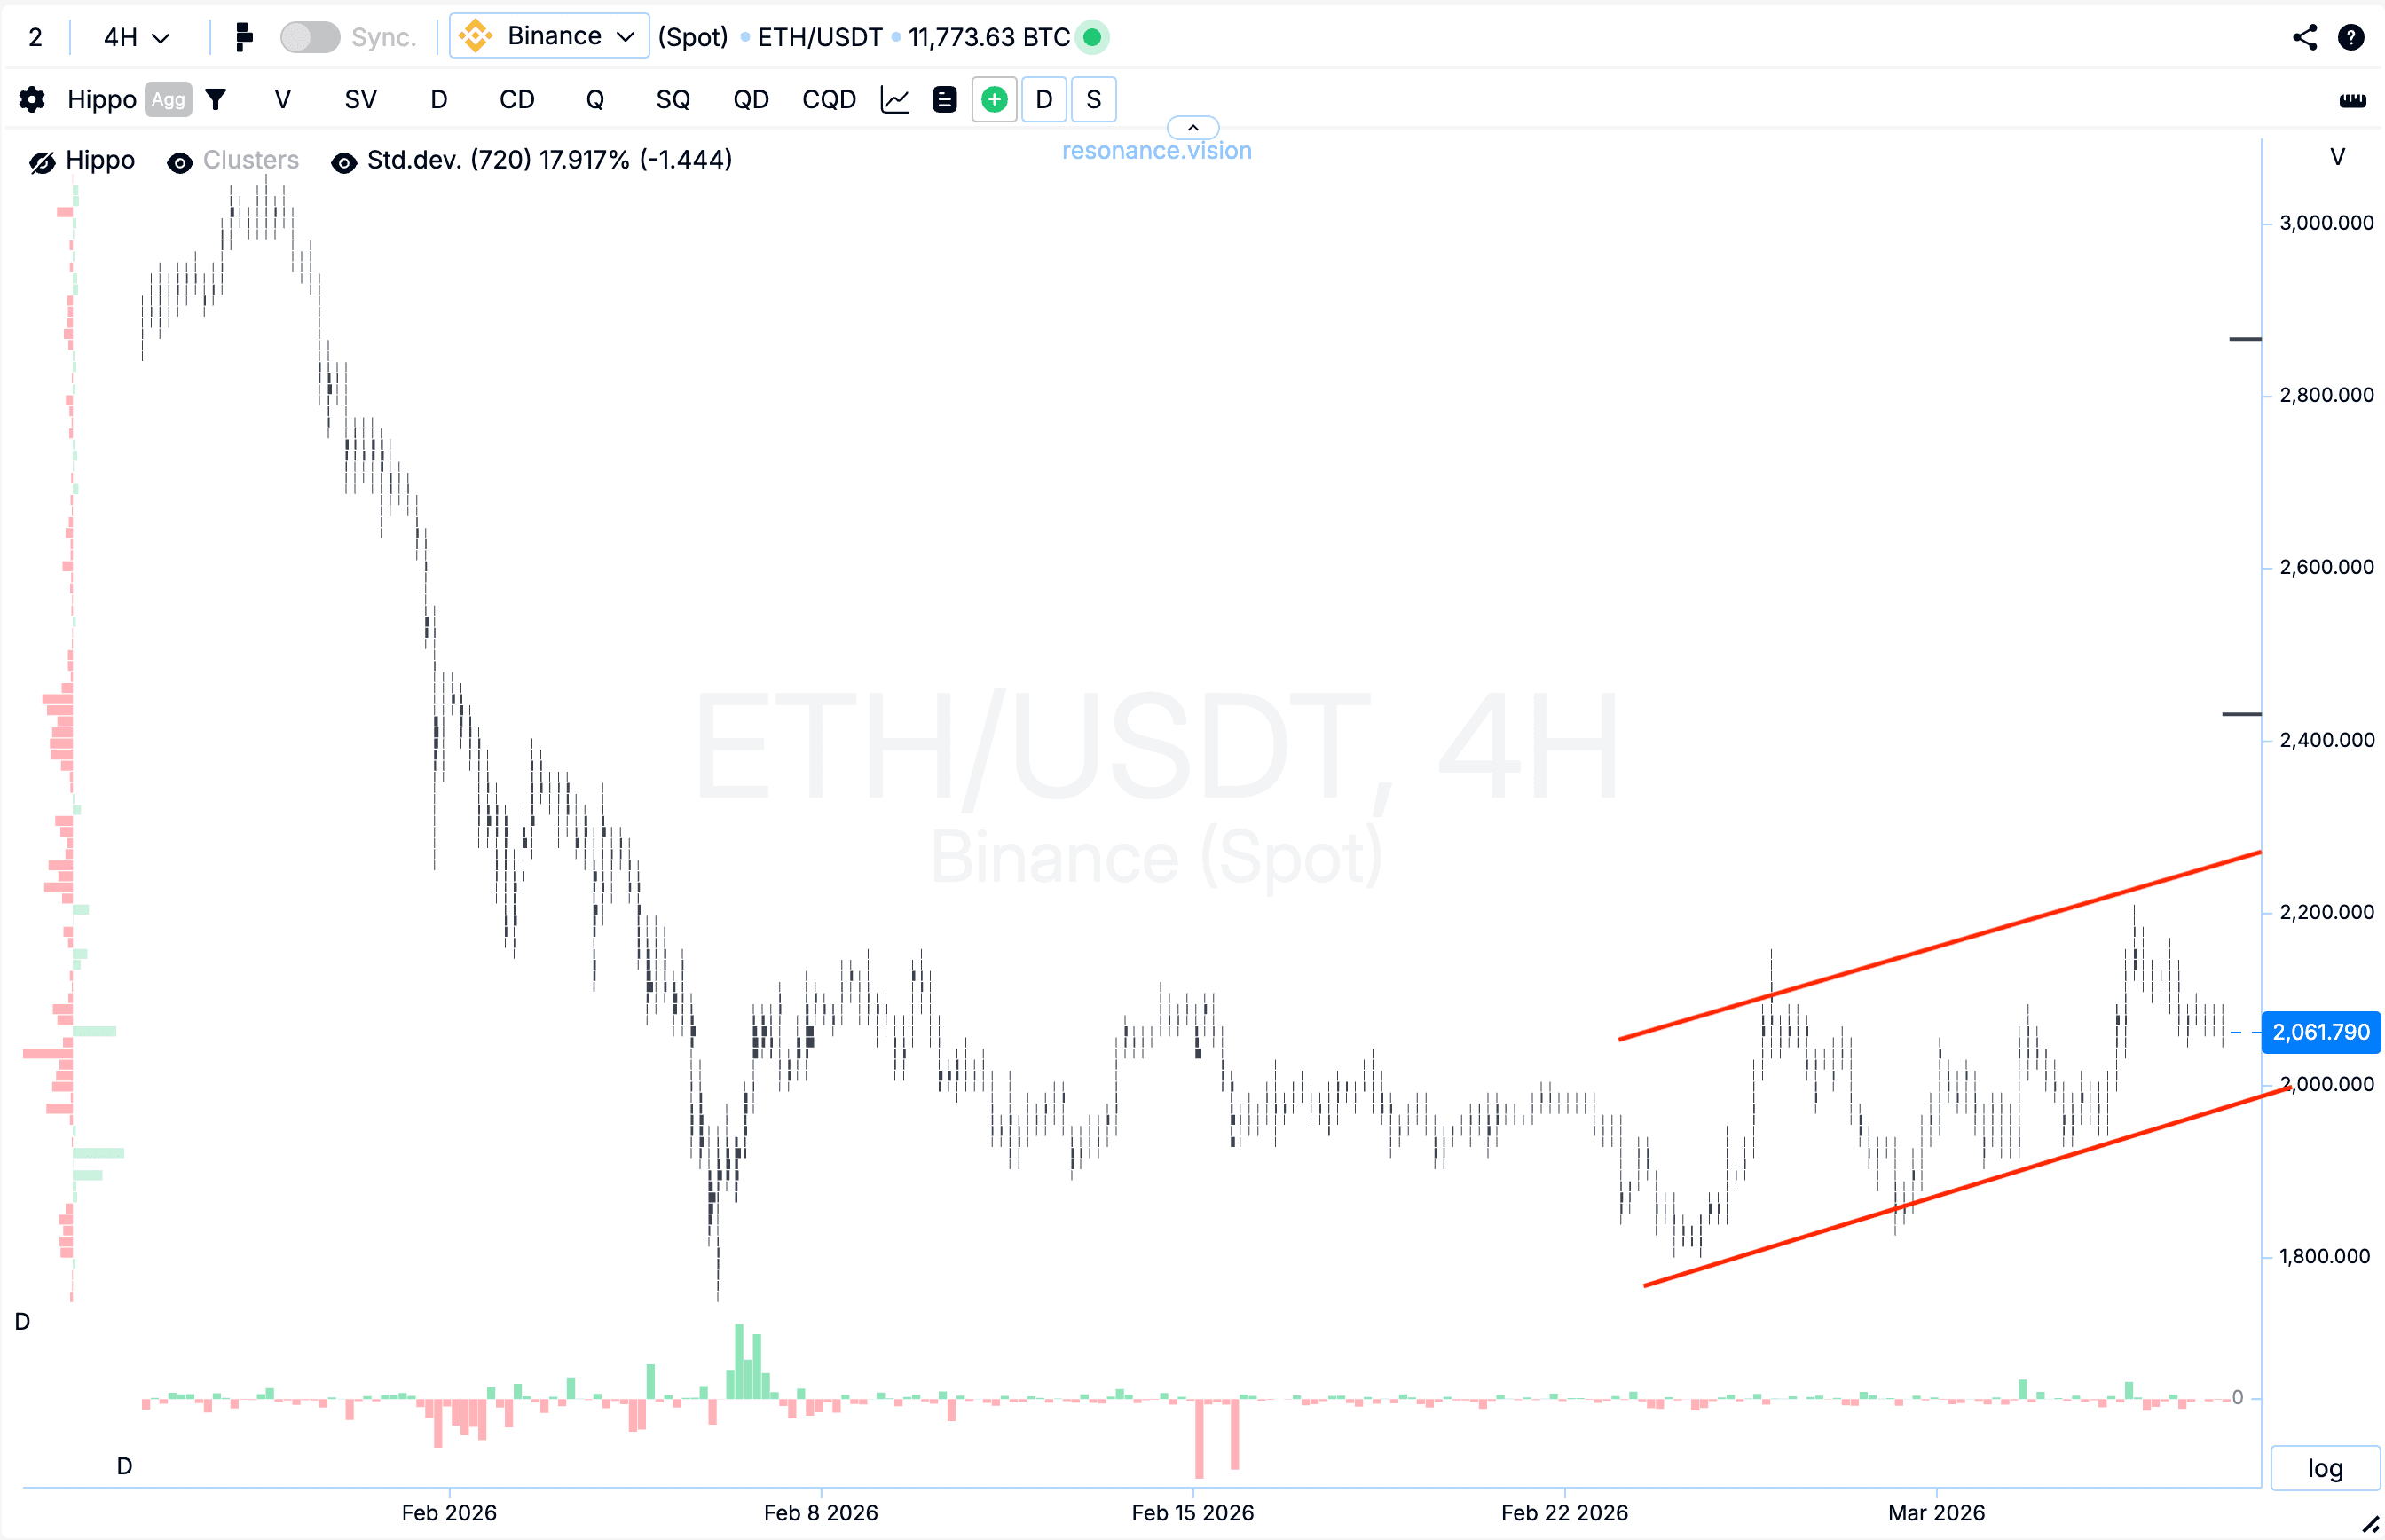
Despite the predominance of market sales, the price is showing a gradual, smooth increase. At the same time, the volume of limit buy orders continues to increase, forming a stable local support.
Summary:
Currently, according to Charles Dow’s theory, a local upward movement is forming: highs have begun to be renewed, while lows are no longer being renewed.
How would you implement a trading idea in this situation?
Follow new insights in our telegram channel.
No need to invent complex schemes and look for the "grail". Use the Resonance platform tools.
Register via the link — get a bonus and start earning:
OKX | BingX | KuCoin.
Promo code TOPBLOG gives you a 10% discount on any Resonance tariff plan.
Recommended articles


