BTC Market Review - February 17, 2026

Despite the prevalence of market selling, its effectiveness is declining. The price is trading sideways, and abnormal limit densities remain within the same price range.
Table of contents

In this market review, we do not attempt to predict the future; our task is to state the facts we have at the current moment. We base our actions on these facts, not on our expectations and hopes.
Market Orders and Limit Orders
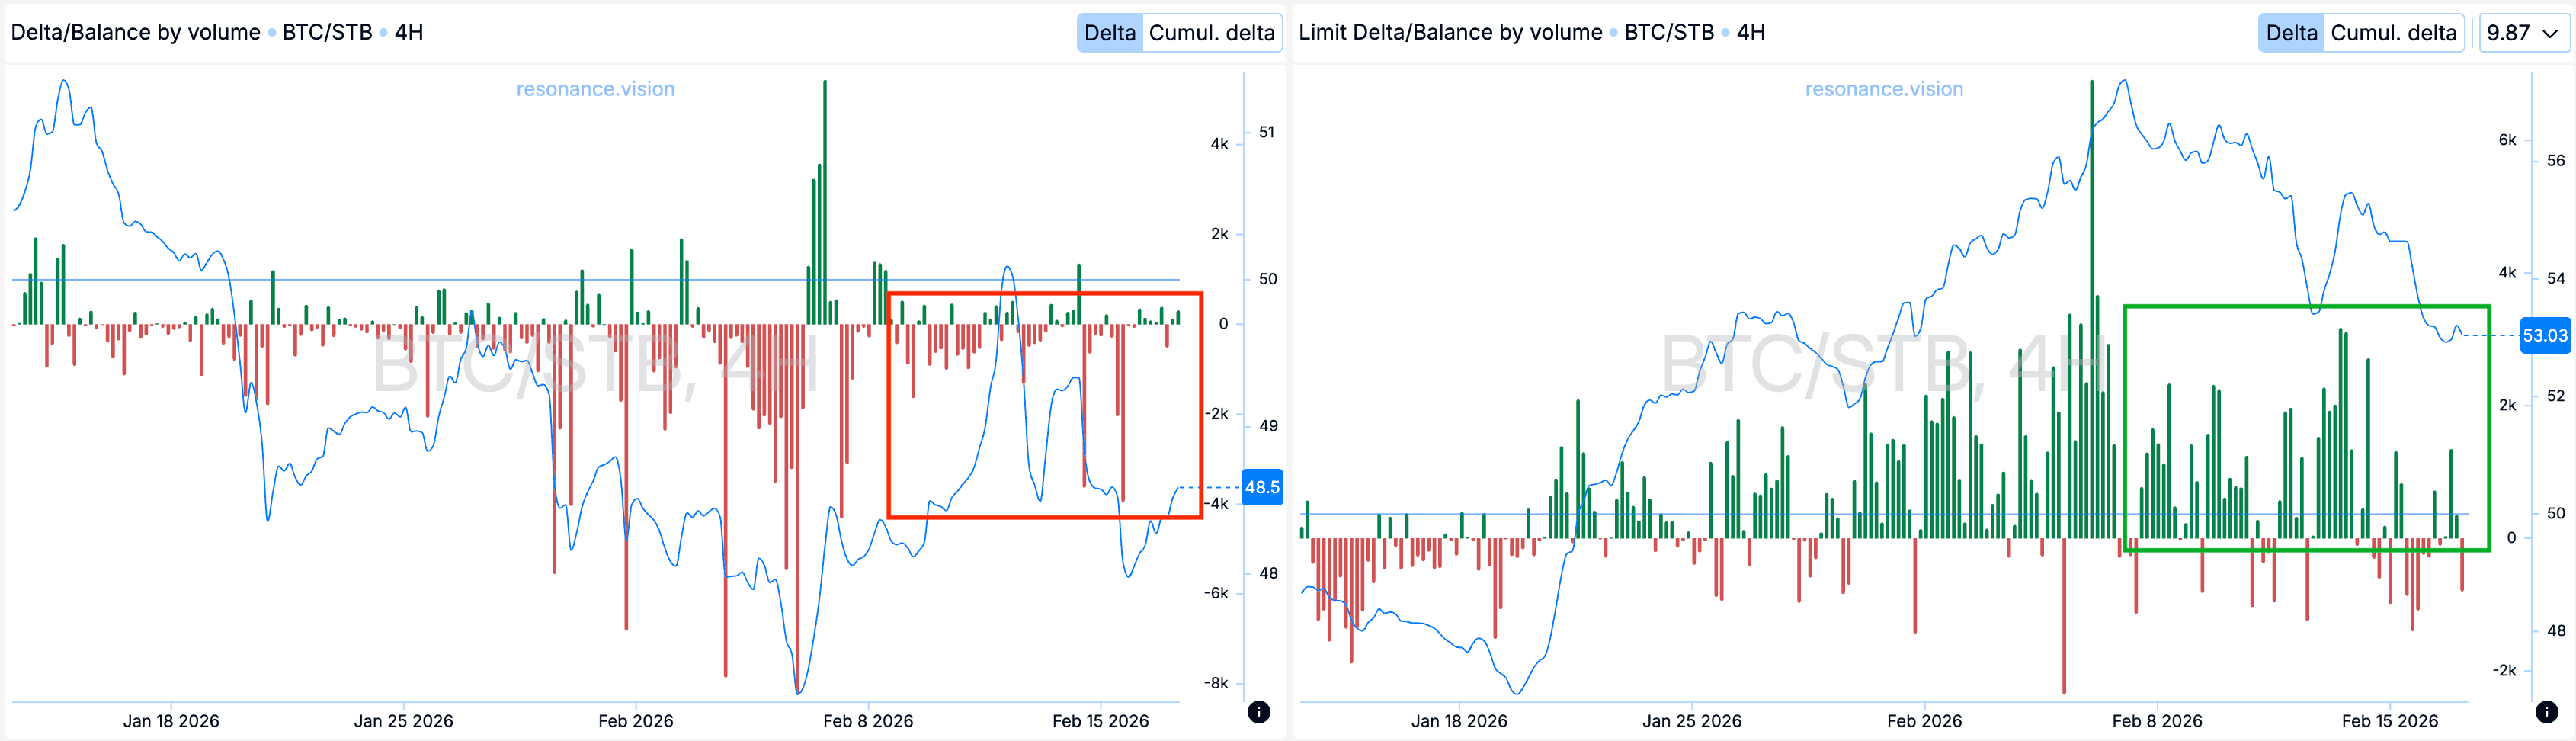
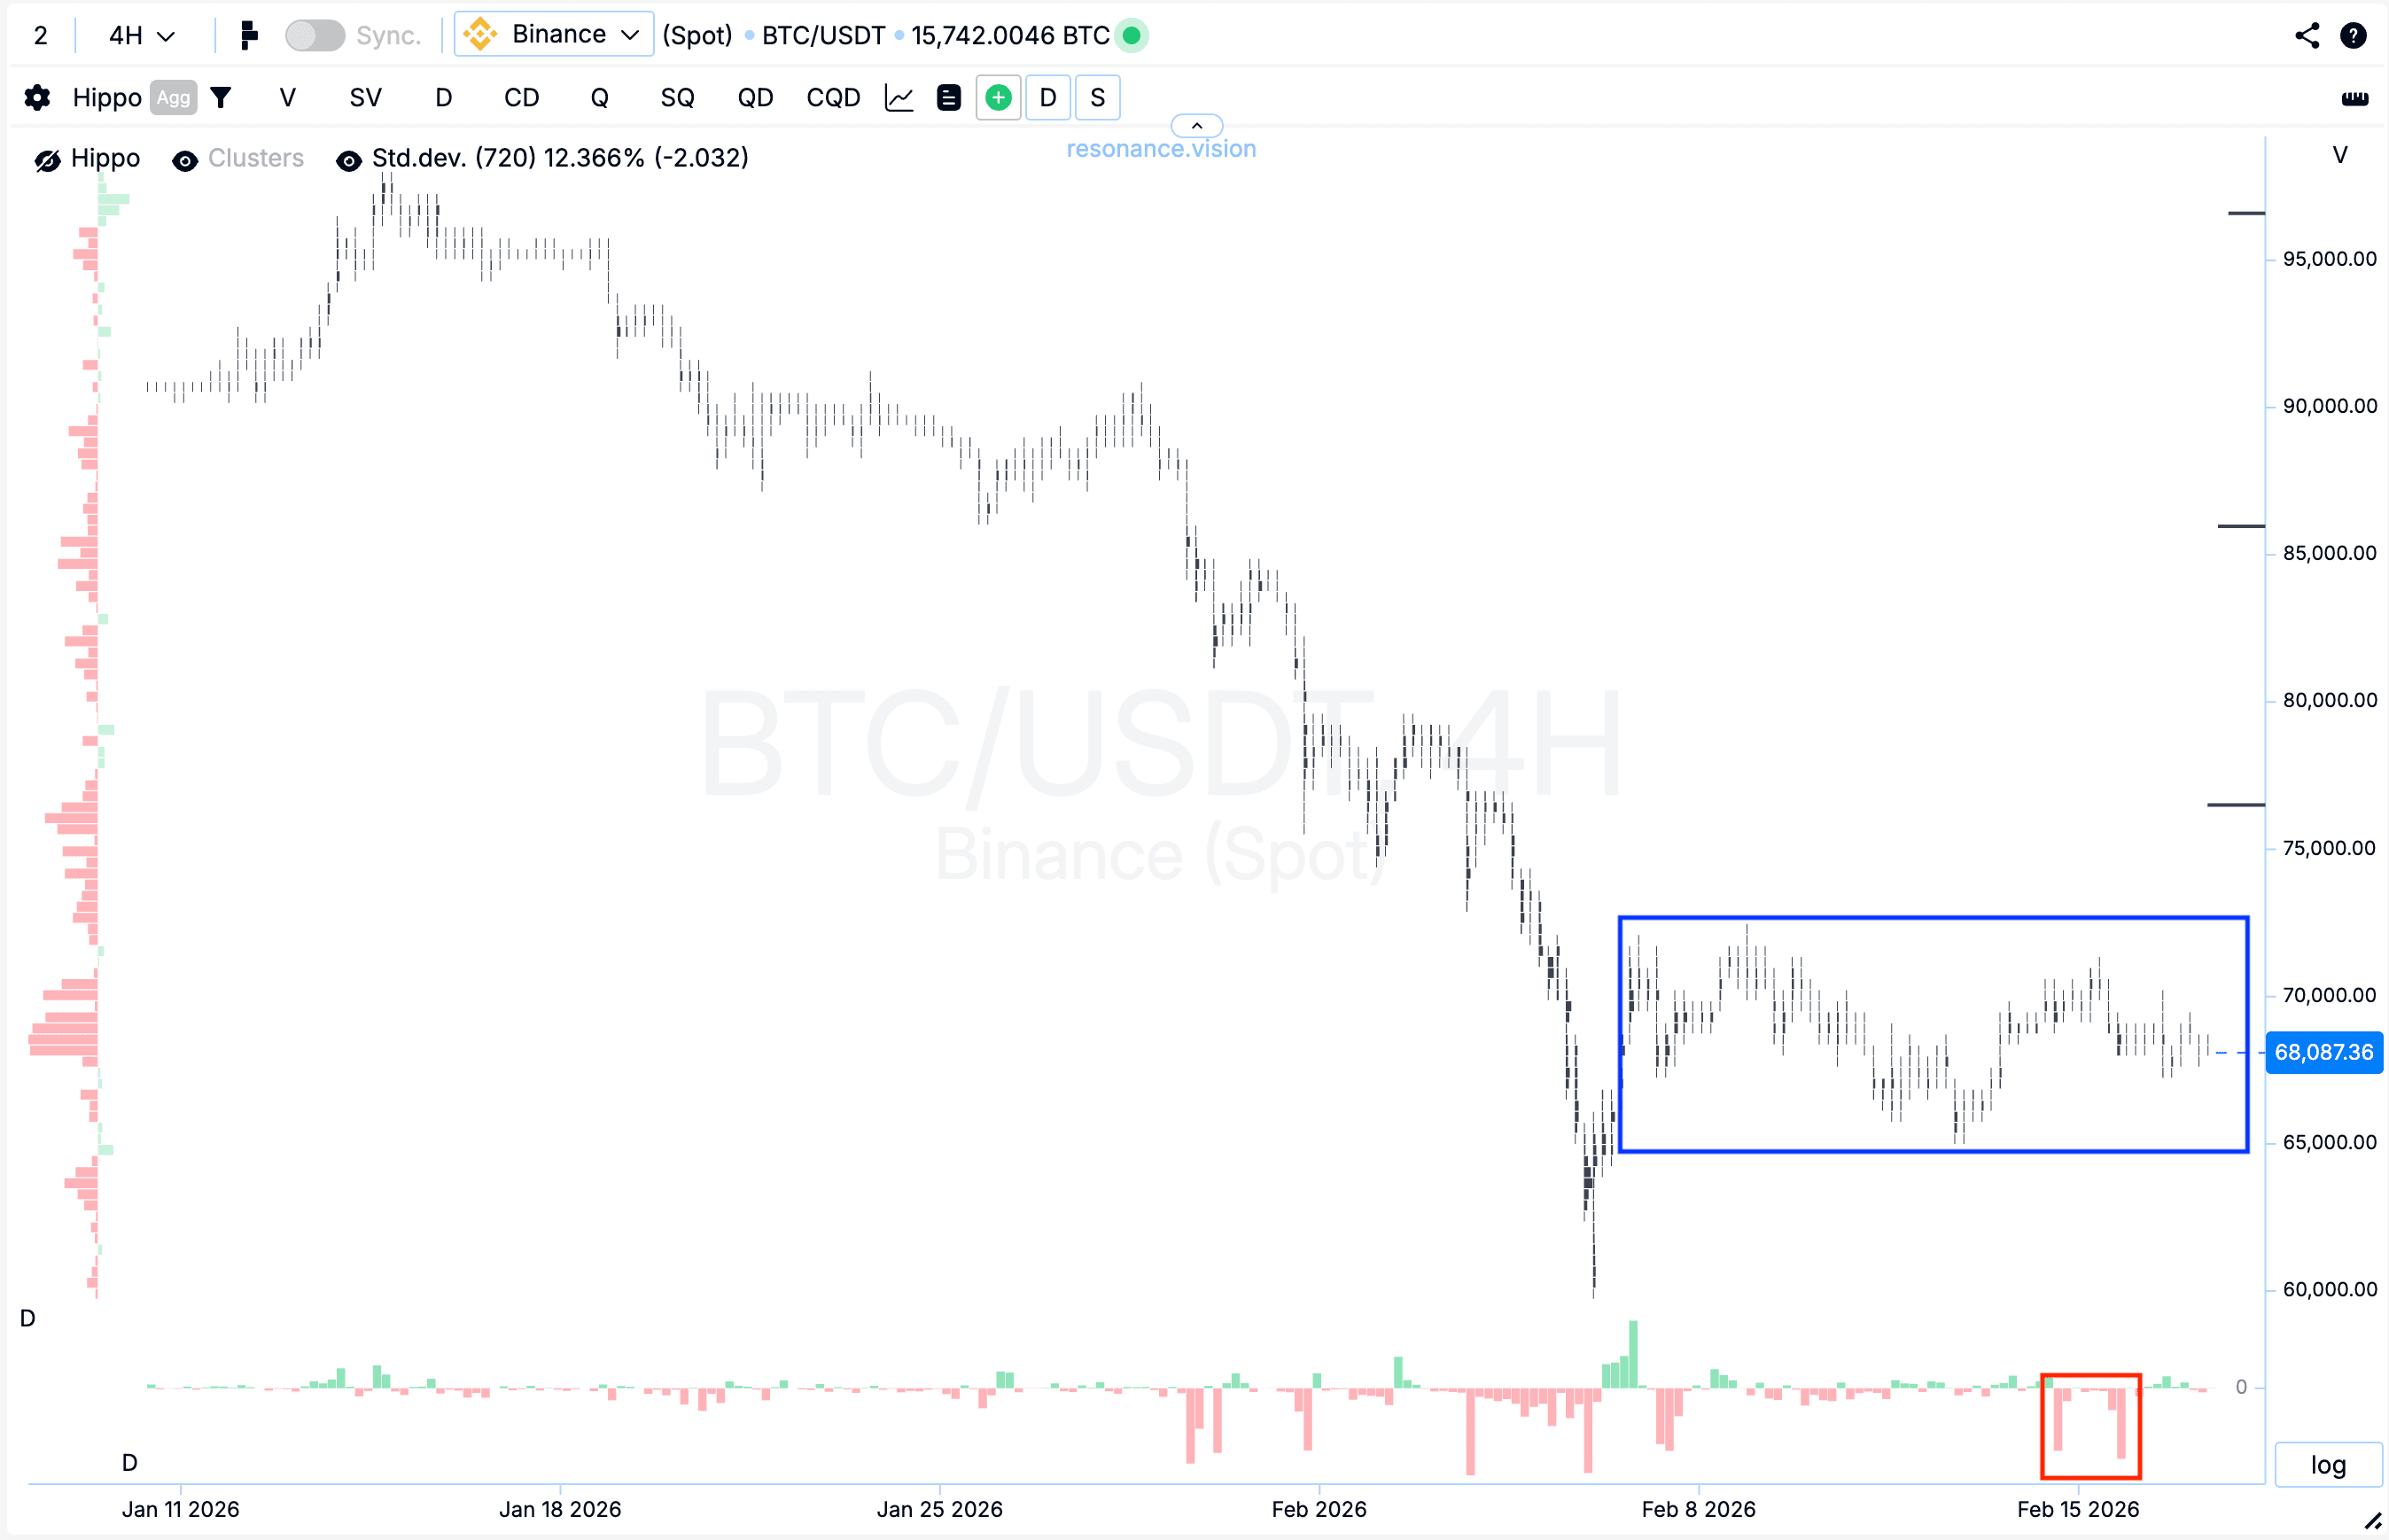
Over the period under review, aggregated market orders show a predominance of sell trades. This is clearly reflected in the delta histogram (red rectangle) and indicates ongoing selling pressure.
At the same time, the delta histogram shows a predominance of buy orders for limit orders; the extreme values are marked on the chart (green rectangle). This indicates the presence of counter-limit demand in the current price range.
Price change per unit volume
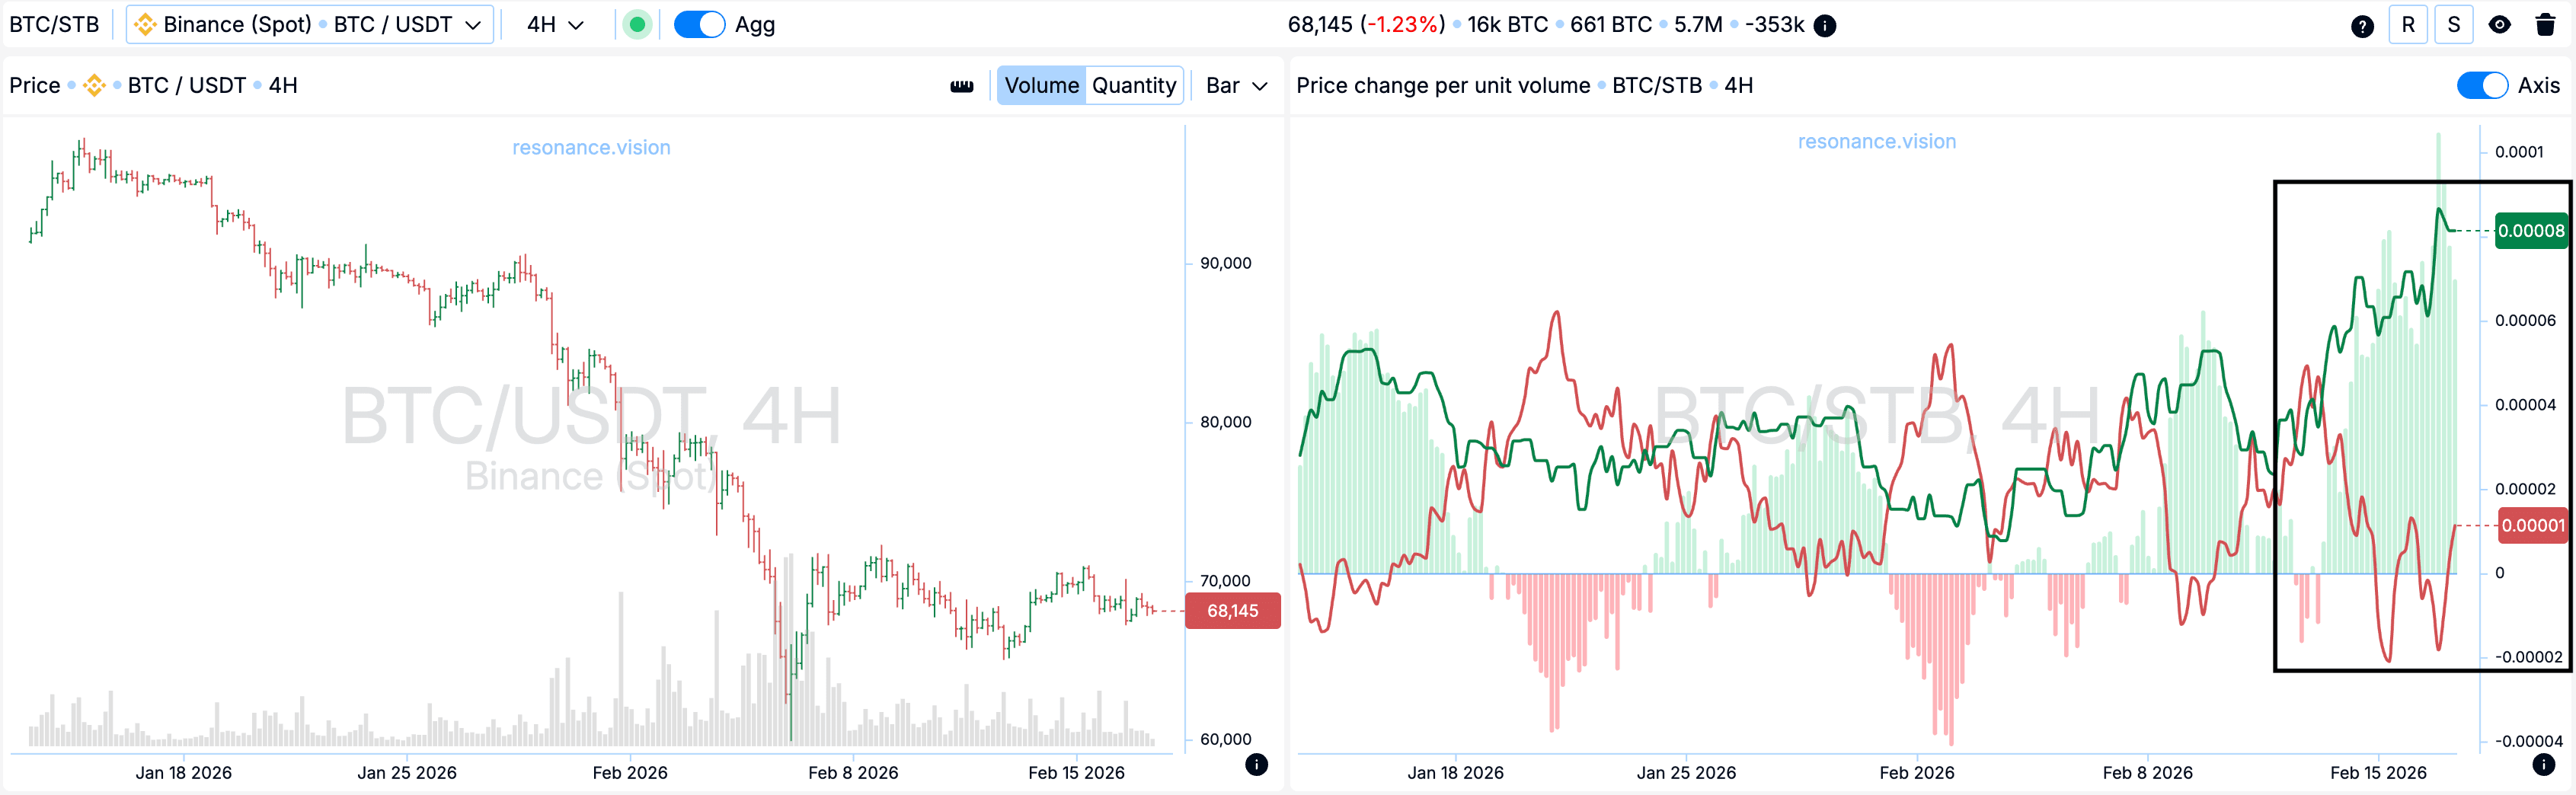
The extremes of the volume-to-price ratio have diverged in favor of buyers – this is clearly visible by the divergence of the lines (black rectangle). In other words, less volume is currently required for the price to move up than for a continued decline.
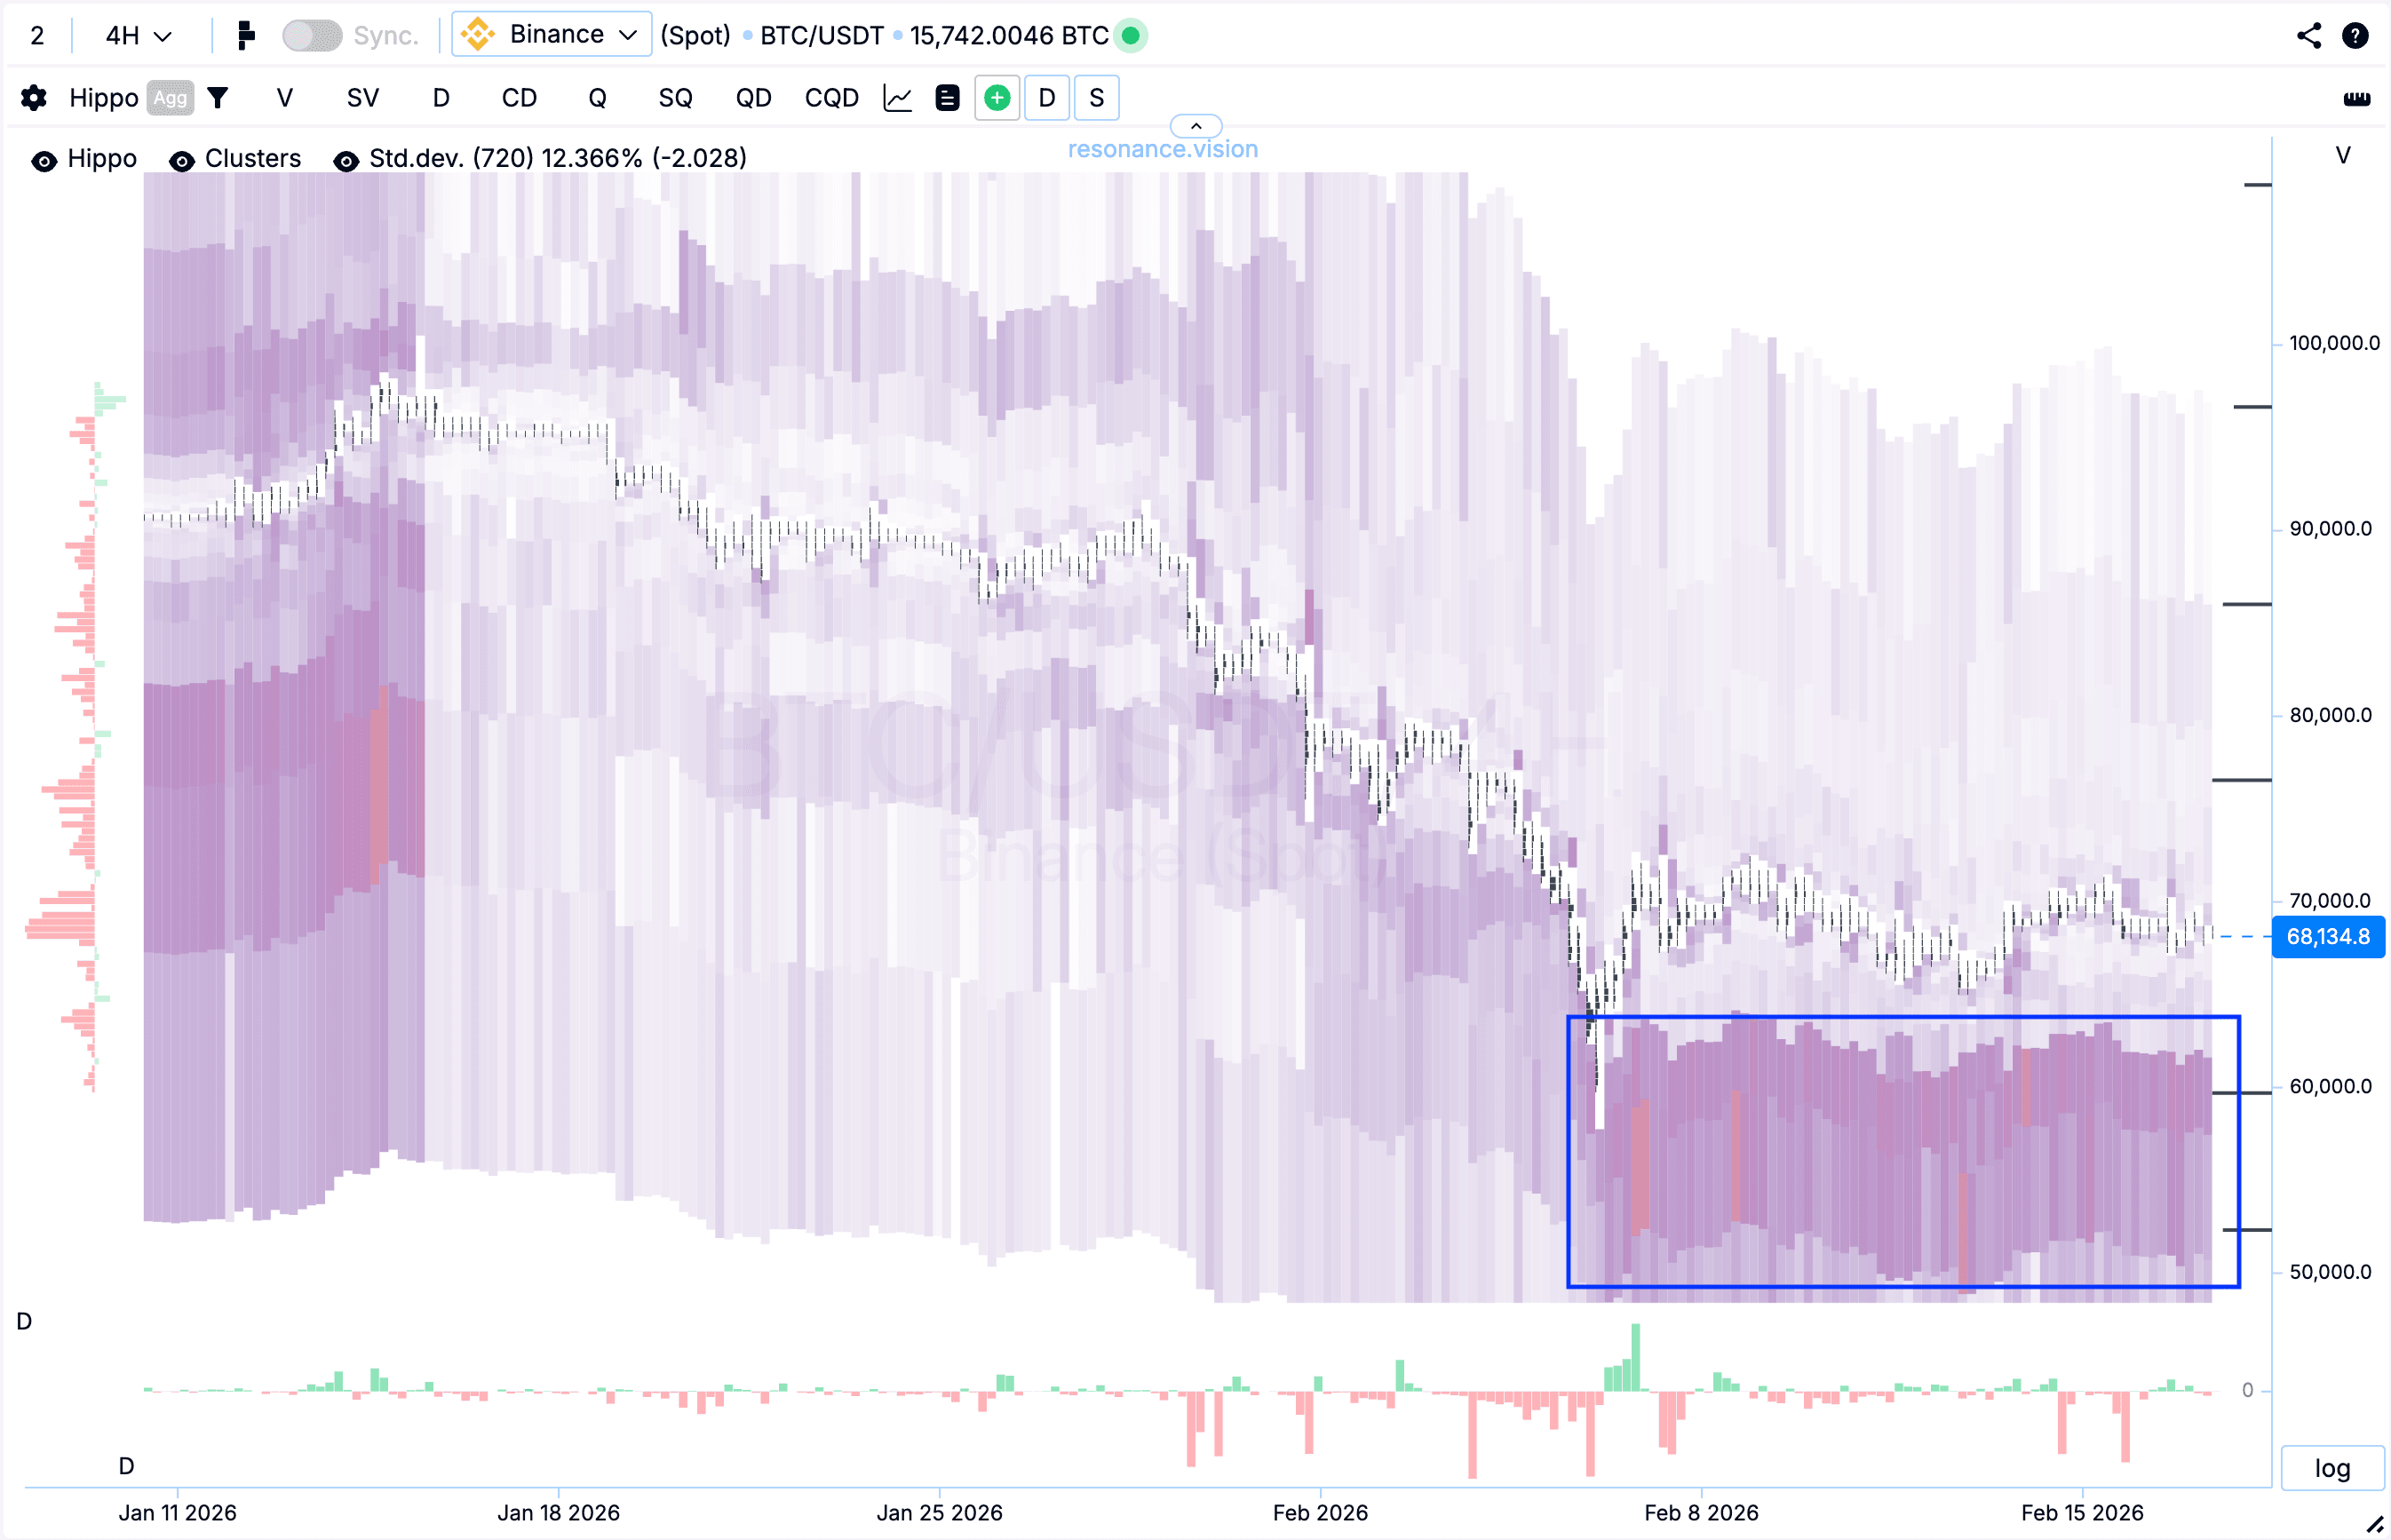
Heatmap in Volume Mode (Blue Rectangle)
The heatmap shows abnormal clusters of limit buy orders slightly below the current price. These volumes held up the recent decline: they partially absorbed market selling and locally restrained further downward movement, continuing to remain within this price range.
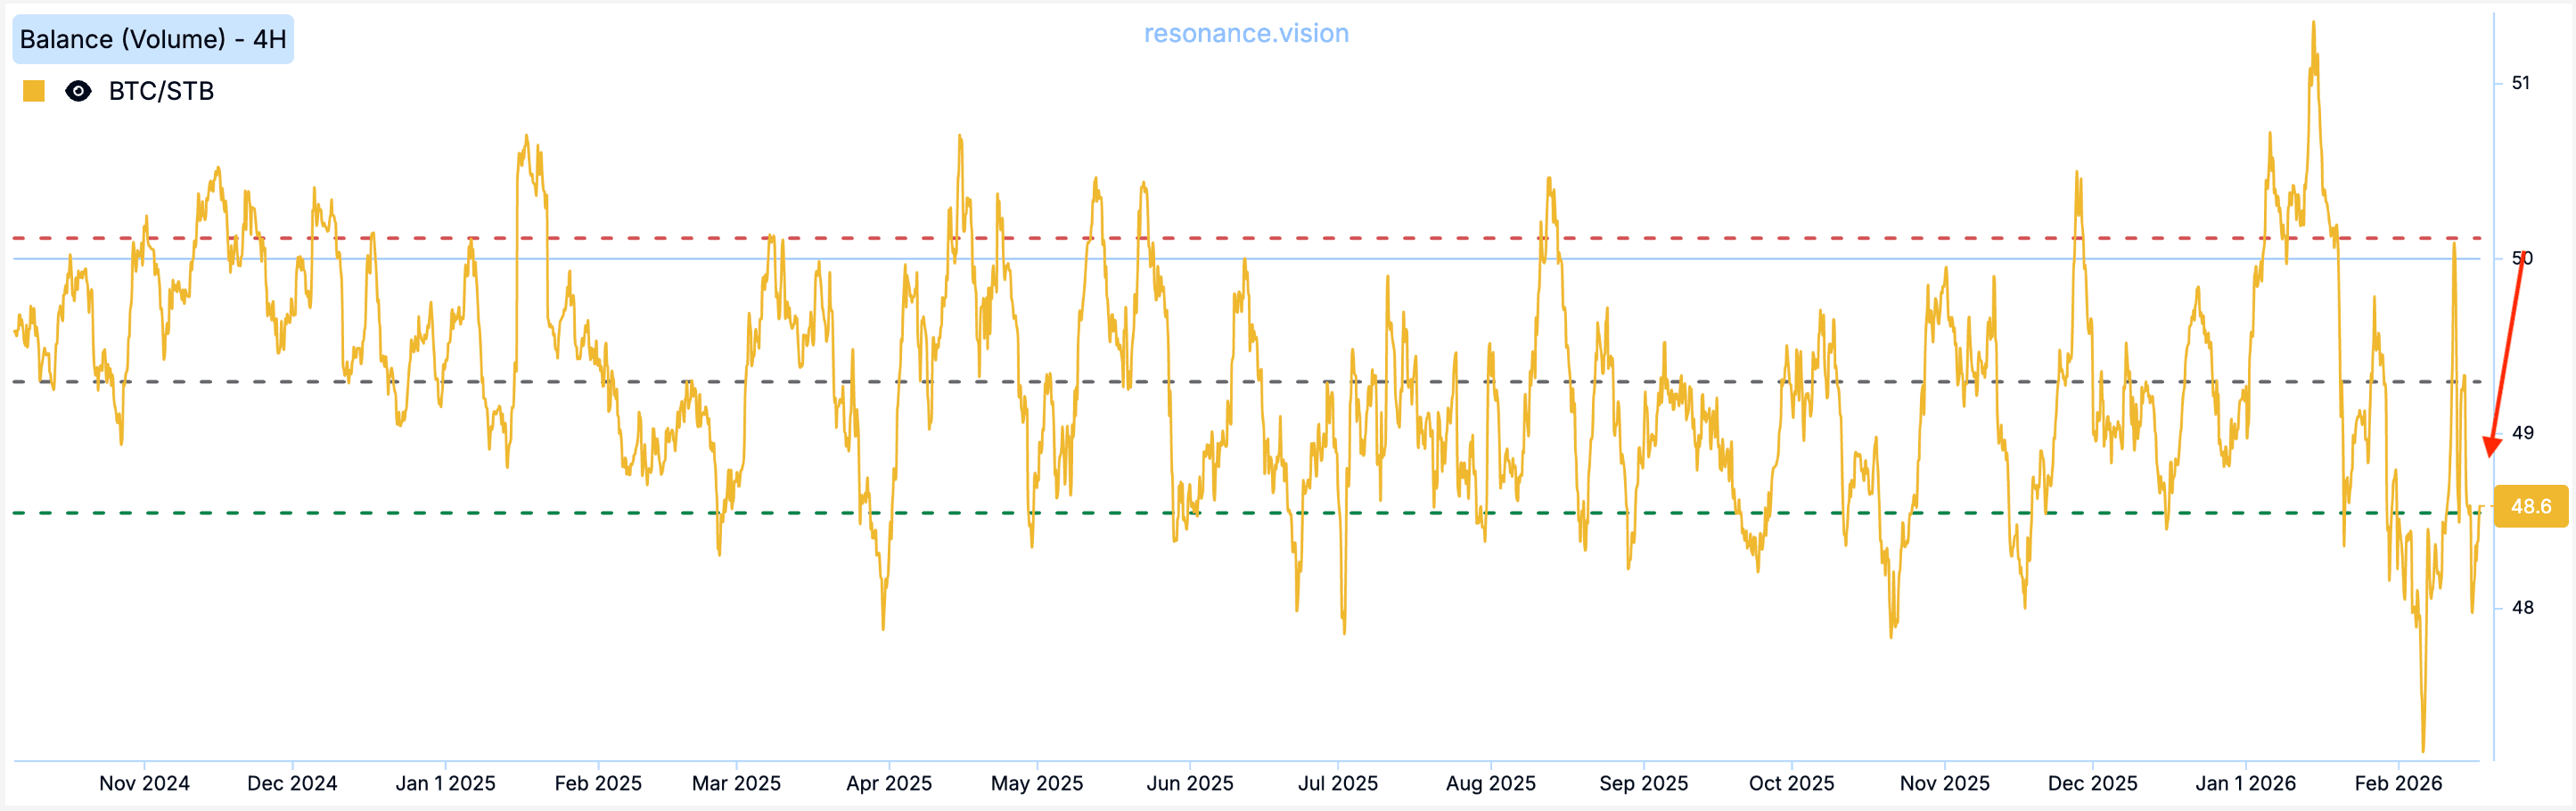
Balance Index
The Balance Index is shifted downwards and is in the abnormal percentile range, reflecting increased selling pressure.
Price Dynamics
Market orders continue to predominate, but recent sales are no longer demonstrating the same price impact. At the same time, the balance of limit orders is shifting upward, creating local support from limit demand.
Summary:
Currently, we are seeing a sideways trading phase with relatively low volatility. Selling has ceased to exert significant pressure and has not yet led to a renewal of the local minimum. Abnormal limit densities on the heat map remain within the price range.
What approach to implementing trading ideas do you use in practice?
Follow new insights in our telegram channel.
No need to invent complex schemes and look for the "grail". Use the Resonance platform tools.
Register via the link — get a bonus and start earning:
OKX | BingX | KuCoin.
Promo code TOPBLOG gives you a 10% discount on any Resonance tariff plan.
Recommended articles


