BTC Market Review - February 24, 2026

The price has deviated toward abnormal levels amid prevailing market selling, but significant limit demand remains at the bottom. The market is trading sideways without breaking new lows.
Table of contents

In this market review, we do not attempt to predict the future; our task is to state the facts we have at the current moment. We base our actions on these facts, not on our expectations and hopes.
Market Orders and Limit Orders
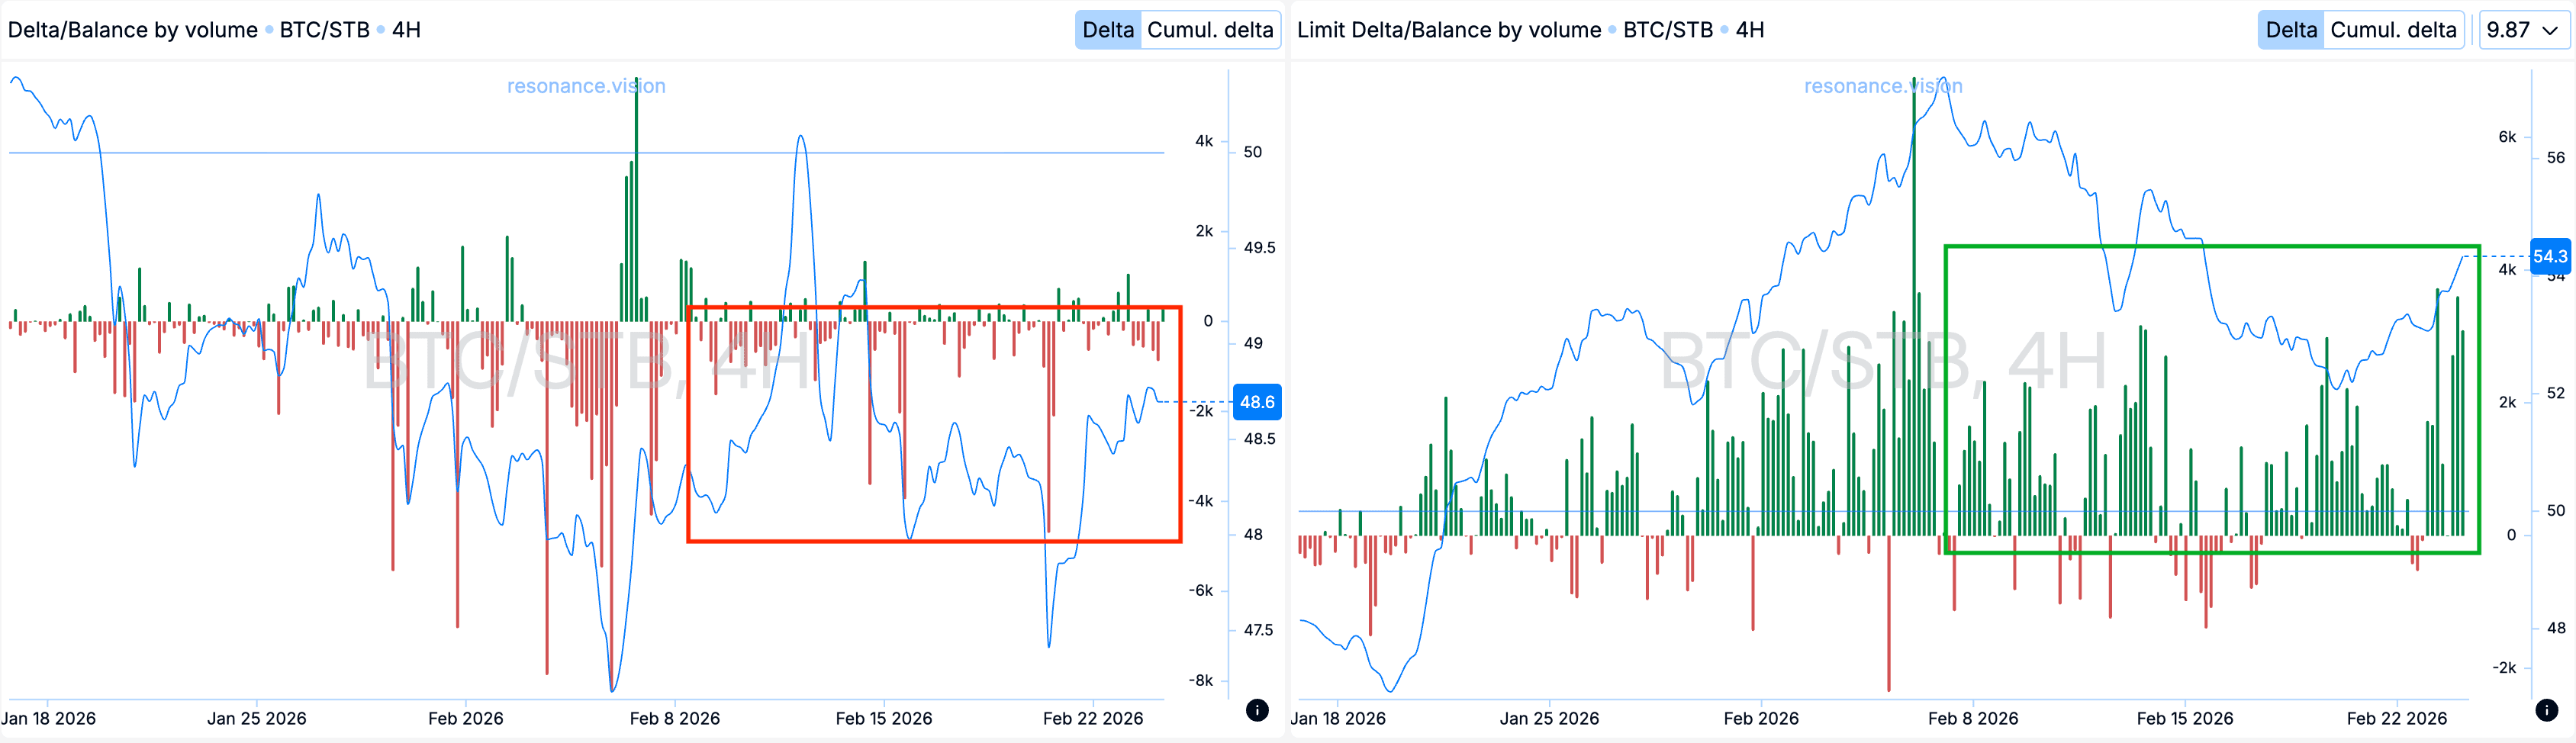
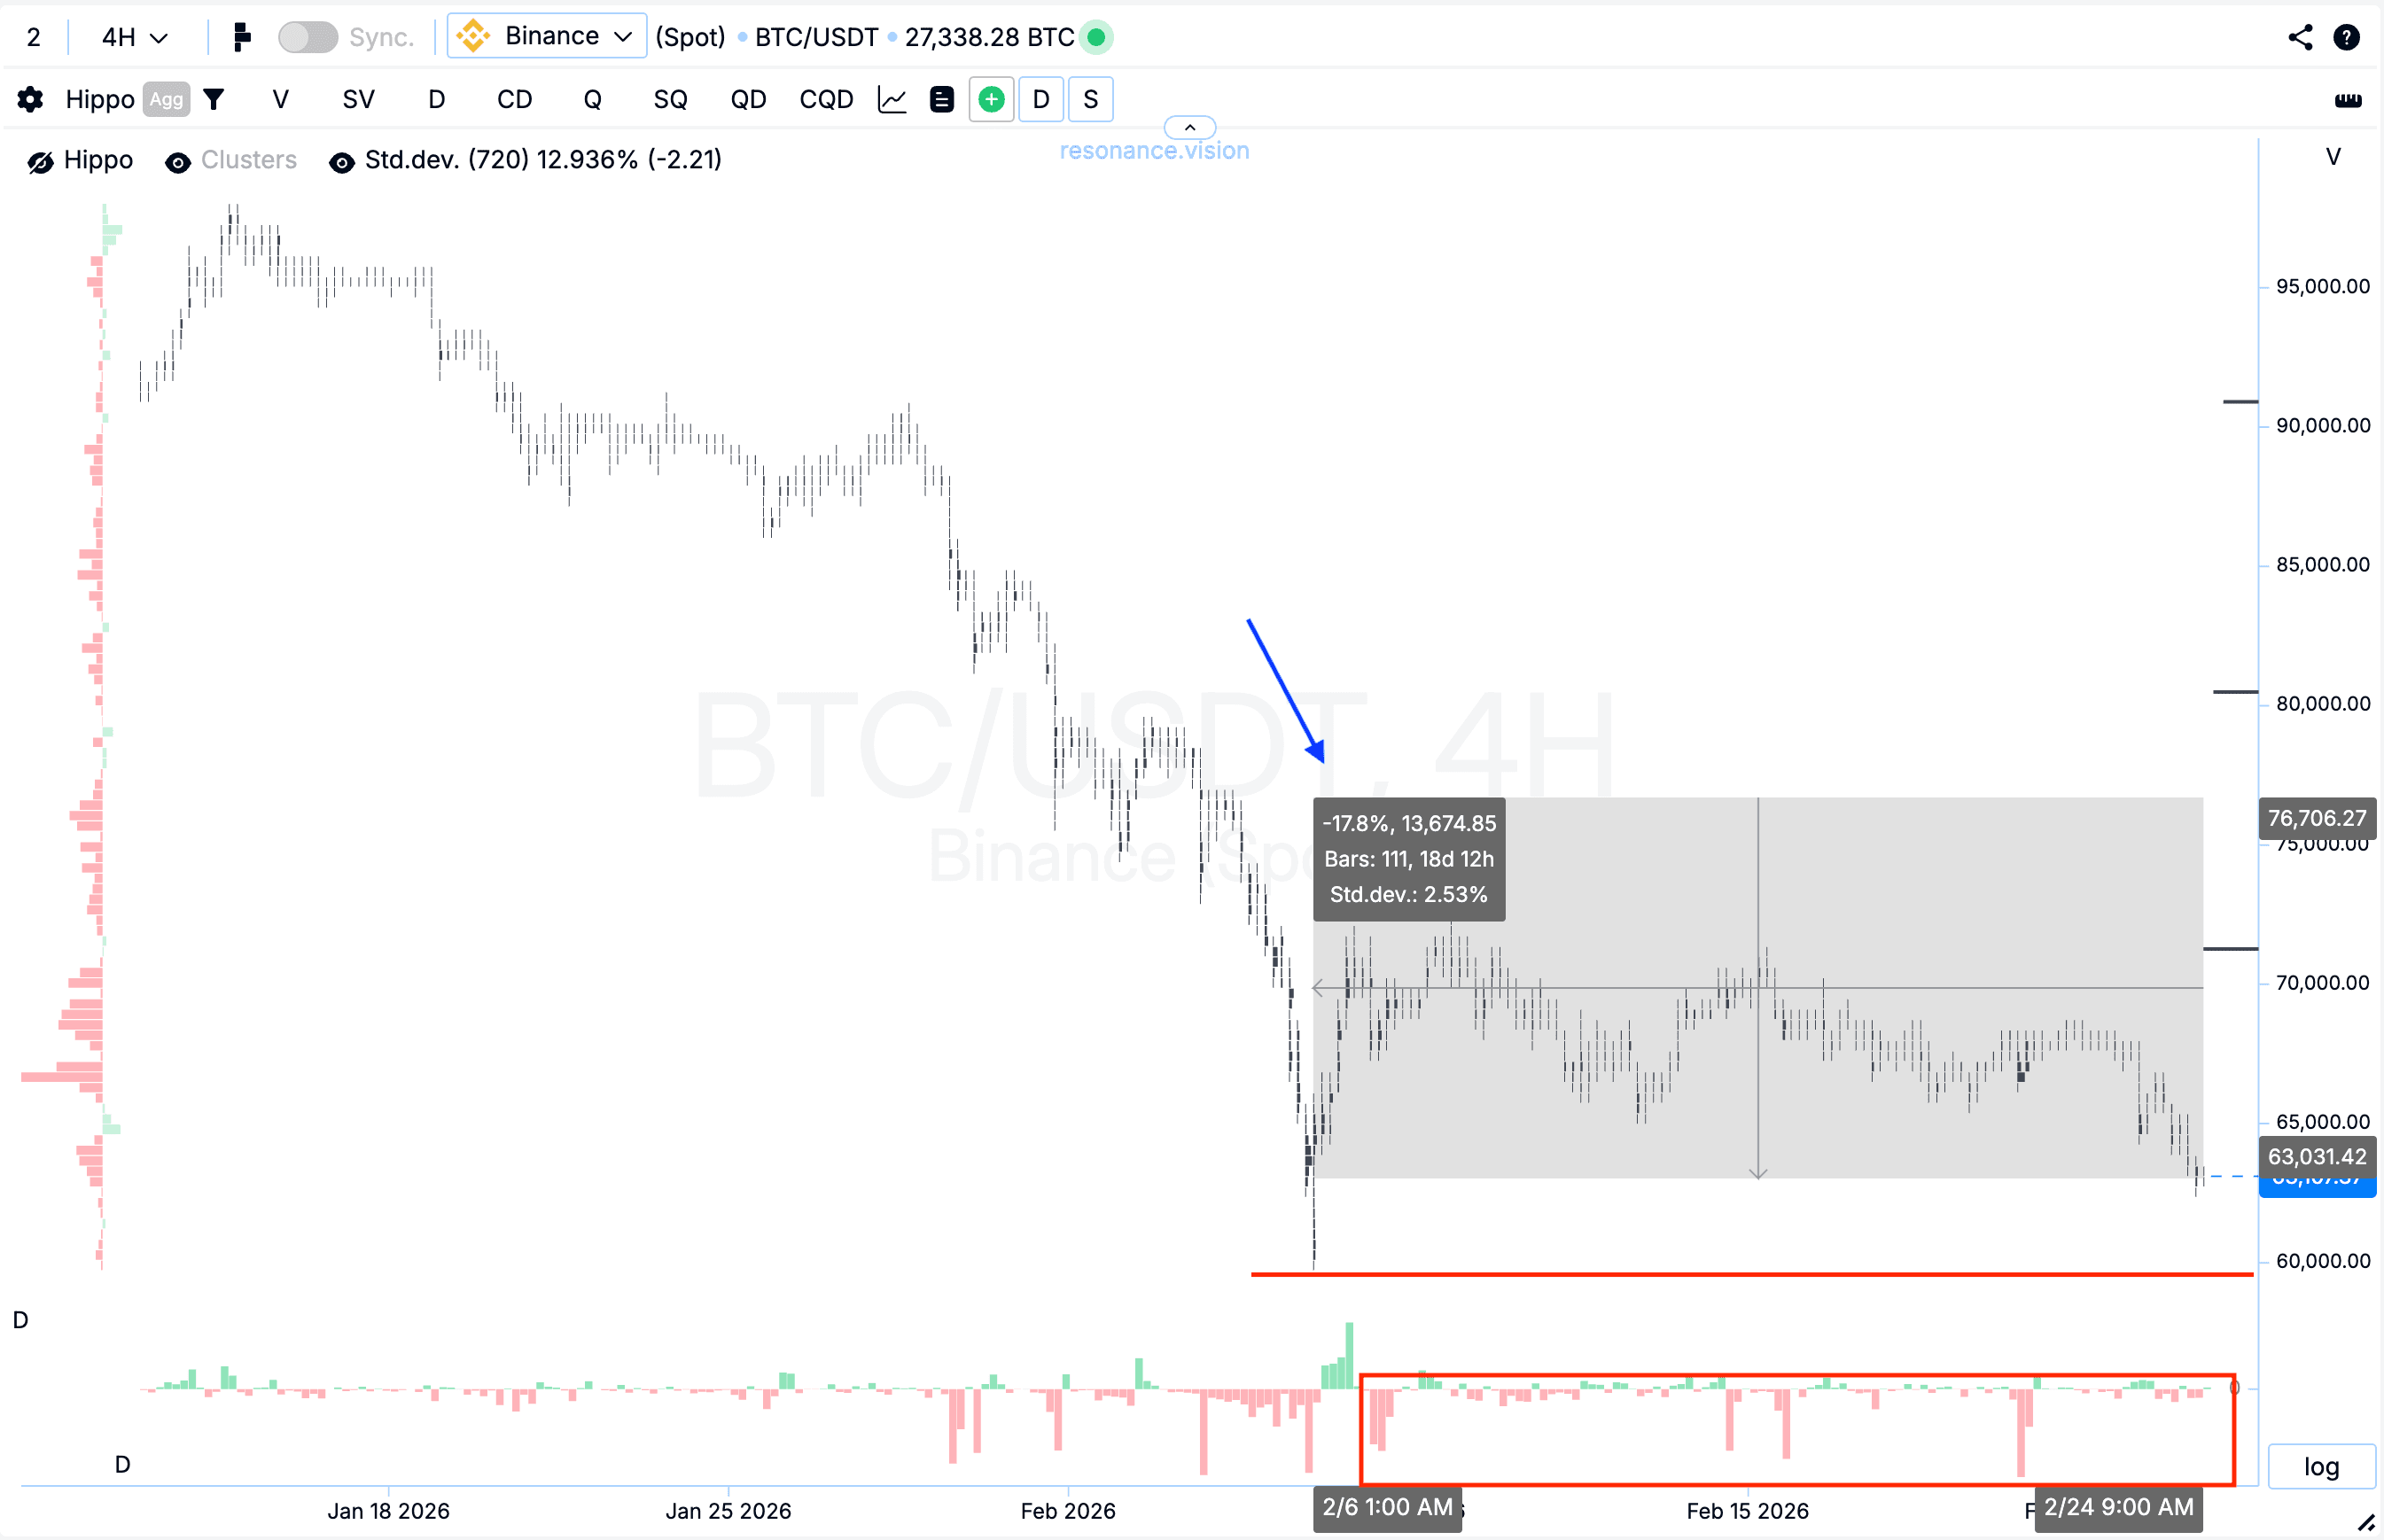
Over the period under review, aggregated market orders show a predominance of market sells. This is clearly reflected in the delta histogram (red rectangle) and indicates ongoing selling pressure.
At the same time, limit orders show a continued predominance of inserted buy orders; the extremes are marked on the chart (green rectangle). This indicates the presence of counter-limit demand in the current price range.
Z-Score (price)
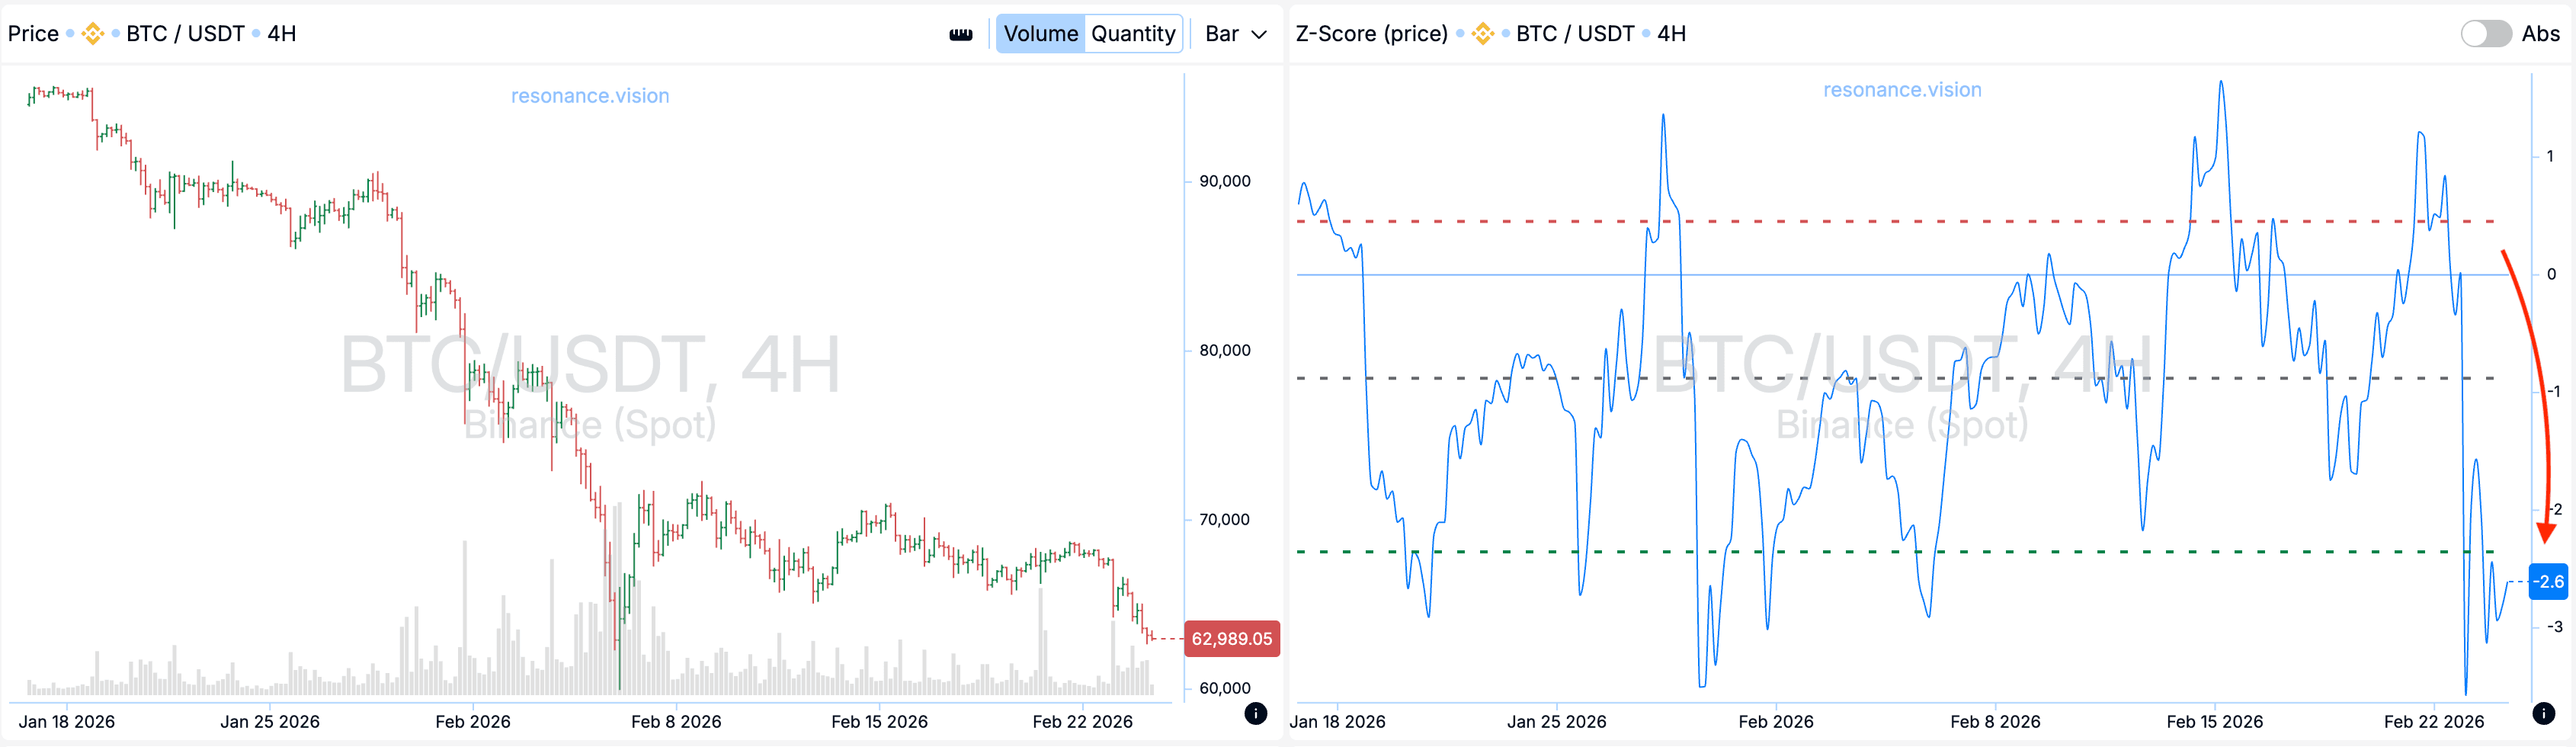
Currently, participants’ sales have pushed the price down to abnormal values - the current deviation exceeds 2 standard deviations (marked with an arrow), indicating a statistically significant deviation.
Heatmap in Volume Mode (blue rectangle)
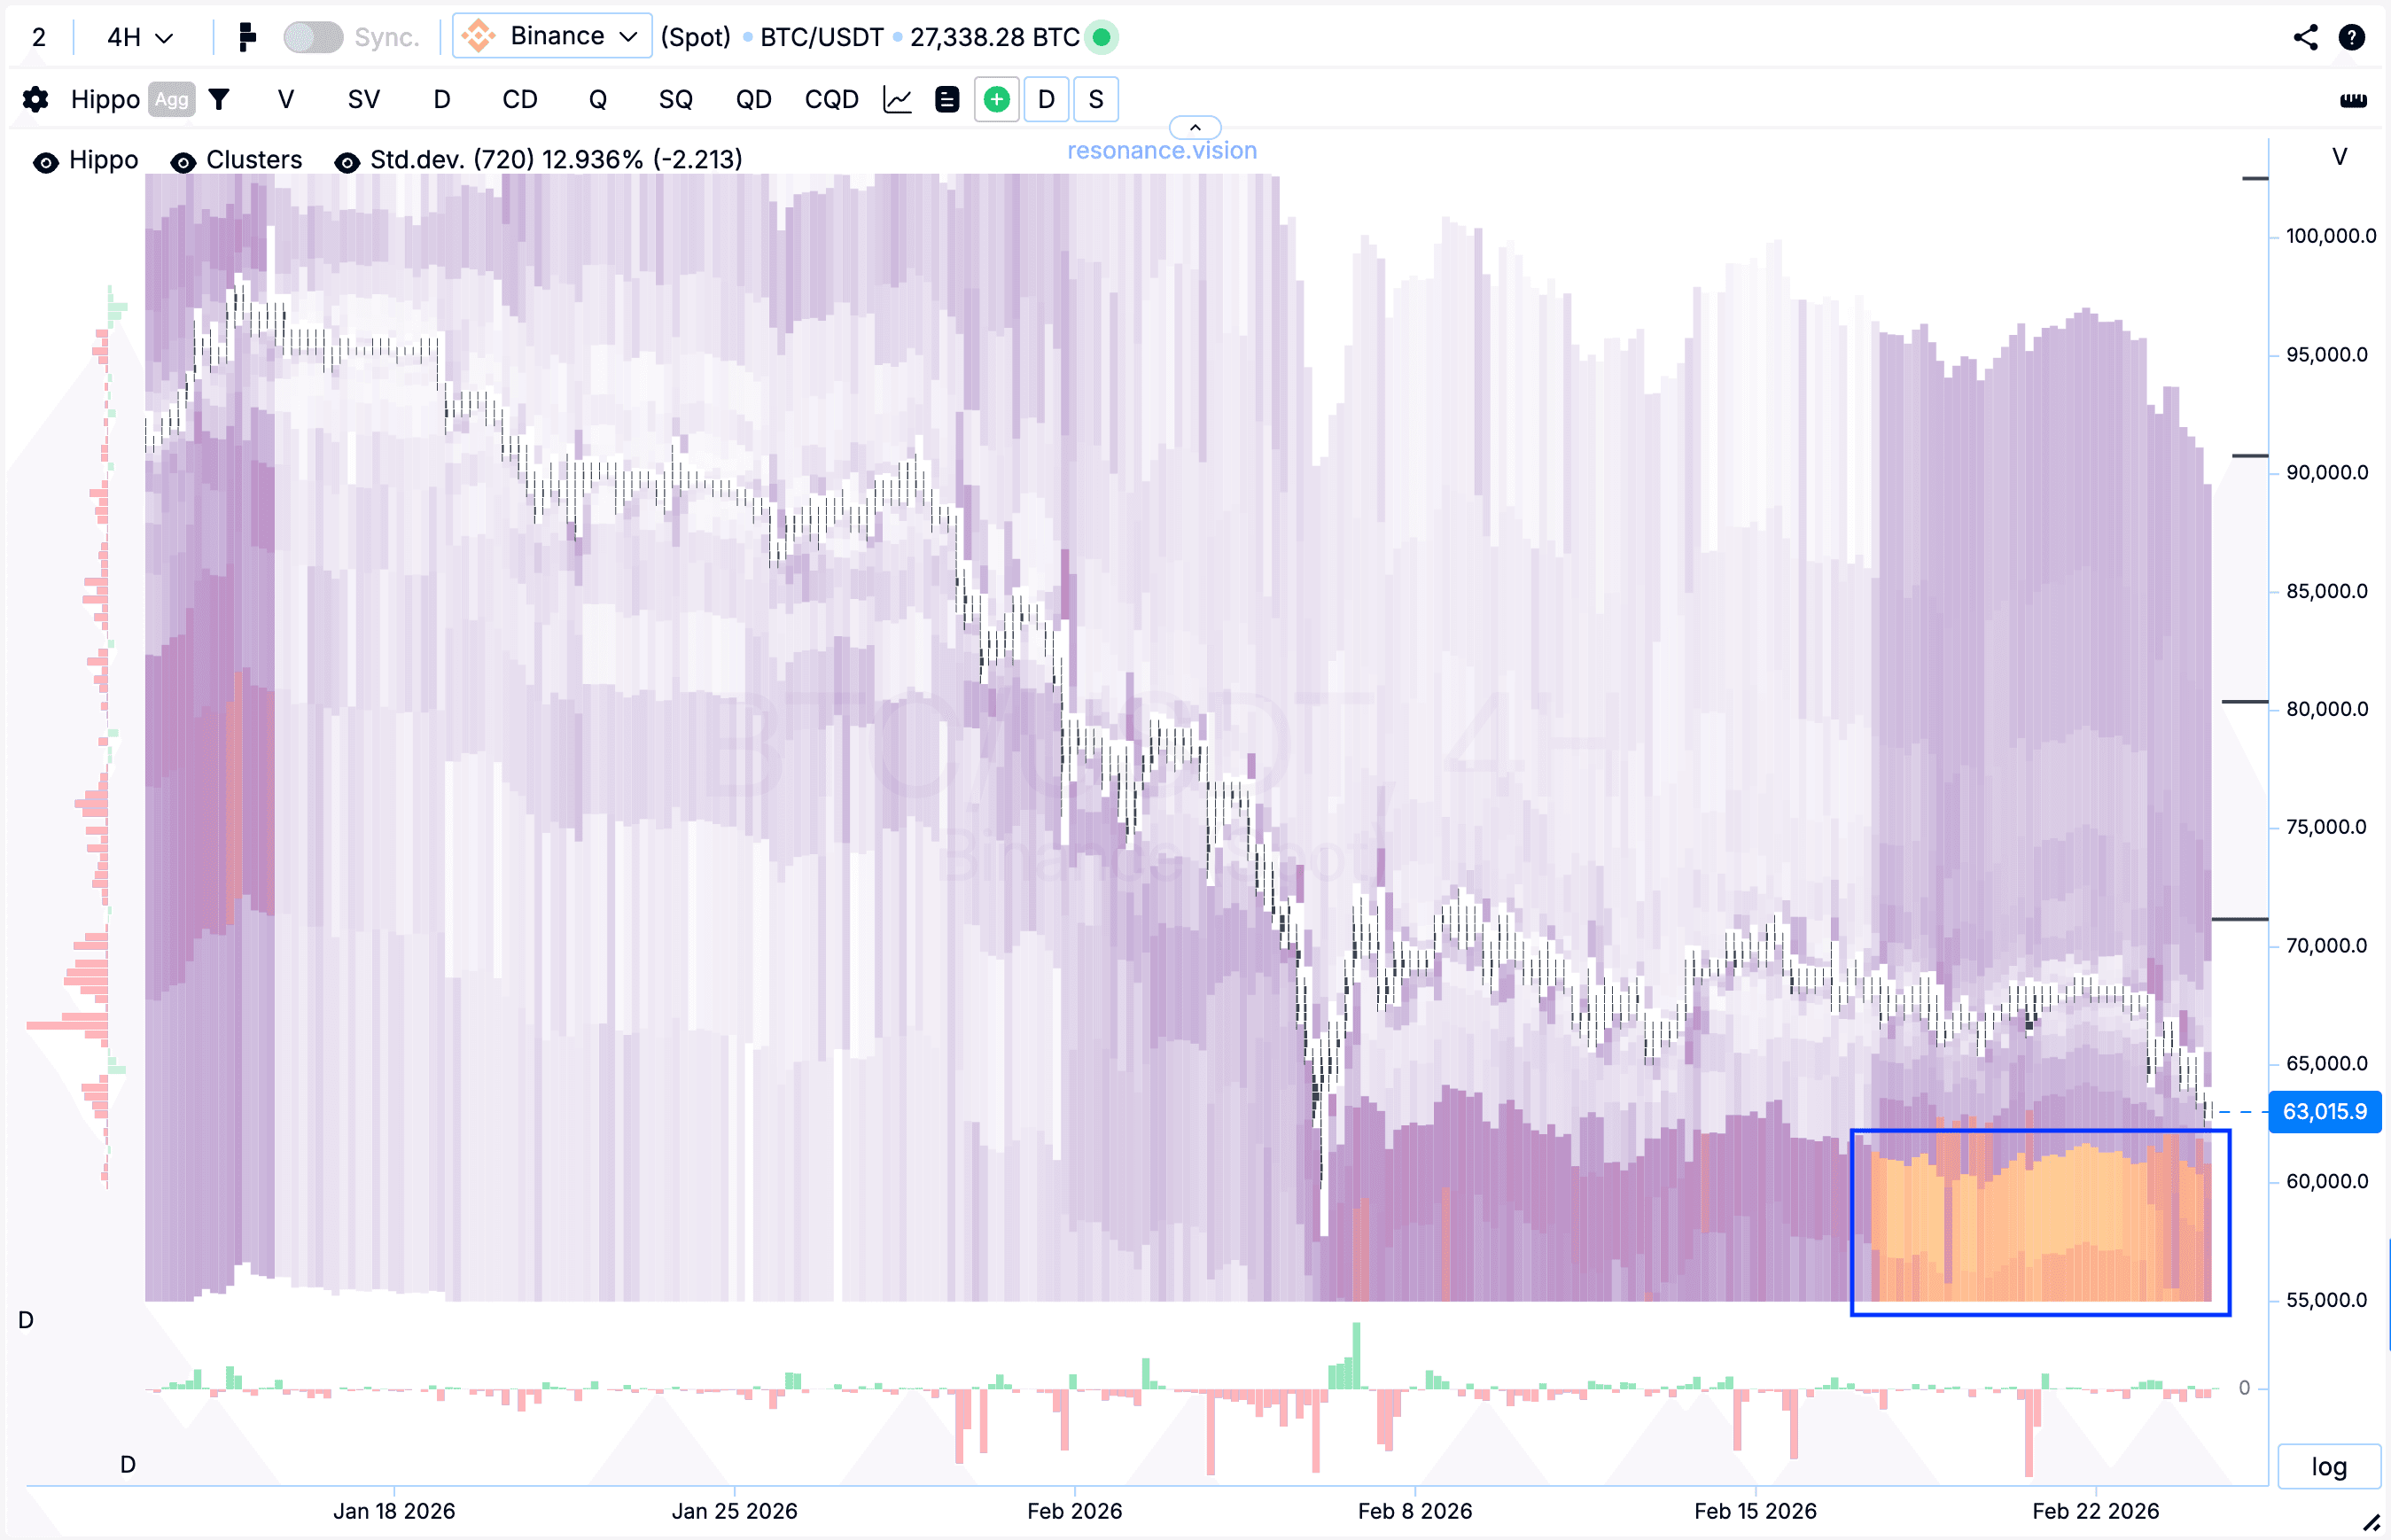
The heatmap shows abnormal clusters of limit buy orders slightly below the current price. Strong color intensity indicates a significant volume of liquidity placed in this zone.
Balance Index
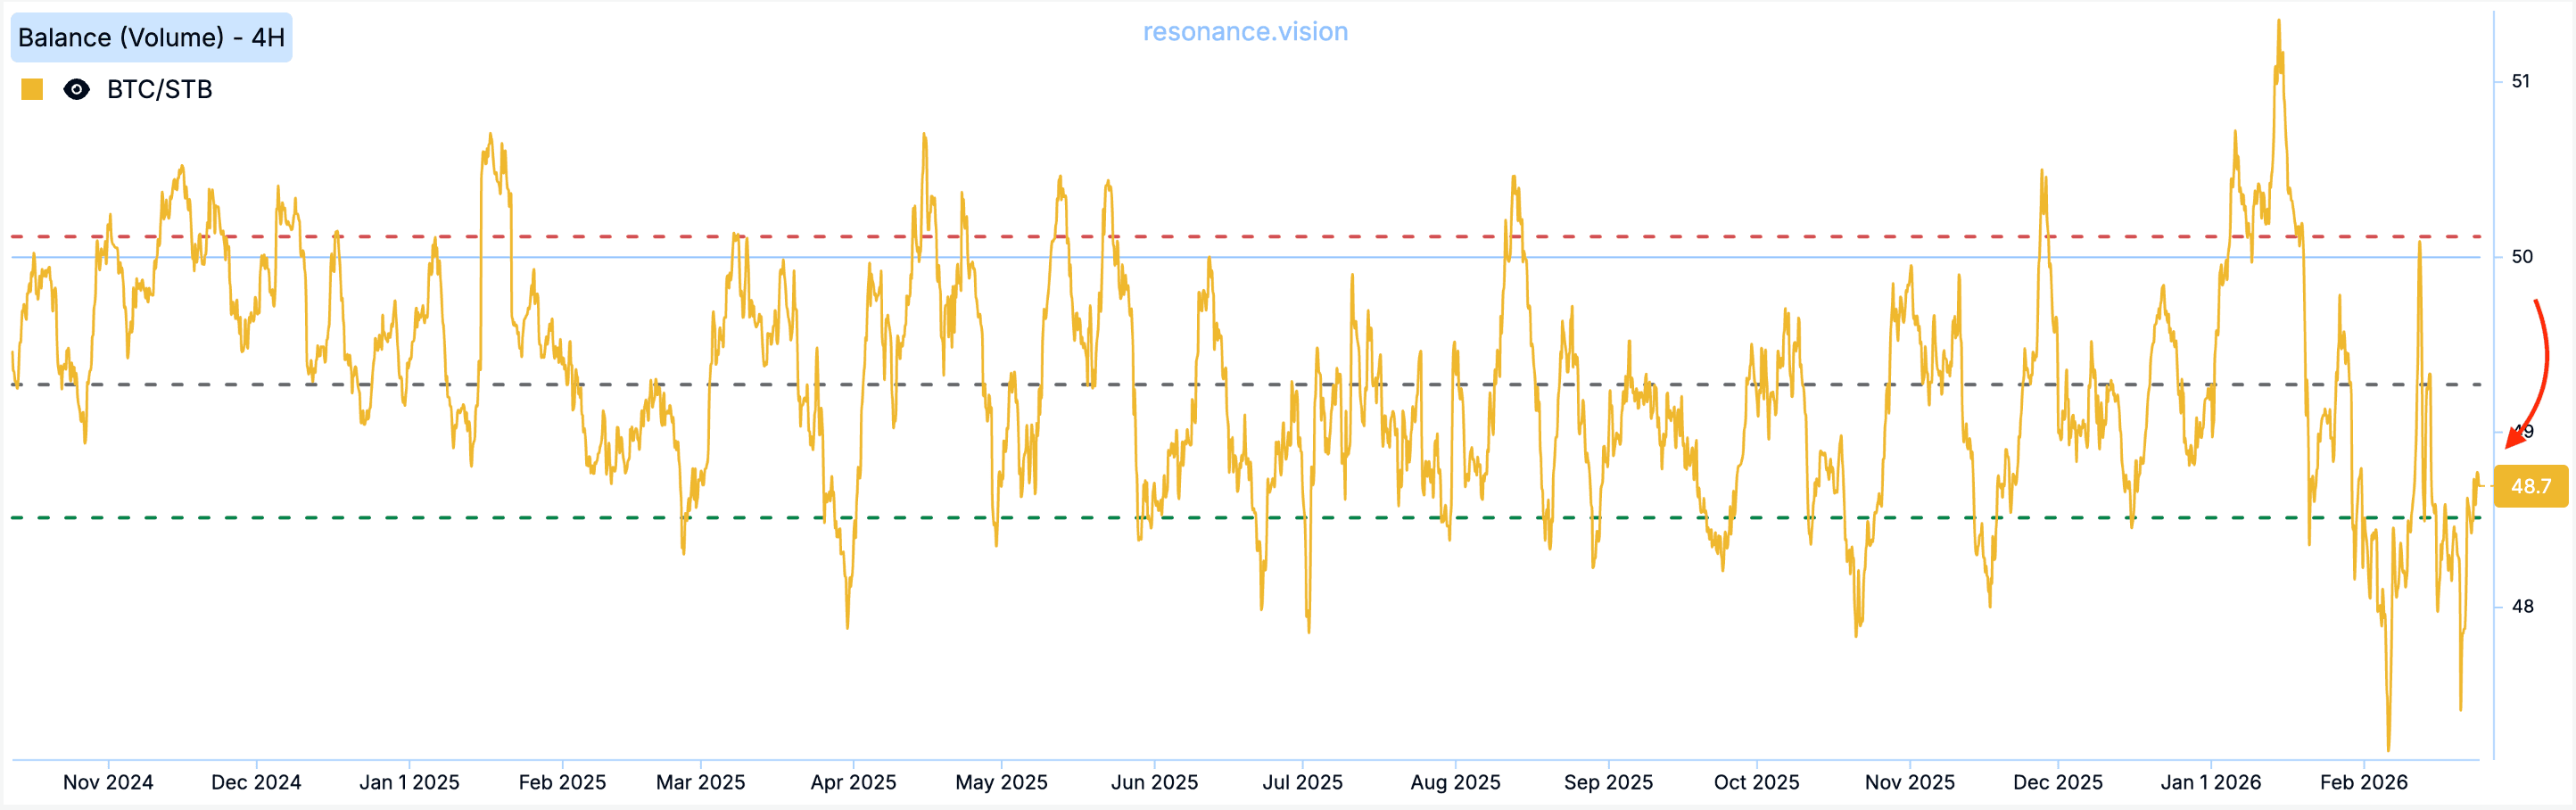
The balance index is slightly shifted downwards, but remains within normal percentile values, without entering the rare value zone.
Price Dynamics
Market orders continue to predominate, and the price is gradually declining. At the same time, the balance of limit orders is shifting upward, creating local support from limit demand.
Summary:
Currently, a sideways movement is observed with relatively low volatility. Selling pressure continues, but the local minimum has not yet been broken. Abnormal limit densities on the heat map remain in the current price range.
What approach to implementing trading ideas do you use in practice?
Follow new insights in our telegram channel.
No need to invent complex schemes and look for the "grail". Use the Resonance platform tools.
Register via the link — get a bonus and start earning:
OKX | BingX | KuCoin.
Promo code TOPBLOG gives you a 10% discount on any Resonance tariff plan.
Recommended articles


