Cluster Chart and Whale Buying Analysis on HYPE Token

In this article, we will thoroughly review the latest news and analyze the HYPE token, with particular attention to the activity of large players — so-called whales. We will examine the current situation and the token’s prospects, why it’s important to look beyond headlines and emotional market reactions, and focus on real supply and demand data. We’ll also explore how the cluster chart helps understand trading dynamics.
Table of contents

Contents
- What’s Happening with HYPE Token
- Exchange Revenue Growth and Its Impact on HYPE
- Cluster Chart Analysis: Higher and Lower Timeframes
- Situation on Other Exchanges and Liquidity
- Risks and Entry Recommendations
- Conclusions
What’s Happening with HYPE Token
Recently, news emerged that a mysterious wallet has been actively purchasing HYPE token. This triggered a wave of discussion, especially among traders who became anxious amid falling market sentiment. However, it’s important to understand that price movement is driven not by emotions, but by money — real buys and sells. Emotions are subjective feelings, while the cluster chart shows objective data on where and how large trades are being executed.
The news that sparked the discussion mentions technical indicators like Stochastic RSI, which allegedly signals a decline. But how accurately do these indicators reflect the market’s fundamental condition? It’s worth remembering that indicators based solely on price charts don’t always provide a full picture — especially in volatile conditions. Read more in the article “What’s Wrong with Technical Analysis”
Exchange Revenue Growth and Its Impact on HYPE
One of the key reasons why HYPE has attracted attention is a news item reporting significant growth in revenue of the exchange where it is traded. This is a positive signal, as rising exchange income suggests increased trading activity and interest, which in turn can support the token’s price.
However, it’s crucial not to get carried away by catchy headlines — we should look deeper. What matters more is real spot market activity — who is buying or selling and in what volumes. The cluster chart is essential here, as it helps detect whale accumulation and zones where supply or demand shortages are forming.
Find out who the whales are in the cryptocurrency market, how to track their actions, and how to use their strategies for your own profit - read the article “Follow the whale: how big capital thinks and how a trader should act”
Cluster Chart Analysis: Higher and Lower Timeframes
For an objective evaluation, we look at multiple timeframes. On the daily chart, HYPE shows an uptrend with a 249% price increase since April.
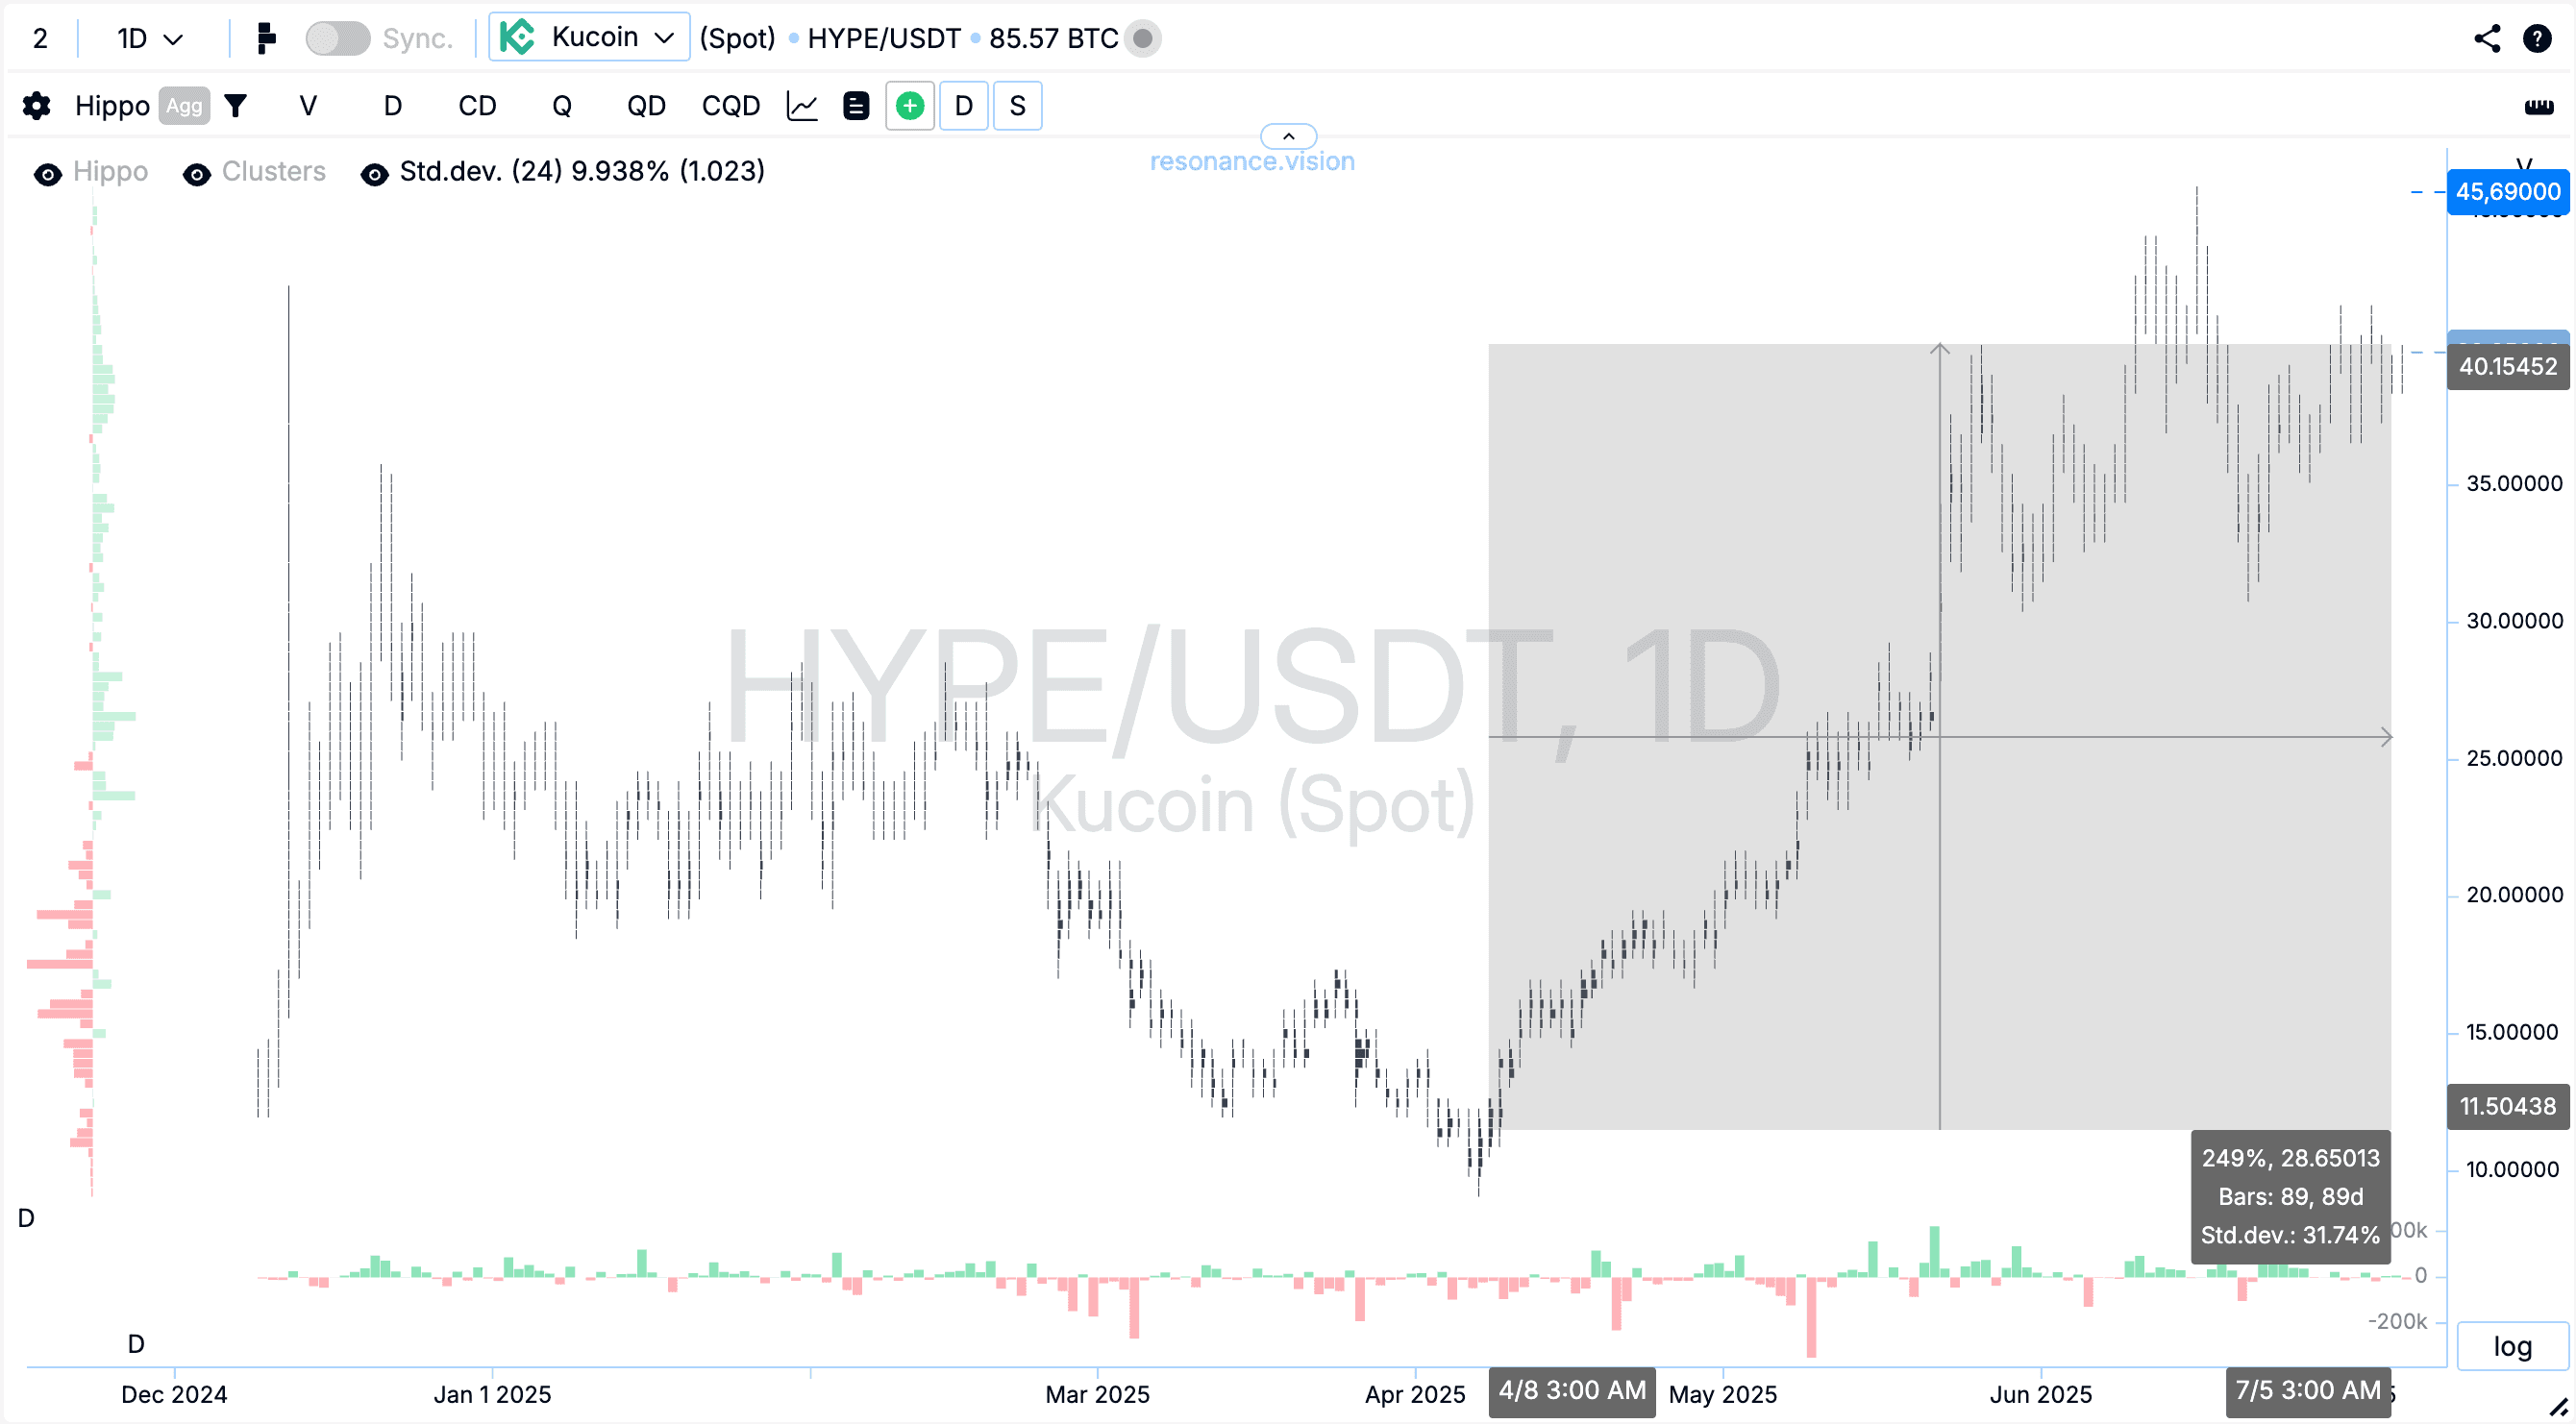
At the same time, volatility remains high — a classic sign of an active market, where large buyers support price but prevent it from surging too sharply.
On the lower H4 timeframe, the situation is intriguing: significant buying volumes appear, indicating participant activation.
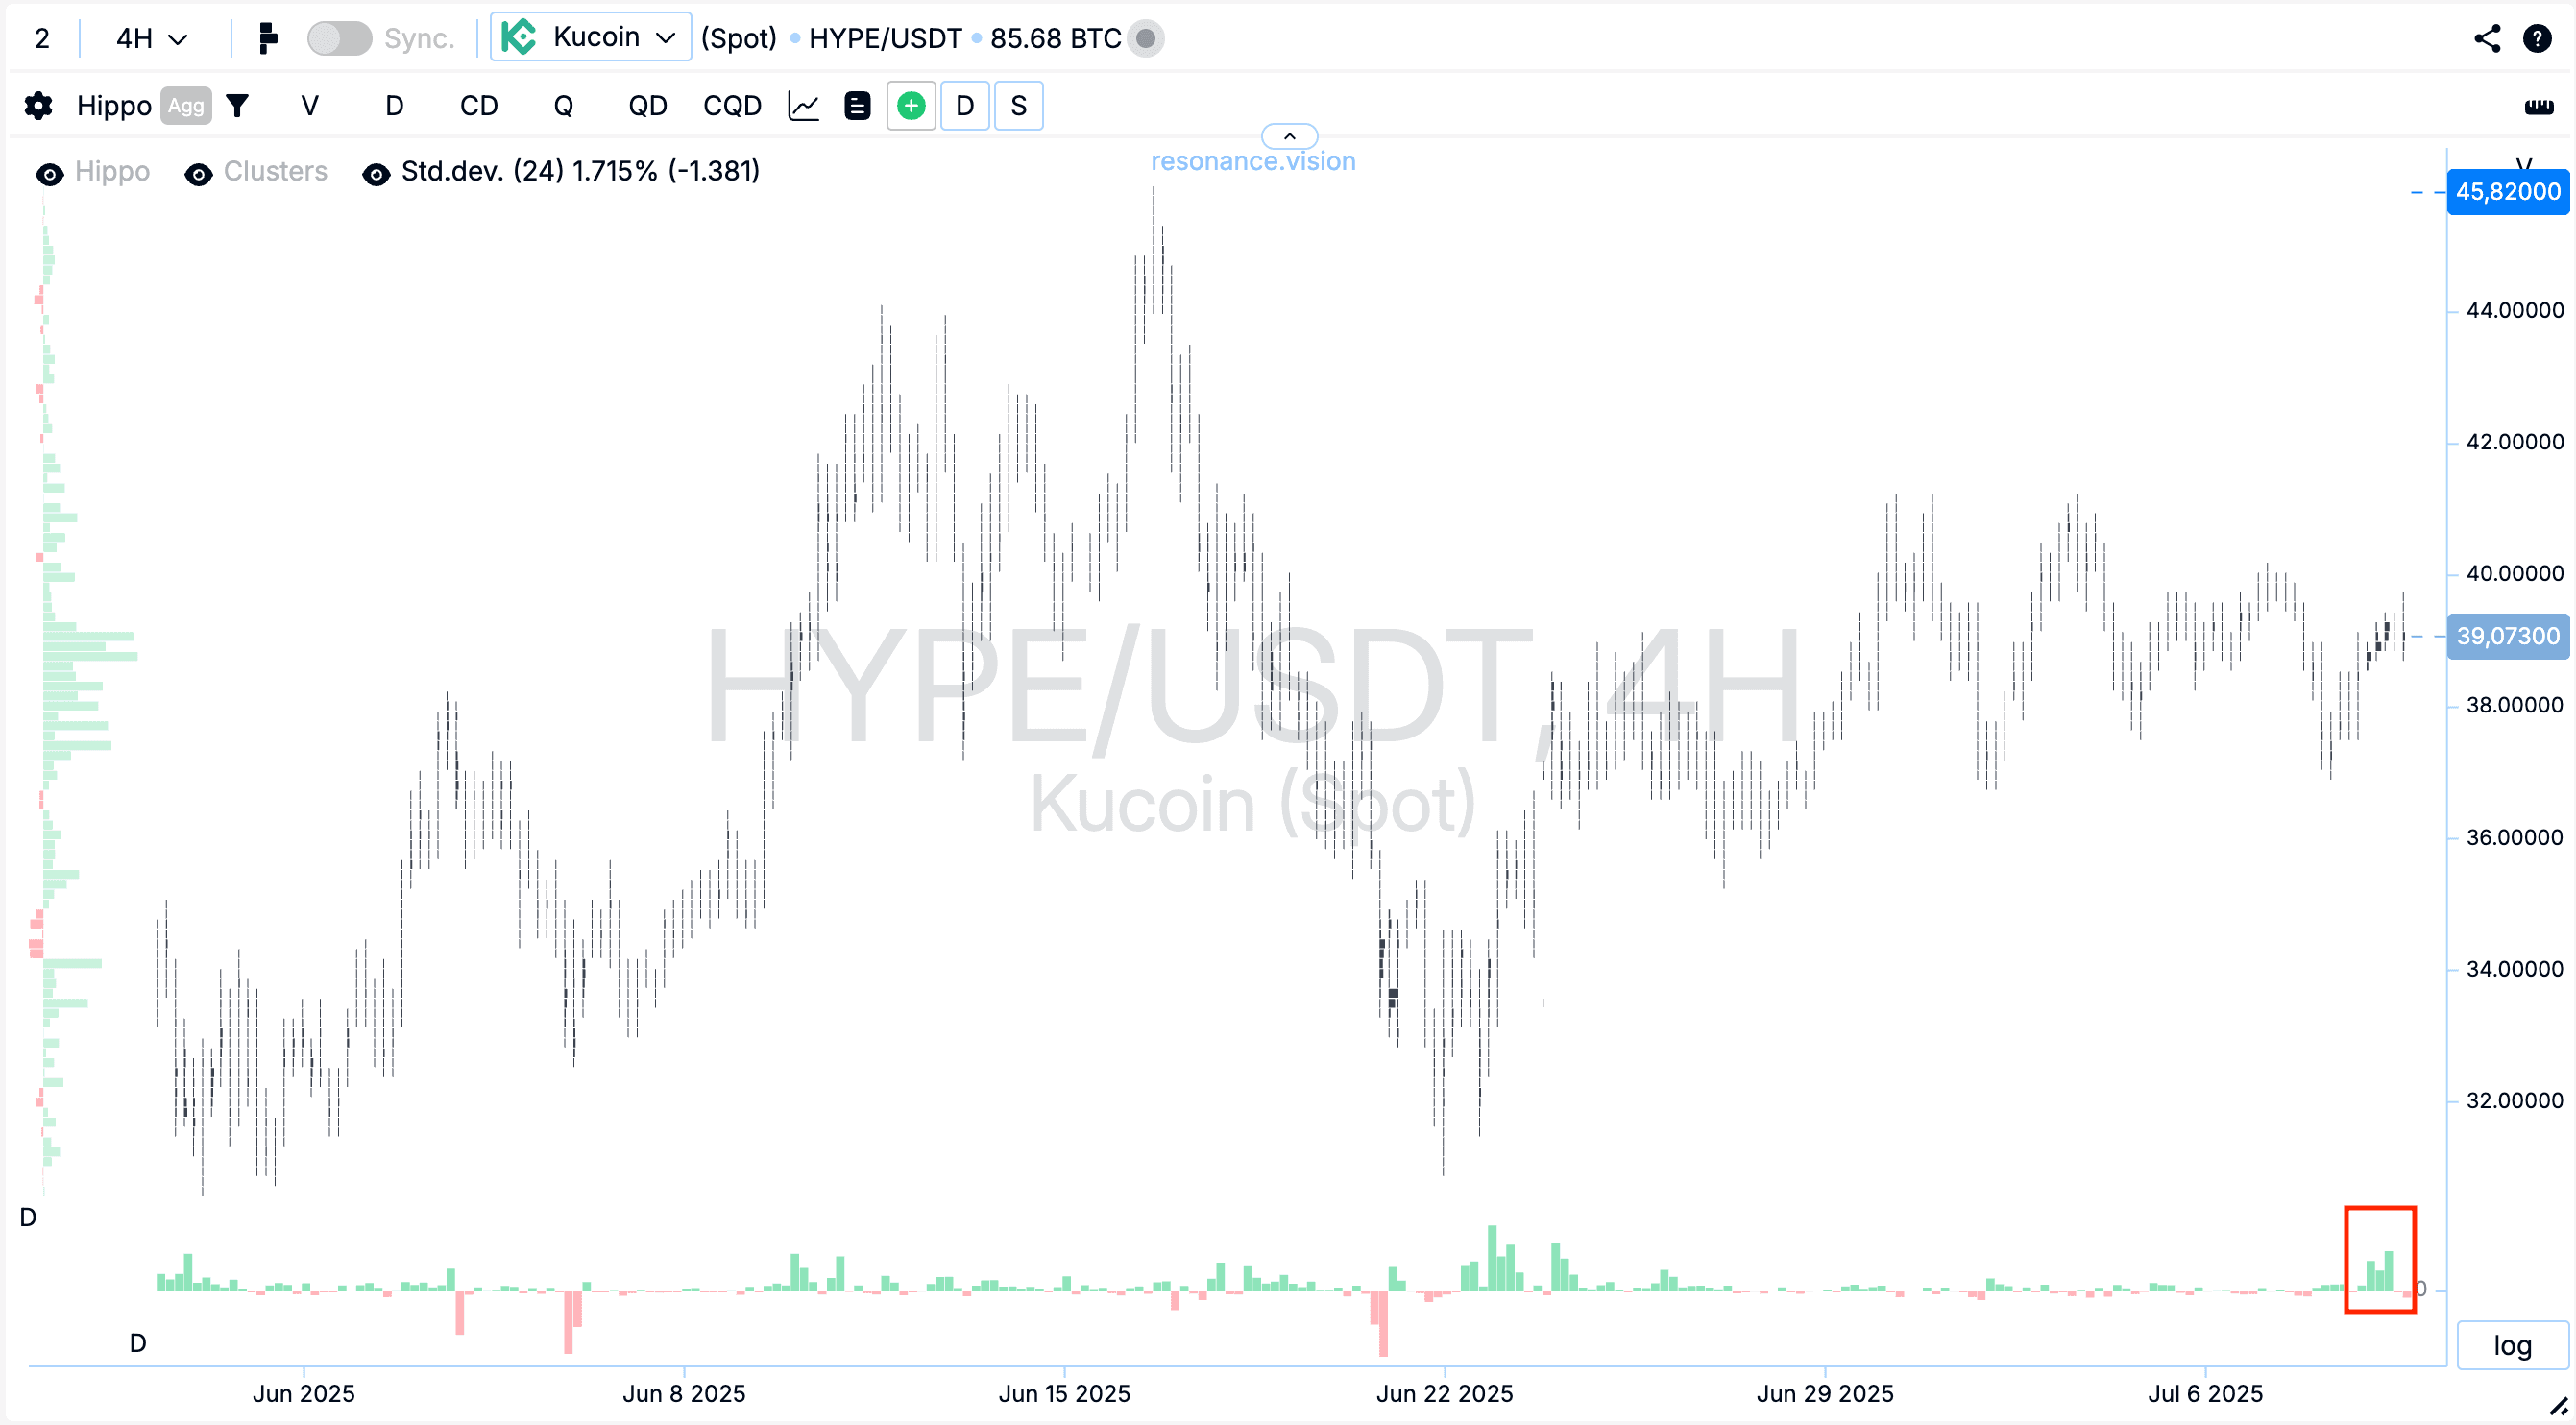
This is a good sign that suggests position accumulation. However, the price slightly pulls back — a normal behavior reflecting a balance between buyers and sellers.
It’s important to note that the presence of buys and an uptrend does not automatically mean it’s the perfect time to go long. The price could retrace, and there’s not yet strong confirmation of a sustainable uptrend with clearly higher lows and highs.
Situation on Other Exchanges and Liquidity
Looking at HYPE’s trading activity on other exchanges, we see a mixed picture.
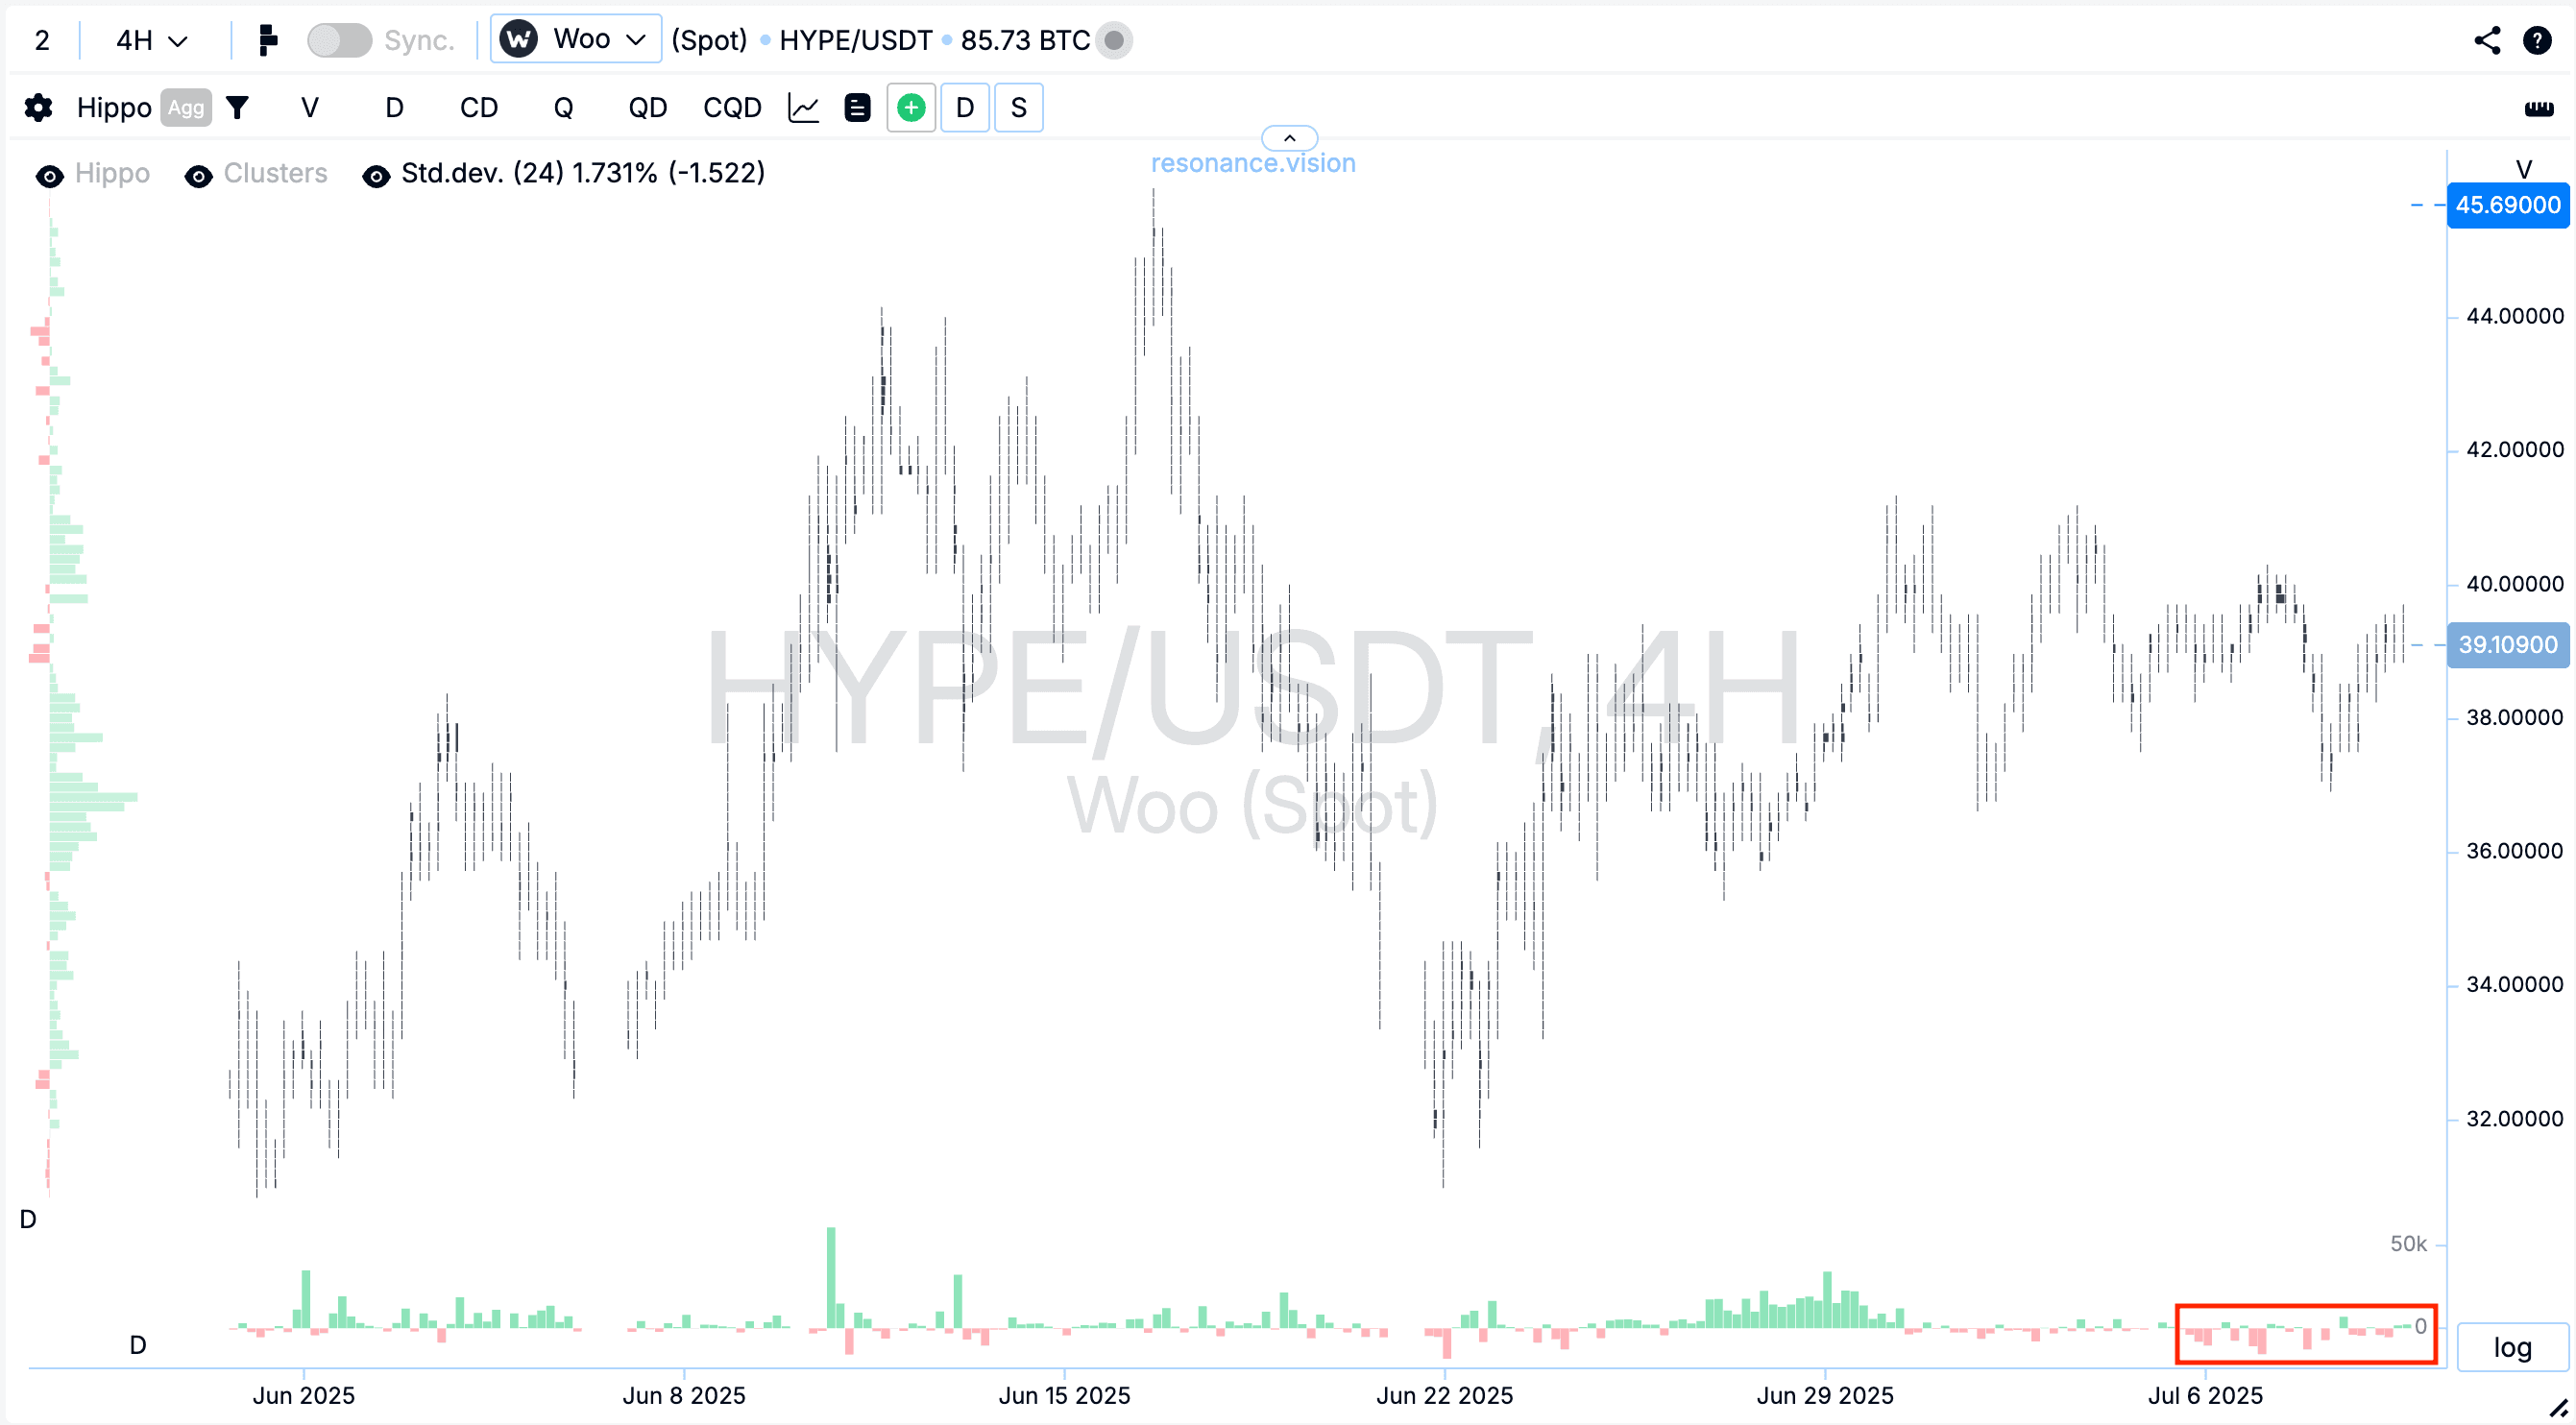
There are sell orders, but no significant price drop; buys are present, but there’s no global upward breakout either. Liquidity is decreasing on these exchanges, which may limit further price action.
From a cluster chart perspective, this points to market participant consolidation — they are accumulating positions, preparing for a possible move. However, we don’t yet see clear signs of a new strong trend emerging.
Risks and Entry Recommendations
If you haven’t opened a HYPE position since late April, entering the market now carries a high level of risk.
To safely open a long position, it’s important to wait for confirmation of a sustainable uptrend, characterized by:
- The appearance of higher lows and highs on the chart
- Strong selling activity at local lows without significantly dragging the price down
- Active buying that leads to price growth
You should monitor the market for about a week or week and a half to see if such a trend is forming. For now, it’s better to add the token in notes and observe its dynamics, rather than act on emotions or hype.
Conclusions: Ignore Headlines — Focus on Cluster Charts and Real Data
To summarize, it’s vital to remember that market prices are determined by capital flow, not emotions. The cluster chart is a powerful tool that shows real buying and selling, helping you understand who is influencing the price and how.
The exchange revenue growth news is a good fundamental signal for HYPE, but trading decisions must be based on multi-timeframe data and a complete market picture.
Avoid rushing into a position without trend confirmation. Track supply and demand, manage risks, and base your trading on analysis — not emotional reactions.
If you want to stay updated and receive high-quality analysis, I recommend subscribing to the Resonance channel and joining the Telegram trading community.
Follow new insights in our telegram channel.
No need to invent complex schemes and look for the "grail". Use the Resonance platform tools.
Register via the link — get a bonus and start earning:
OKX | BingX | KuCoin.
Promo code TOPBLOG gives you a 10% discount on any Resonance tariff plan.
Recommended articles


