What Is a False Breakout and How to Identify It

A breakout can look convincing: the price crosses a level, volume appears, and traders rush into the move. But what if that impulse is only a trap? In this article, we look at what really happens behind a false breakout and why volume, delta, and price reaction matter more than the level itself.
Table of contents
- 01Why a False Breakout Happens in Trading
- 02What Happens Inside the Market
- 03How to Identify False Breakout Conditions
- 04Main False Breakout Pattern Scenarios
- 05False Breakout Upward
- 06False Breakout Downward
- 07Breakout Confirmation
- 08Common Trader Mistakes
- 09How to Trade False Breakouts with Resonance
- 10Conclusion

A false breakout in trading is a situation where the price moves beyond a previous high or the boundary of a range, but does not receive support and returns back.
On the chart, it looks simple: the price breaks a certain price level, some participants enter in the direction of the breakout, but the move does not develop further. Instead of continuing, the price returns to the previous range.
But the key point is not the return itself. A false breakout of a level is the absence of a result after high market order activity. In other words, volume traded, participants actively bought or sold, but the price failed to consolidate and continue the move.
That is why in trading, any breakout should not be treated as a ready signal to enter a trade in the direction of continuation. A “level” means an area of interest, but it does not guarantee the price direction. The price can cross a level dozens of times, but only in rare cases does it lead to a sustainable move. It is important to understand what stands behind the move: real demand or supply, triggered stops, or sustained pressure from participants.
Why a False Breakout Happens in Trading
To understand the nature of a false breakout, you need to look at market mechanics and liquidity. In certain areas of interest, stop orders often accumulate. When the price moves beyond such an area, one large stop or a series of closely placed stops may be triggered. This launches a chain reaction: some participants close positions, while others see the breakout and start trading in the direction of the breakout.
This creates a sharp impulse move. On a regular chart, it may look like the beginning of a strong trend. But what happens next is decided by demand and supply: whether there is continuation.
If, after the stops are triggered, participants continue to push the price with market orders, that breakout can become real.
If there is no support, the impulse quickly fades. The price returns because there was no sustained demand or supply behind the move.
This is how a false breakout in trading forms: there was activity, volume traded, but there was no result in the form of further price movement.
What Happens Inside the Market
The price does not move because there is some line or level on the chart. The price moves because of market orders.
If buyers are actively buying at market, they execute limit sell orders and push the price higher. If sellers are actively selling at market, they execute limit buy orders and push the price lower.
But if, after an upside breakout, buyers meet strong limit supply, the price may stop. There are buys, delta is positive, volume is high, but there is no continuation. This means the buyer is spending effort but not getting a result.
With a downside breakout, the logic is the same. Sellers pressure the market, delta is negative, but the price does not continue falling. This may indicate limit support: sales are being absorbed, and the move is losing strength. That is why trading breakouts requires evaluating not only the direction of the impulse, but also the result that this impulse produced in the price.
The best way to read such situations is to compare market activity with the actual price reaction. On spot pairs, this is especially important because spot activity often shows the real balance between demand and supply more clearly than a simple candlestick view.
How to Identify False Breakout Conditions
To understand how to identify false breakout conditions, you need to check whether volume produced a result. If a false breakout trading strategy is based only on the fact that the price crossed a level, without analyzing volume and price reaction, the risk of a false entry increases significantly.
Main signs:
- The price quickly returns beyond the level.
- The breakout happened, but the price did not consolidate.
- There is volume, but no continuation.
- Market orders pushed the price, but the price failed to develop the move.
- Delta is not confirmed by price.
- Positive delta without growth or negative delta without a decline is an important weakness indicator.
- Absorption is visible on clusters.
- Participants are actively trading, but opposite limit resistance holds the move back, and large cluster accumulations appear.
The best confirmation is not the breakout candle itself, but the continuation after it. If you want to find a real breakout, look for a situation where volume, delta, and price reaction support the same direction. If these elements diverge, it is better to avoid treating the breakout as confirmed.
Main False Breakout Pattern Scenarios
False Breakout Upward
A false breakout upward happens when the price moves above the range into a resistance area but cannot continue growing.
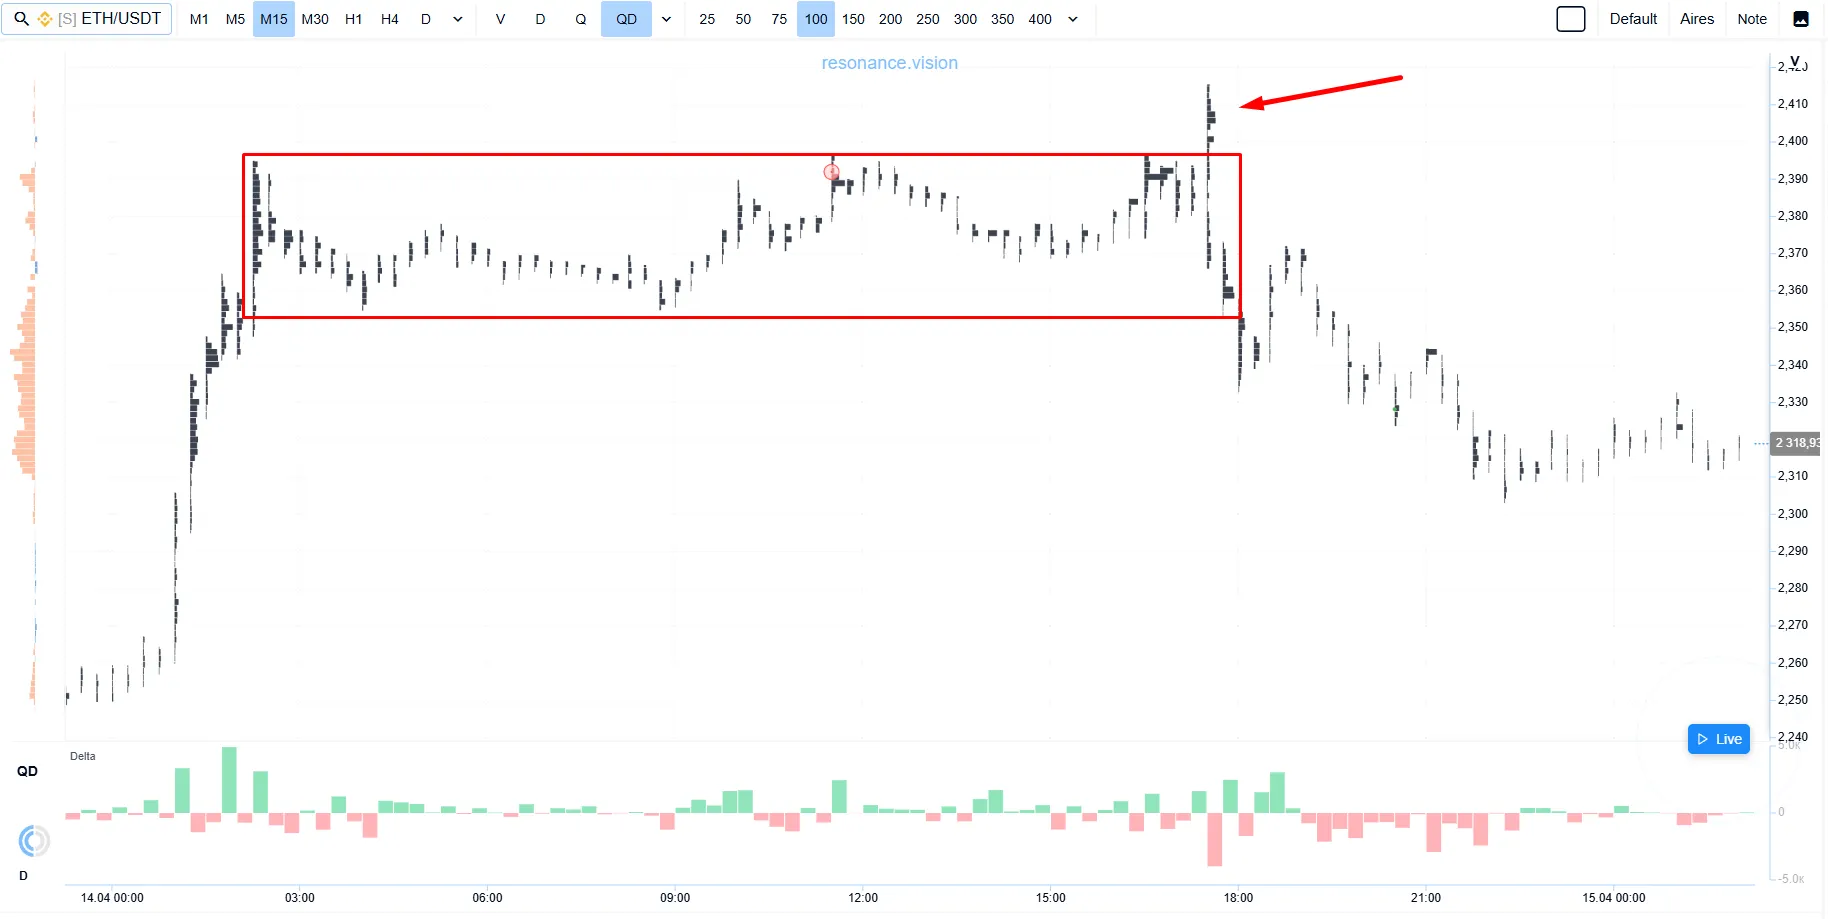
This scenario often points to a limit seller. The seller absorbs market buys and does not allow the price to consolidate above the price range. As a result, the breakout turns into a return.
Here is another example of a false breakout upward.
The price breaks the previous high level, marked with the blue line, but does not grow further.
On the delta histogram, marked with the green arrow, we can see that at first the buyer was active, shown by the green bar, and the price managed to rise. But almost immediately, selling appeared, shown by the red bar, and the price returned to the range.
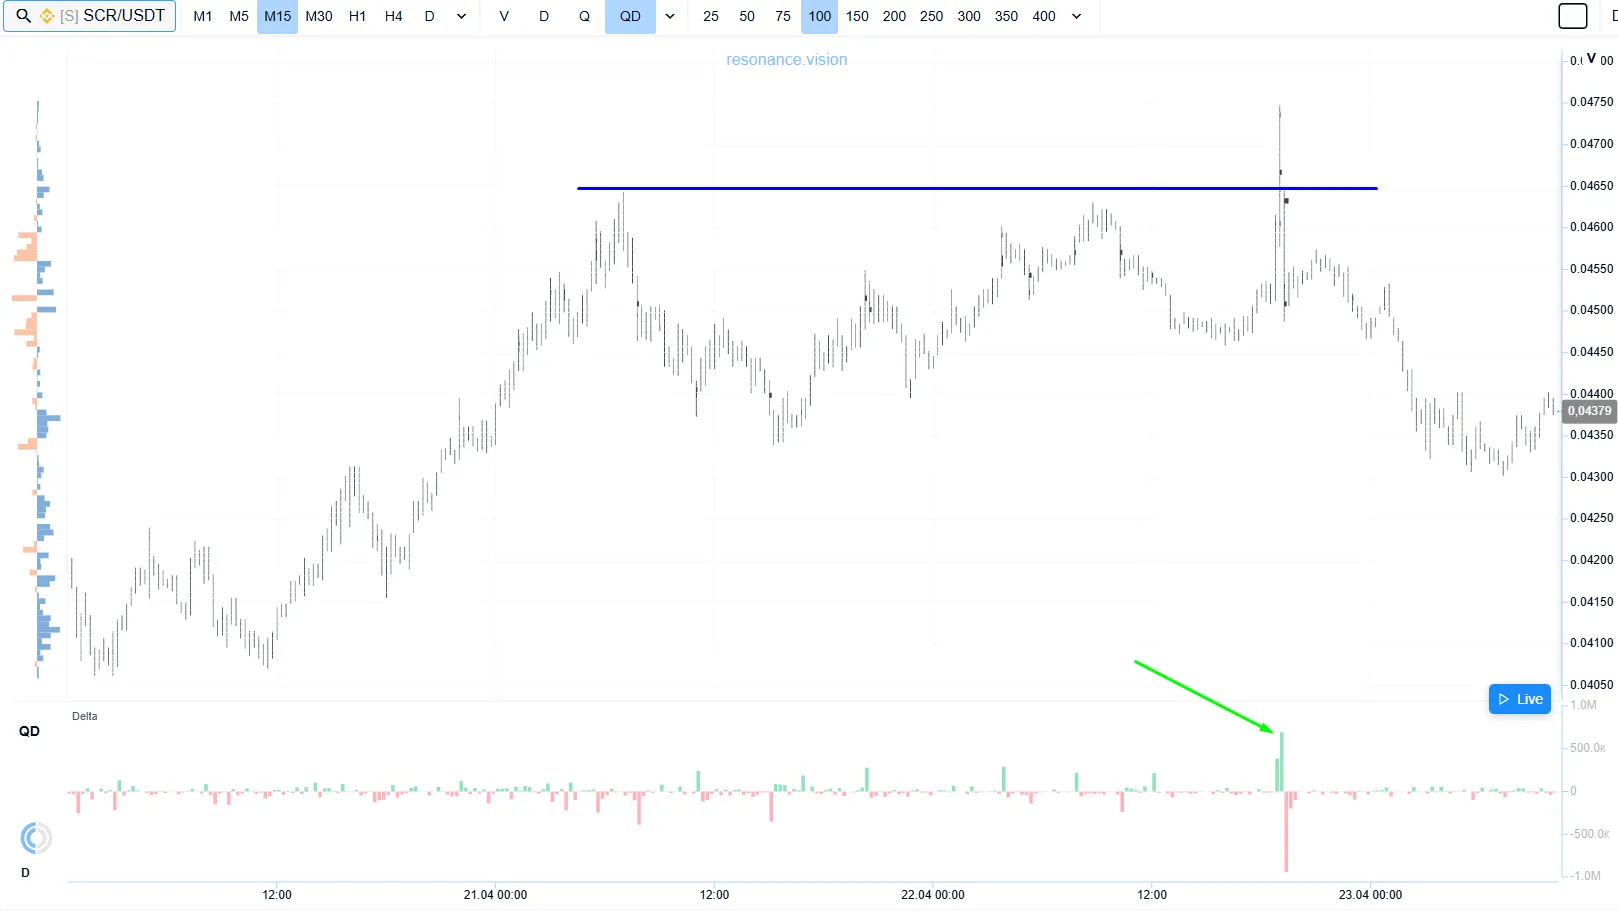
Here we can clearly see a scenario with triggered stop-losses, because when a stop-loss in a short position is triggered, a market buy occurs. If this is a series of stop-losses, it is clearly visible through a tall green delta bar, which shows the dominance of market buy orders. Such a delta spike is not a standalone indicator of strength; it must be compared with the price result. The mirror situation also applies to triggered stop-losses on long positions.

False Breakout Downward
A false breakout of a level downward works in the opposite way. The price moves below the “support level,” buyers’ stops are triggered, and market sales appear. It seems that a decline is starting.
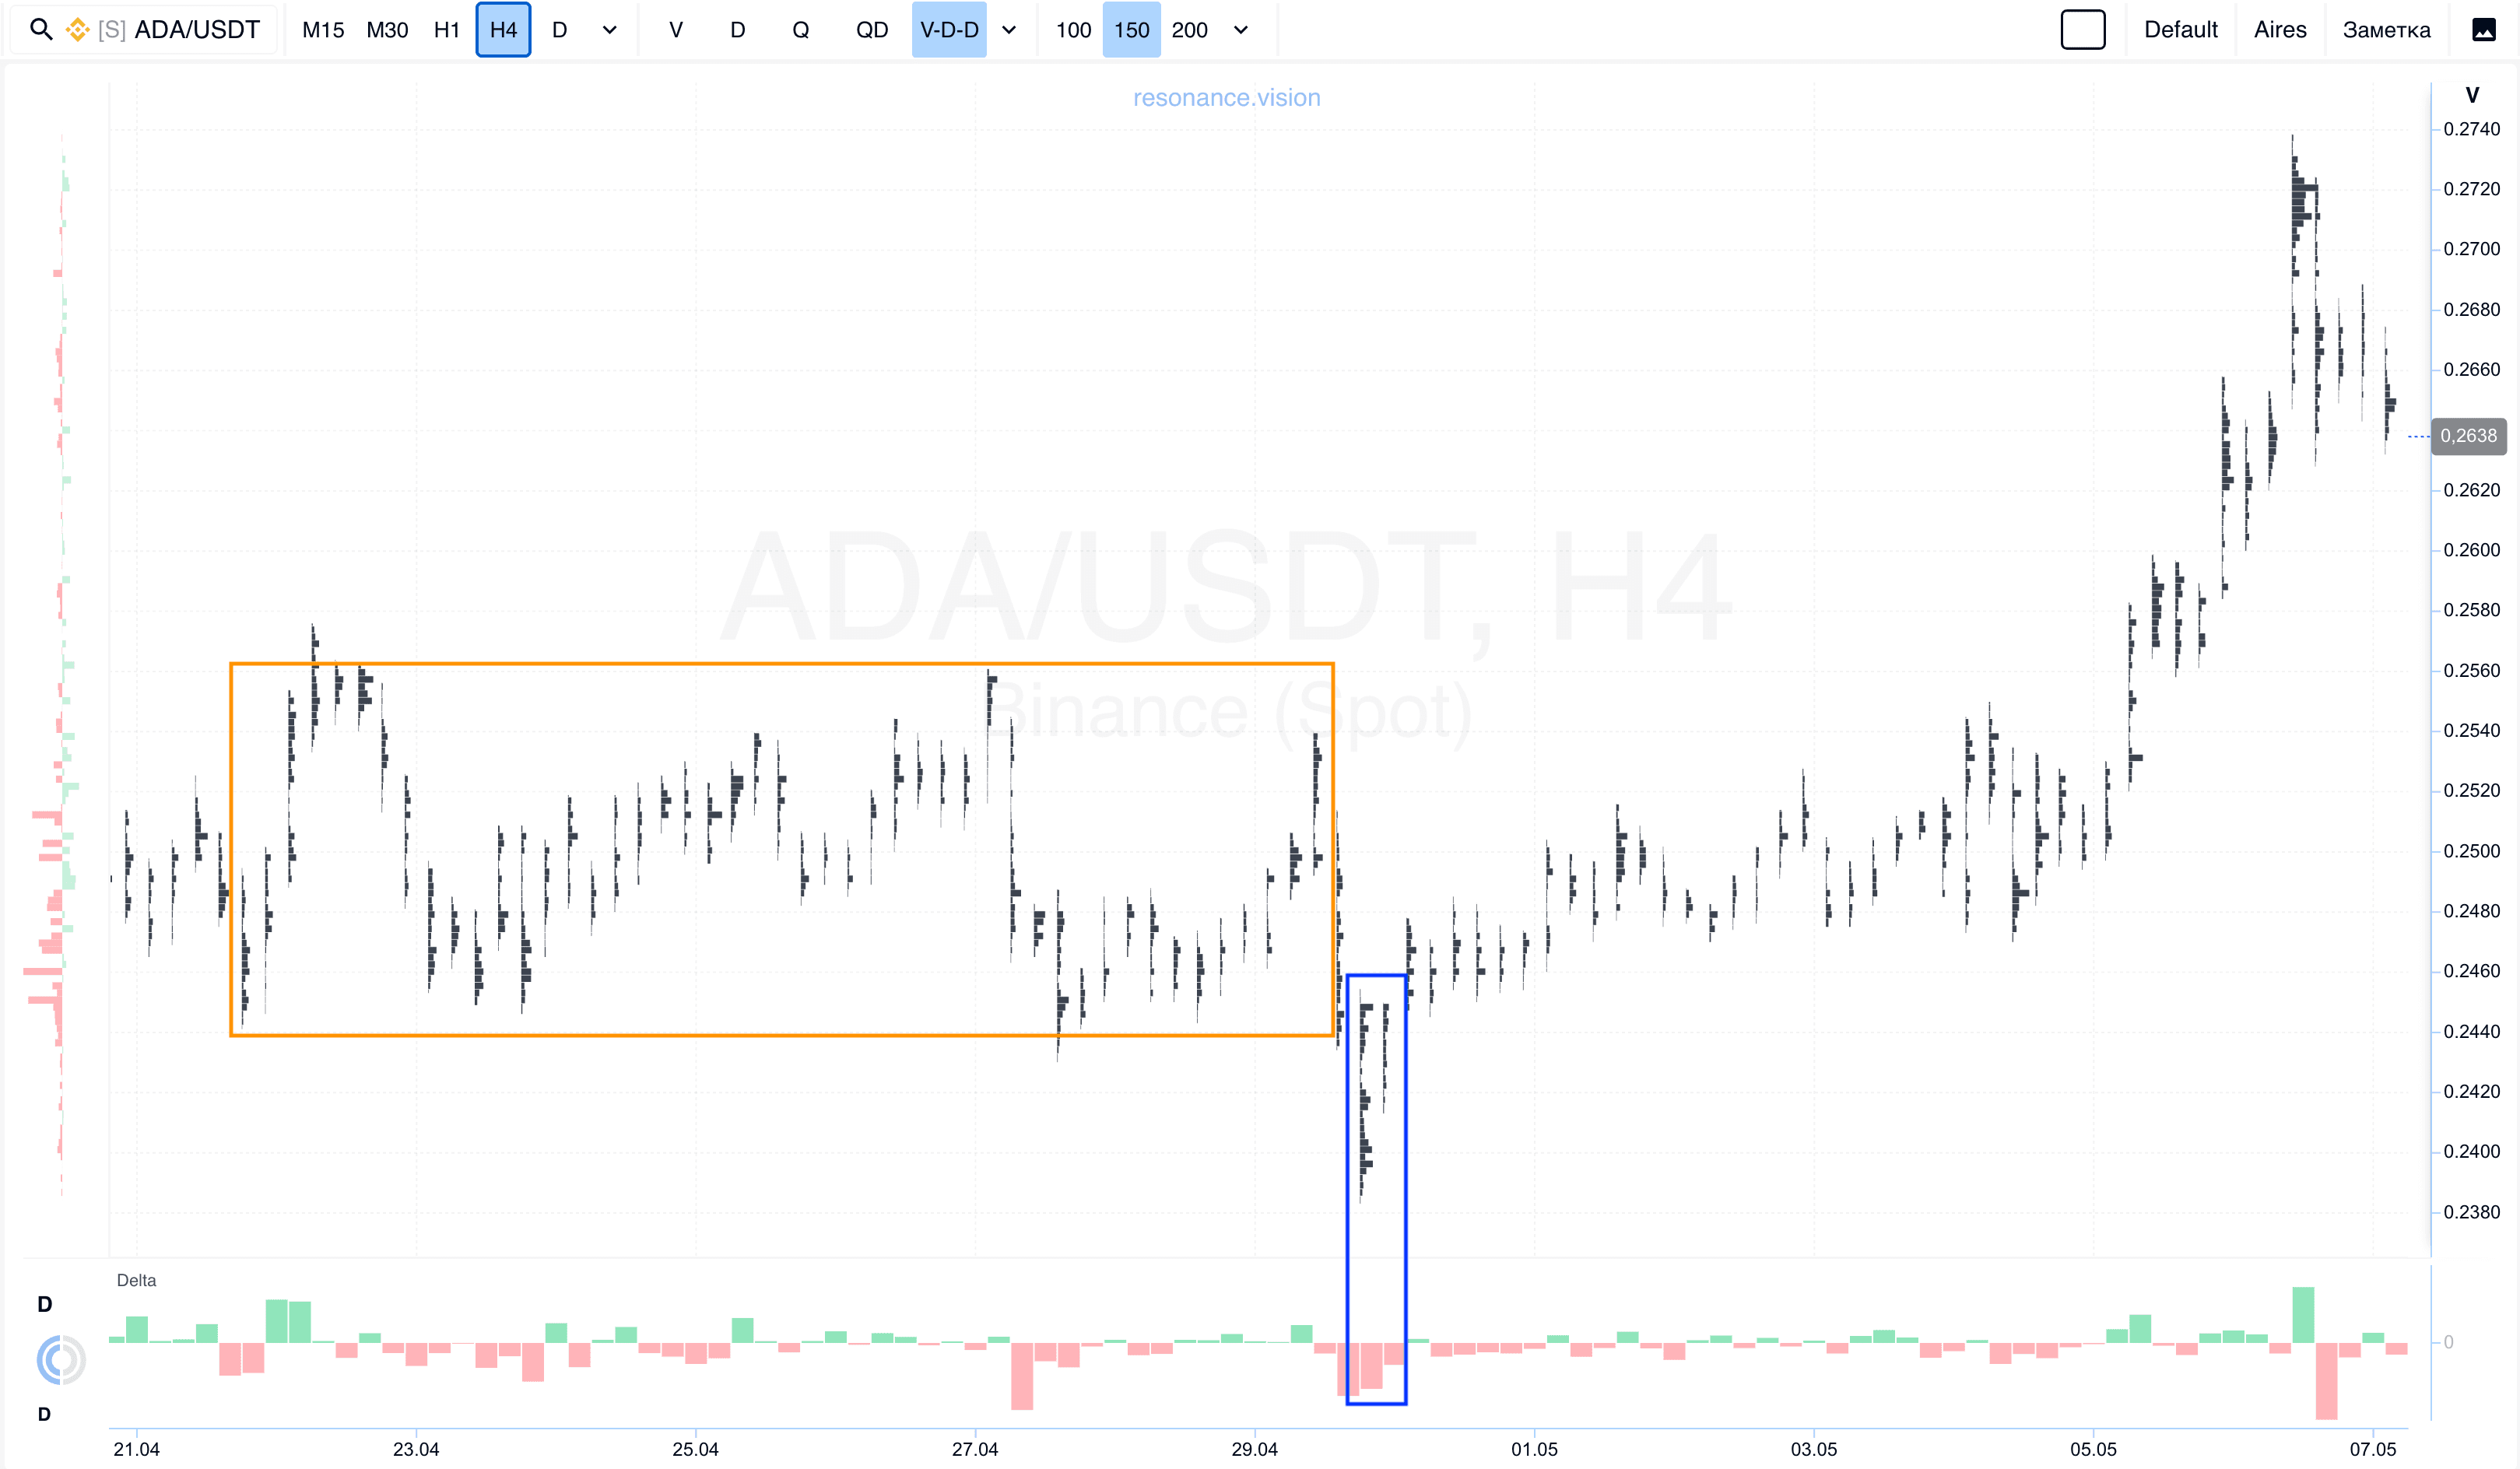
But if sales do not lead to further decline, it means the seller did not get a result in the form of further price decrease. On clusters, volume accumulation may be visible, and delta will show seller activity.
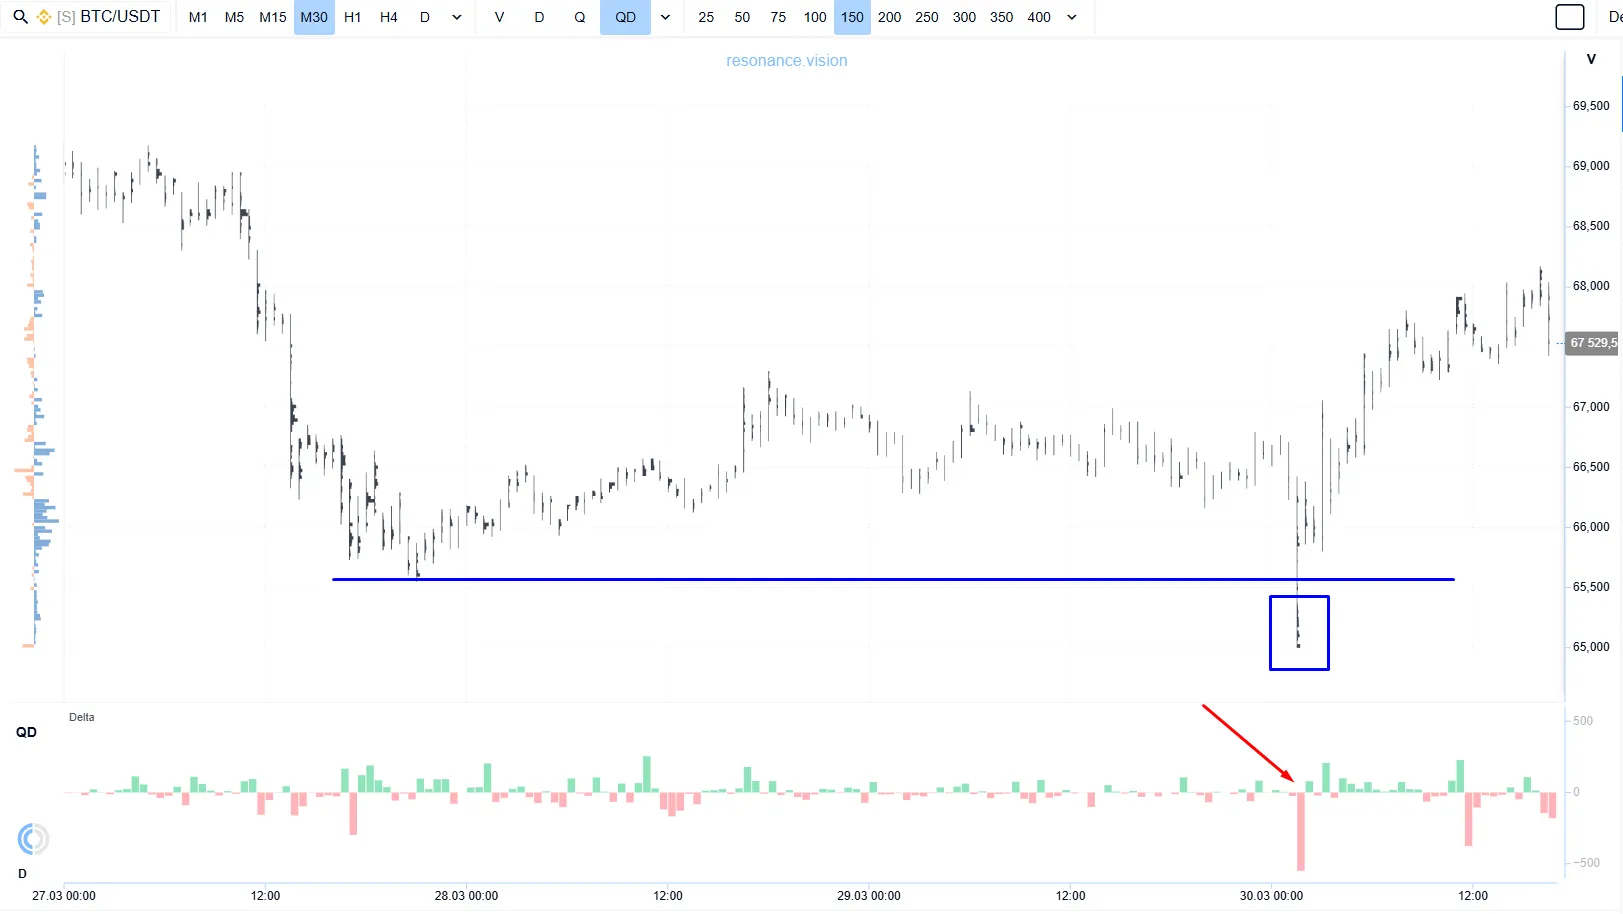
Let’s look at another example of a false breakout downward. The price moves below the previous low but does not continue falling. Volume accumulation on the clusters, marked with the blue rectangle, and red delta, marked with the red arrow, tell us about limit support from the buyer and the readiness to hold back pressure.
For a trader, the best approach is not to chase the move, but to find whether the seller’s pressure actually changed the market balance. If the spot market shows active sales but the price does not fall further, this may be a sign of absorption rather than continuation.
Breakout Confirmation
In this example, we see the price moving beyond the range. On the delta histogram, there are active buys, marked with green arrows, and sales that do not lead to a price decline. Here we see both market buyer activity and inefficient selling. This is an excellent situation for entering a position in the direction of continuation.
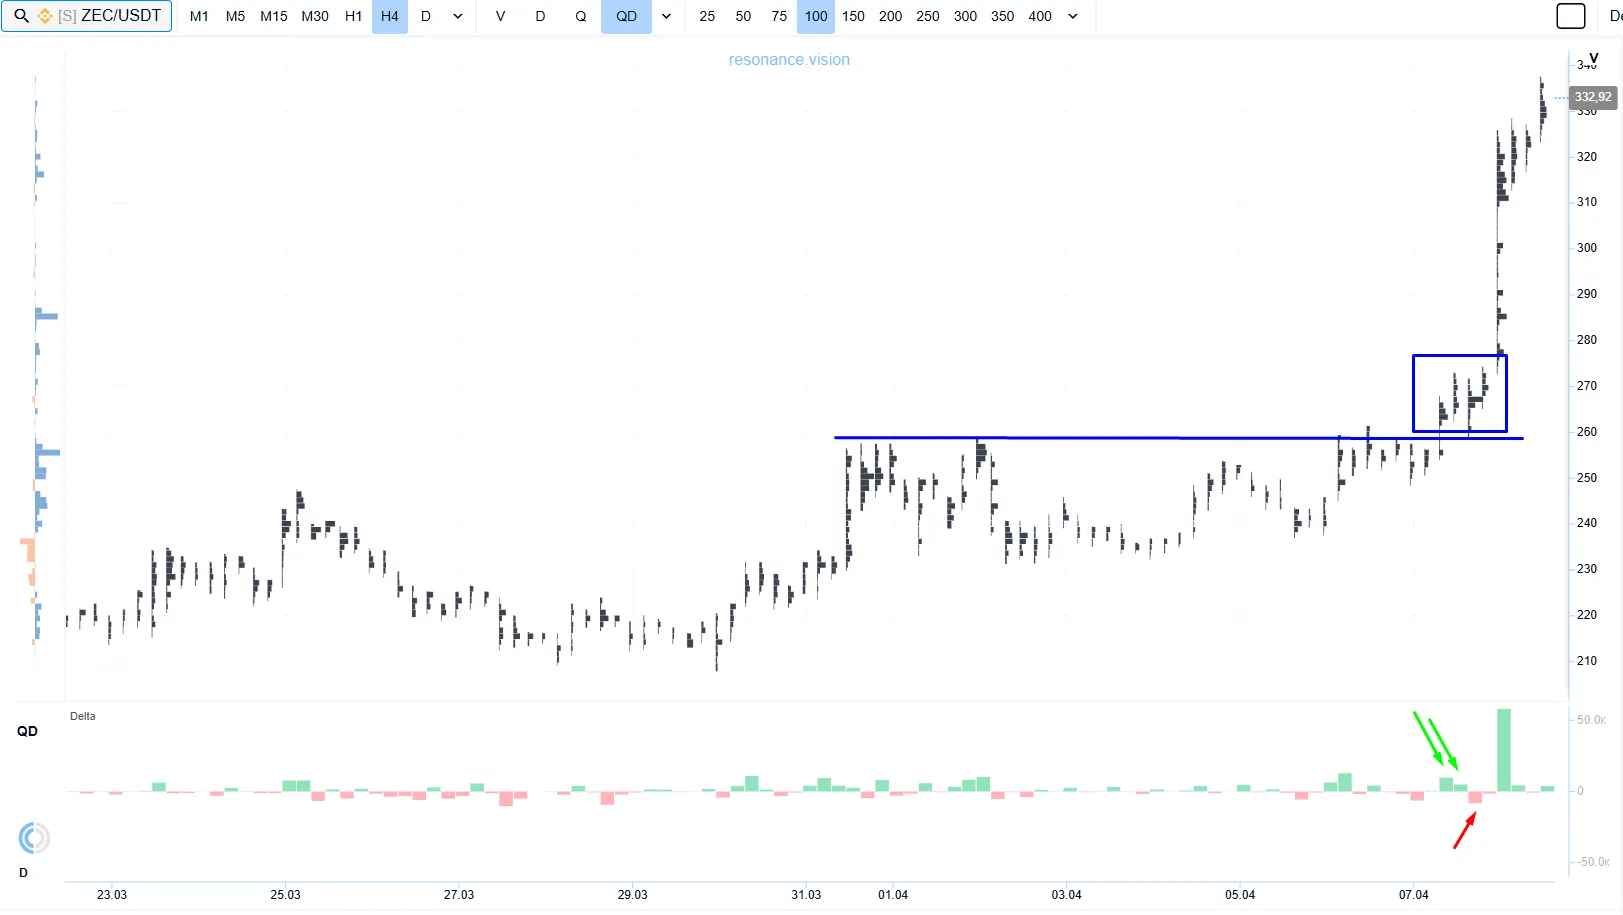
This example resembles a breakout from a triangle. A similar situation is described in our "How to Trade Triangles in Trading: Symmetrical, Ascending, and Descending".
How is a real breakout different from a false one? A real breakout is defined by continuation. The price moves beyond the range boundary, consolidates, and continues moving. Limit order volume supports the move, and market activity produces a result.
A false breakout is defined by the absence of a result. There is an impulse, but the price fails to hold and returns. That is why trading a breakout should rely not on the mere fact that the price has crossed some value, but on confirmation from volume, delta, and price behavior after leaving the range.
That is why a false breakout pattern cannot be evaluated only by a candlestick chart. It is important to look at volume, delta, the cluster chart, and the price reaction. Externally, the same pattern may be the beginning of a move or a trap; everything depends on what is happening with demand and supply.
Unlike classic technical analysis, this approach does not treat the shape of the candle as the main signal. Technical analysis can show where a level is, but it does not explain whether market orders produced a real result.

Common Trader Mistakes
The first mistake is chasing the impulse. A trader sees a sharp move and enters at market without confirmation, when the main activity has already passed.
The second mistake is treating a level as a guarantee. Neither a breakout of the range boundary nor a level from technical analysis is a signal by itself. It is only an area where participant interest may appear.
The third mistake is ignoring volume. Without analyzing market and limit volumes, it is impossible to understand whether the breakout was supported by market participants.
The fourth mistake is ignoring the market phase. During periods of high volatility, false breakouts appear more often, so the strategy must take the market context into account, not only the candlestick pattern.
The fifth mistake is seeing every breakout as a ready trade entry. In trading, what matters is not the mere fact that the price crossed some price area, but the market reaction after that.
The best way to avoid these mistakes is to stop treating a breakout as a separate signal and start analyzing the full context: volume, delta, liquidity, market phase, and the reaction after the level is crossed. No technical analysis indicator can replace this logic if the trader does not understand what is happening inside the market.
How to Trade False Breakouts with Resonance
Resonance allows you to look at the market deeper than a regular candlestick chart. The cluster chart shows where volume traded and what kind of volume it was. Delta helps you understand who was more active: the buyer or the seller. The heatmap shows zones of limit support and resistance.
All this helps distinguish a real move from a false one. If volume comes in but the price does not get continuation, the trader sees weakness earlier than it becomes obvious to everyone on candles.
This approach makes trading more conscious. Instead of trying to guess whether a level will work, the trader analyzes demand and supply, thereby gaining an advantage in the market.
The best result comes from combining several elements: spot data, volume, delta, the cluster chart, and the heatmap. Resonance does not turn one indicator into a ready-made signal. It helps find where market participants are active, where their activity is ineffective, and where the price reaction confirms or rejects the breakout idea.
Conclusion
A false breakout is not just a return of the price into the range. It is a situation where high market order activity does not lead to continuation.
Stops can create a sharp impulse, but on their own they do not form a sustainable trend. A real breakout requires continuation: demand must move the price up, and supply must move it down. If a strategy does not account for volatility and the market phase, the same signal can produce a completely different result.
The advantage in trading does not appear at the moment of the breakout, but in understanding what stands behind it. It is the analysis of demand and supply, and the influence of volume on price, that makes it possible to distinguish a real price move from a false one. As a result, trading becomes not a reaction to a nice formation on the chart, but work with the analysis of real actions of market participants.
That is why in Resonance, we look not only at the chart, but also at volume, delta, and price reaction. This helps trade not based on guesses, but on an understanding of market mechanics.
Follow new insights in our telegram channel.
No need to invent complex schemes and look for the "grail". Use the Resonance platform tools.
Register via the link — get a bonus and start earning:
OKX | BingX | KuCoin.
Promo code TOPBLOG gives you a 10% discount on any Resonance tariff plan.
Recommended articles