Delta in Trading: How to Use It to Find Market Reversals

Discover what’s hidden in a candlestick chart! We’ll explore the mechanics of delta: how to distinguish a false impulse from a genuine market reversal, and why aggressive buying doesn’t always lead to price growth. Learn how to see through the market using cluster analysis.
Table of contents
- 01What Is Delta and How Is It Formed?
- 02Crypto delta: Looking Under the Hood of a Candle
- 03Why Delta Matters for Finding Reversals
- 04The Main Signs of Trend Weakness in Delta
- 05Market Specifics: Volatility and Cryptocurrency
- 06Resonance: Learning to Find Market Anomalies
- 07Conclusion: From Price Movement to Market Logic

Introduction: Why Does Price Change Direction?
Most beginners look at a chart as if it were just a sequence of Japanese candles, without thinking about what stands behind each move. In reality, price is only the result of how supply and demand interact in the market. Any move or reversal begins with a shift in the balance of market forces.
An uptrend continues while active buying keeps pushing price higher. A decline remains in place while sellers can force price lower and opposing demand is not strong enough to stop that move. When one side of the market keeps applying pressure but price no longer responds as confidently as before, the conditions for a slowdown or reversal begin to appear.
This is where delta becomes useful. It helps show the ongoing fight between buyers and sellers inside each candle and gives traders a way to look beyond the surface of the chart. For both active trading and longer-term investing, that deeper view matters.
What Is Delta and How Is It Formed?
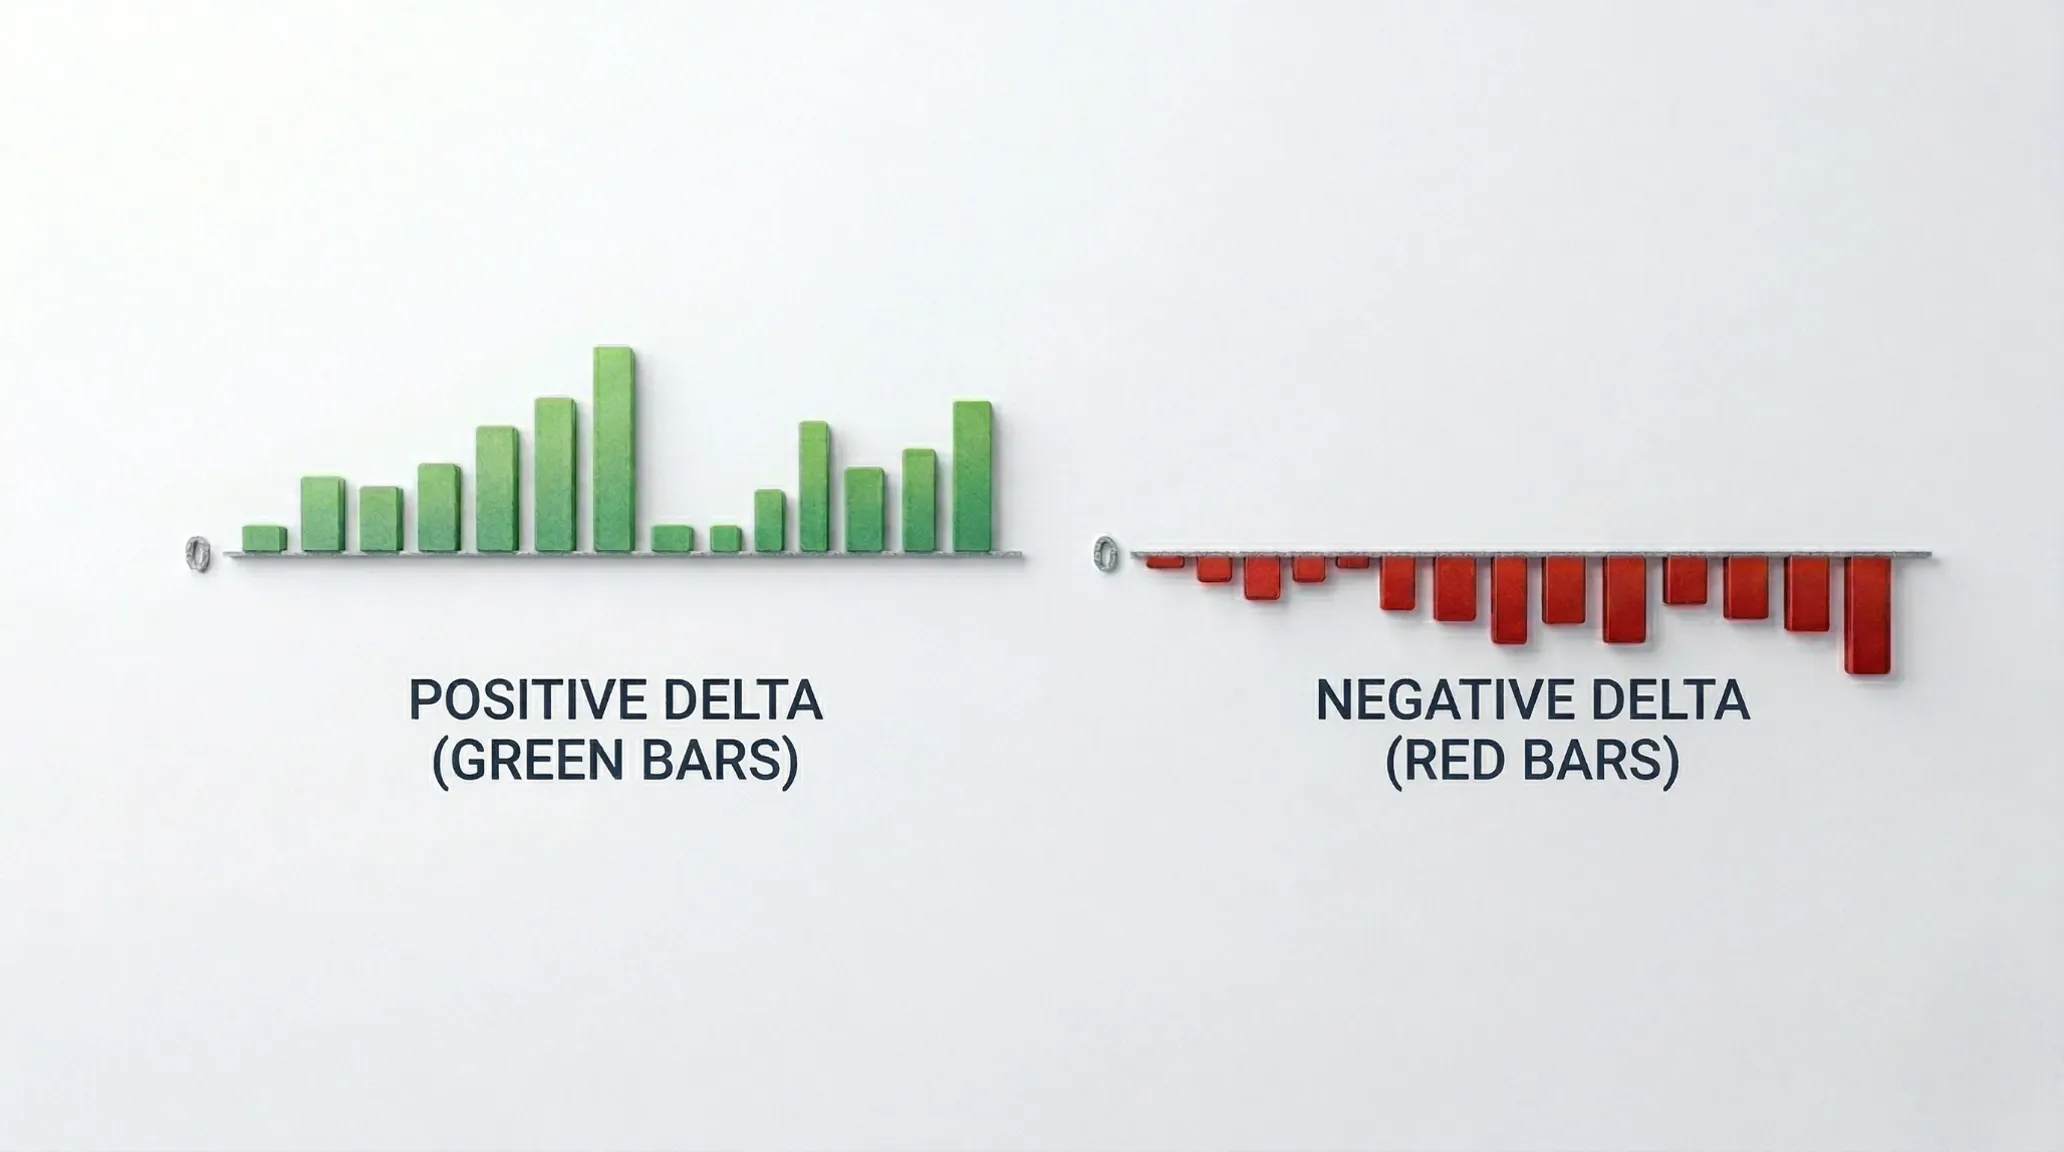
Put simply, delta in trading is the difference between market buys executed at the Ask and market sells executed at the Bid over a specific period of time.
- Positive delta appears when buyers are more active and keep lifting the available sell liquidity.
- Negative delta appears when market selling dominates. Unlike total volume, which only shows overall activity, delta helps reveal the direction of market pressure at a given moment.
That is why traders use it not as a standalone indicator or guaranteed signal, but as a way to better understand the behavior of buyers and sellers inside a move. In the cryptocurrency market, this can help you spot early signs that a trend is losing strength.
Crypto delta: Looking Under the Hood of a Candle
A standard candle only shows four values: open, close, high, and low. What it does not show is how volume, buyer activity, and seller activity were distributed inside that move. When you use a cluster chart, you can see where the main battle took place and where market buys or sells stopped producing the expected price result.
This allows you to analyze not just the fact that price moved, but the internal mechanics behind that move. On the cluster chart, we can clearly see abnormal volume and accumulations at the extremes (blue box). A move may begin with aggressive buying that works efficiently and pushes price higher (green box #1). But later, buyers can continue to buy aggressively while price no longer makes a new high (green box #2).
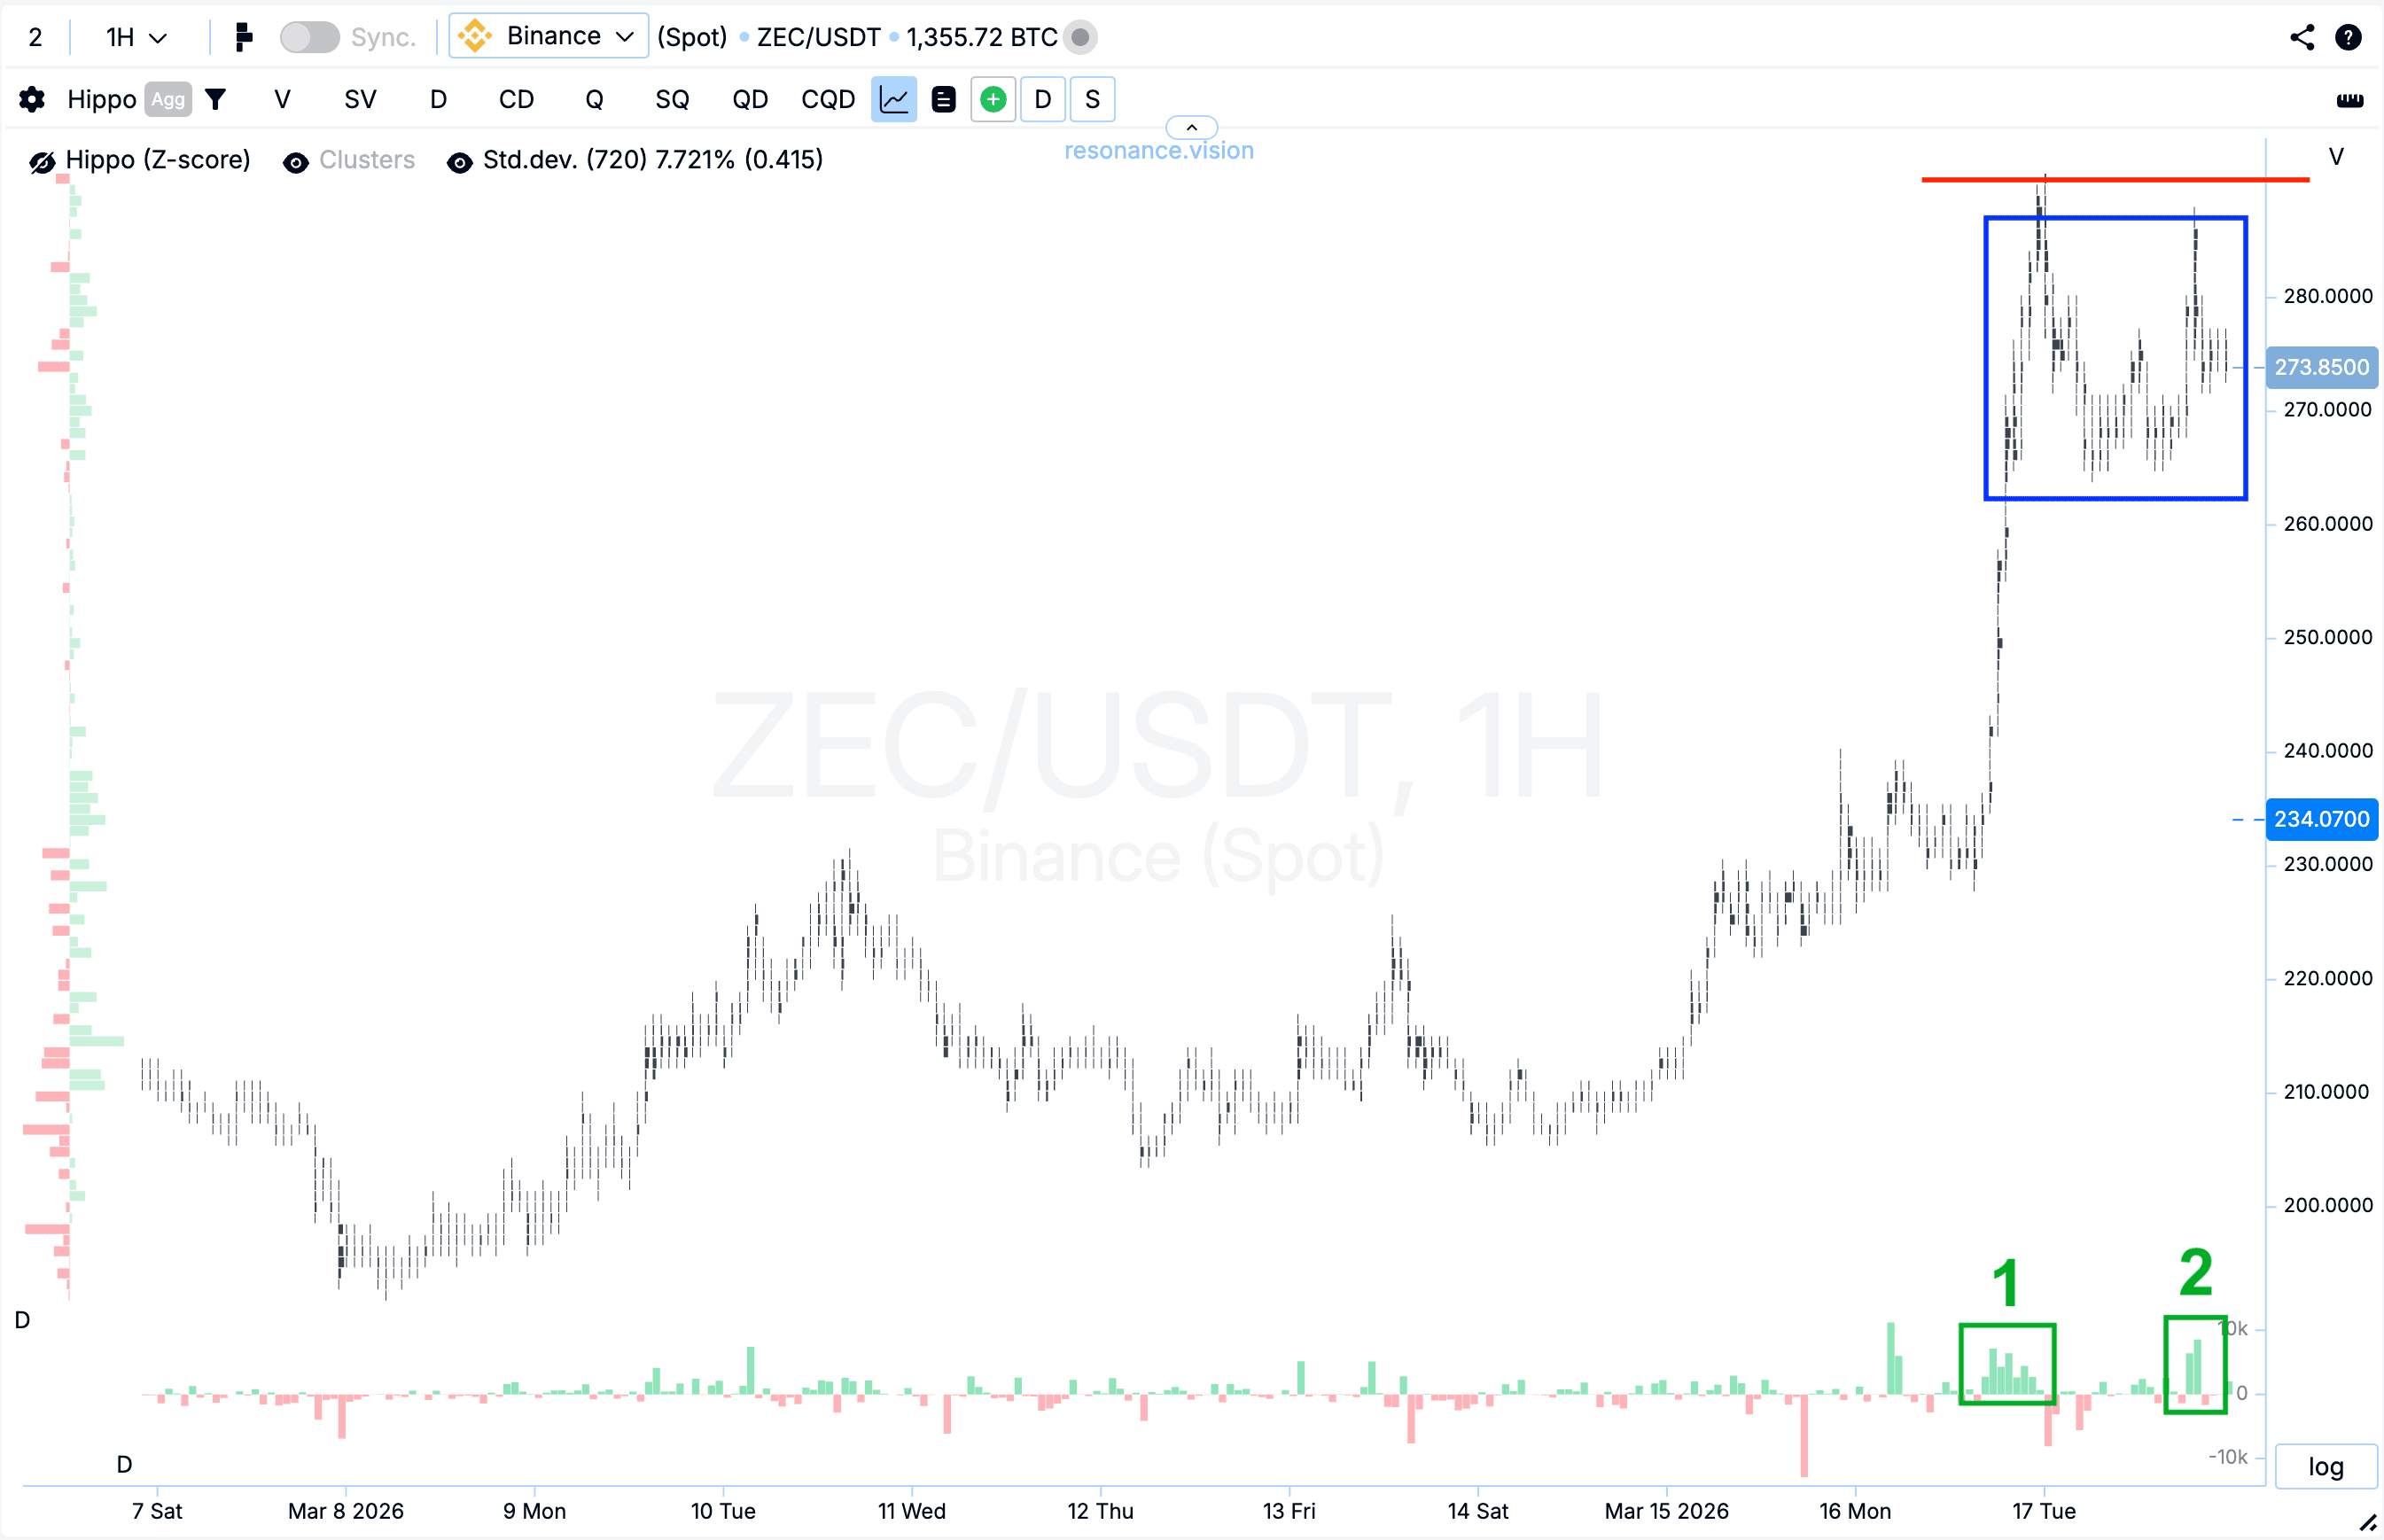
That often suggests that opposing limit sell orders are absorbing demand and that the upward move is losing efficiency. This is where crypto delta becomes especially valuable: it helps you notice a shift in initiative before the reversal becomes obvious on a regular chart.
In this example, the result of that setup was a decline of more than 20%, followed by dominant market selling. Buyers who entered near the local high did not get continuation, and as demand weakened, initiative gradually passed to sellers. In that case, tracking delta helped identify the moment when buying pressure stopped producing the same result in price.

Why Delta Matters for Finding Reversals
For price to reverse, the current move has to meet resistance in the form of opposing liquidity. In crypto trading, this often looks like a fast rise where market buys remain active and delta keeps increasing, yet price can no longer push meaningfully higher.
At that point, price starts running into opposing limit sell orders, and the move begins to lose strength. That is why delta in trading is valuable for tracking reversals: it helps reveal the mismatch between participant activity and price response before the turn becomes obvious to everyone else on the chart.
The Main Signs of Trend Weakness in Delta
Professional trading is built around identifying market inefficiencies. If the market shows abnormally strong delta values but price fails to produce a comparable continuation, that may signal that the current move is weakening.
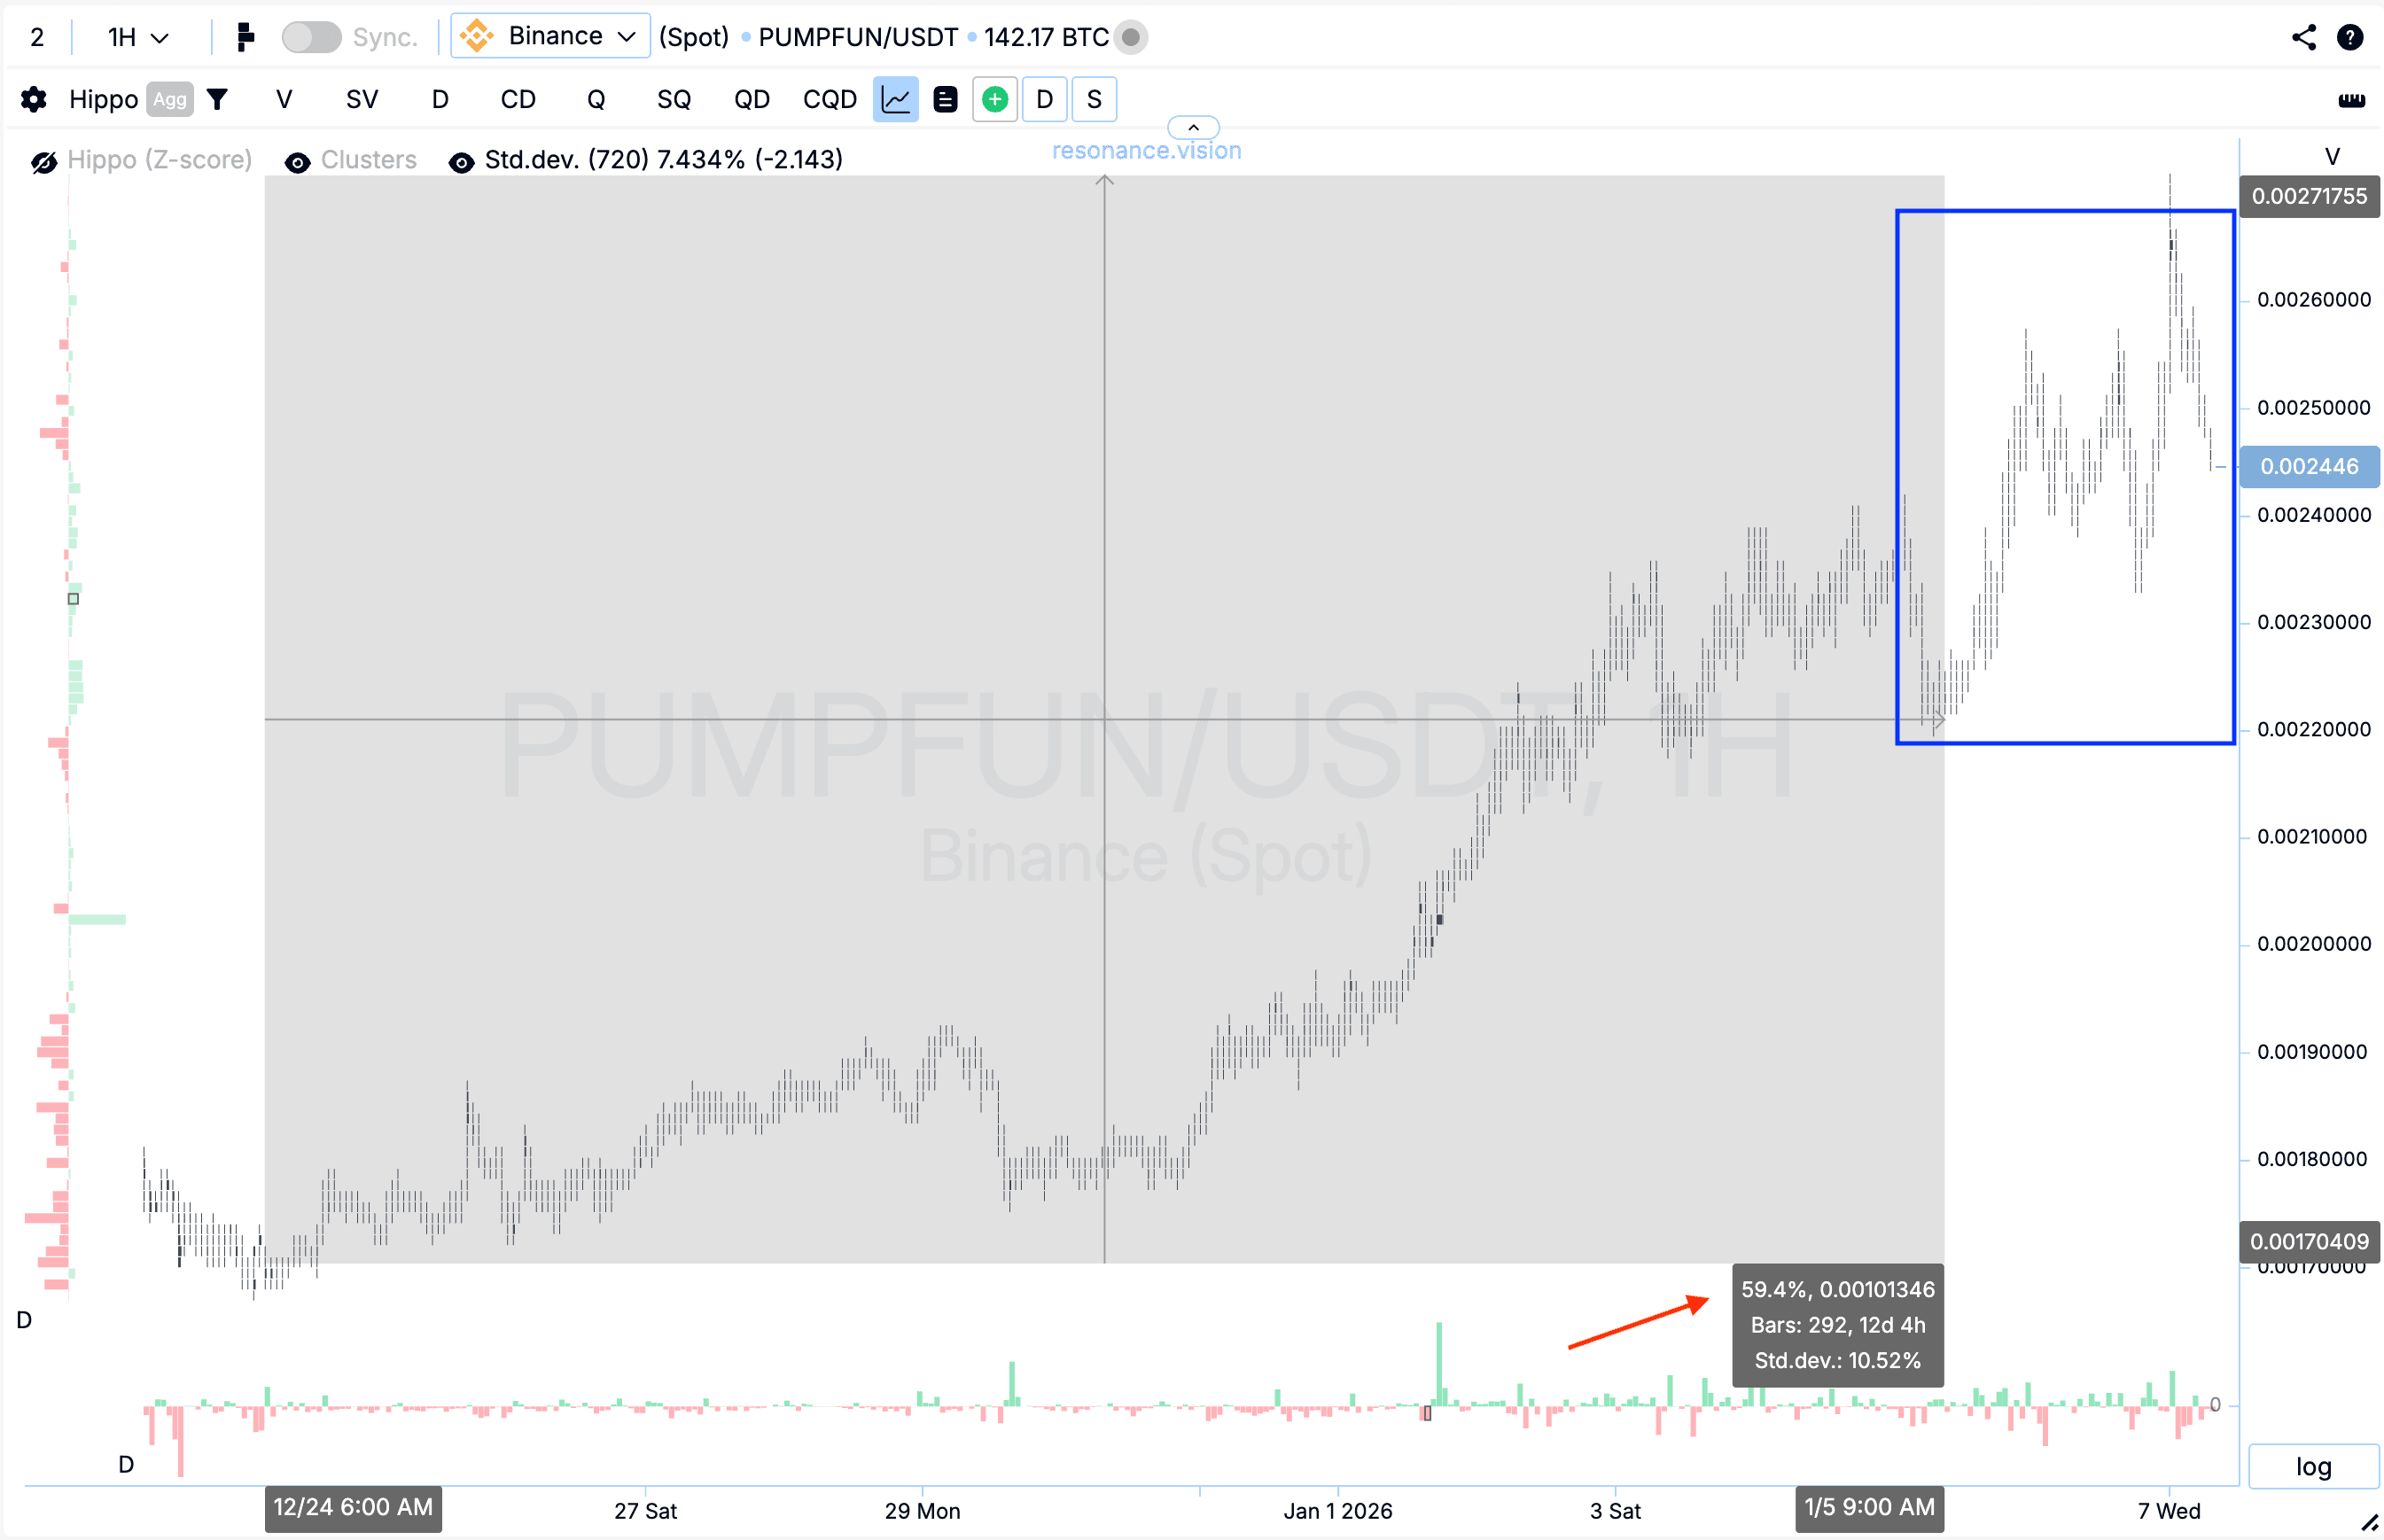
Negative Delta Without a New Low
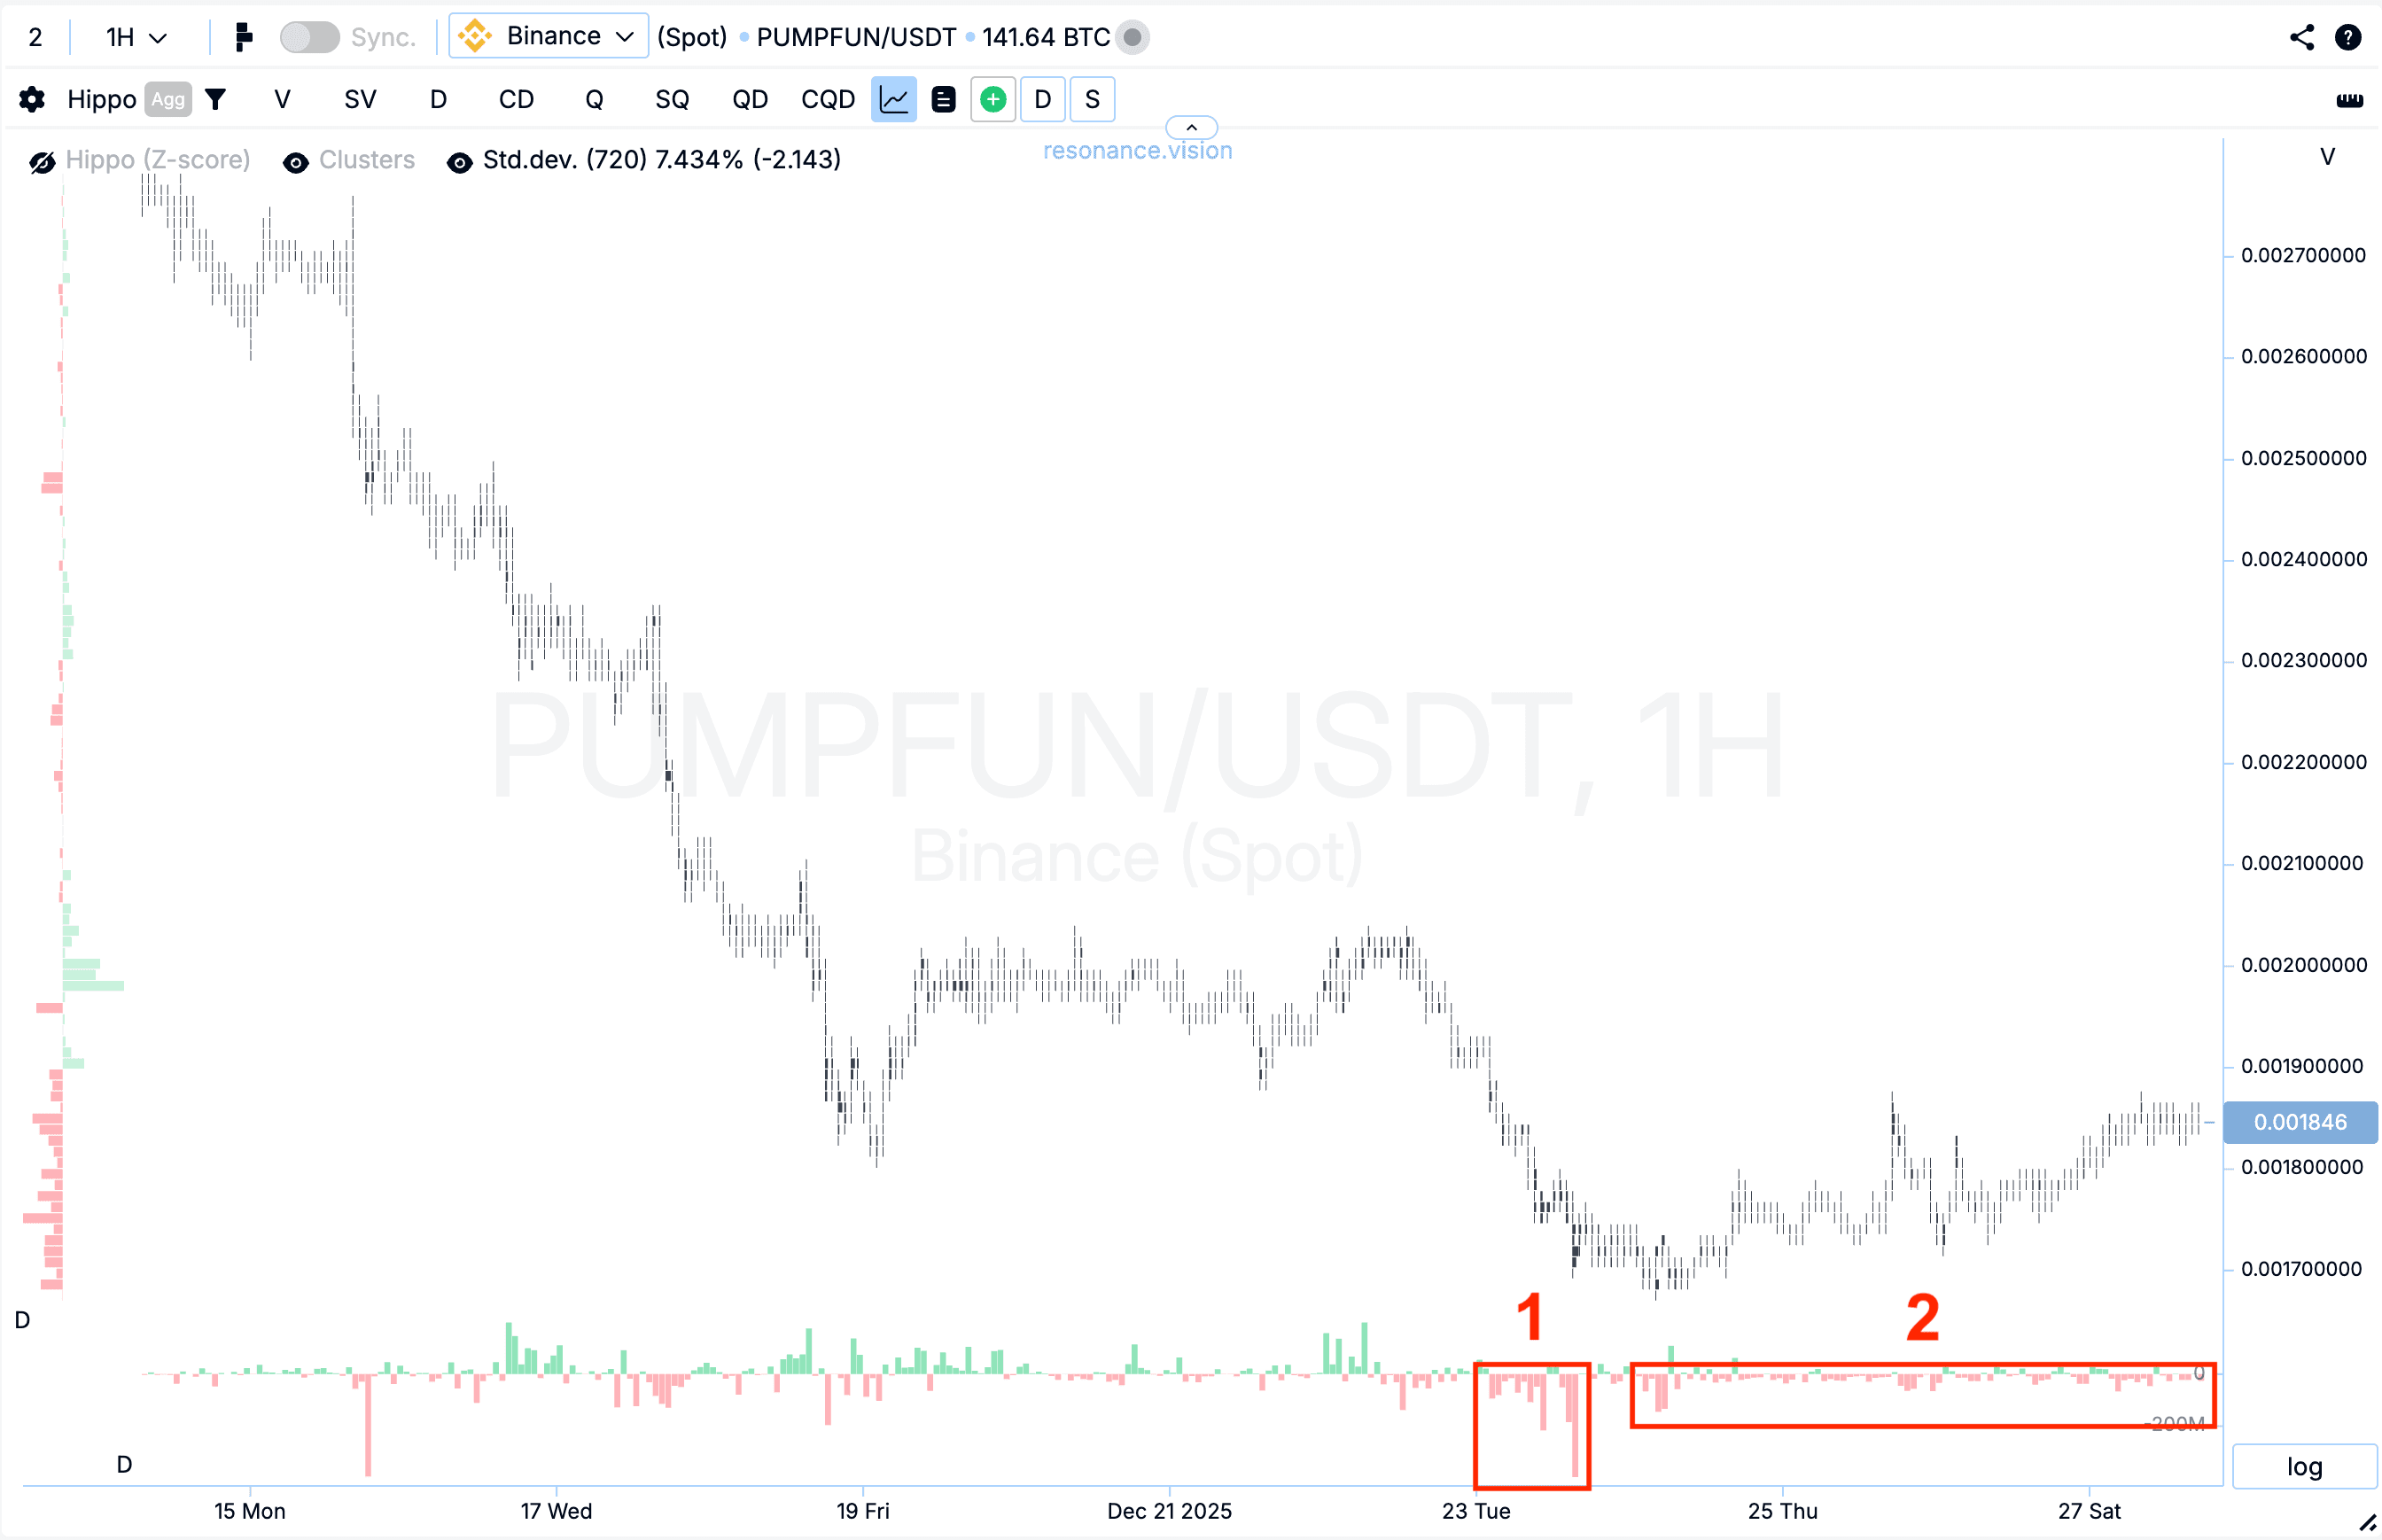
Consider a situation where heavy market selling keeps hitting the market, delta turns clearly negative, yet price holds in place or even starts moving higher. This means that strong limit buy orders are absorbing the sell pressure.
That kind of behavior often points to seller exhaustion and can precede a local reversal upward. In the example from the article, substantial selling appeared on the chart (box #1), but price did not show a proportional decline. Selling continued (box #2), yet price still began to rise. That suggests supply was being absorbed and initiative was gradually shifting to buyers.
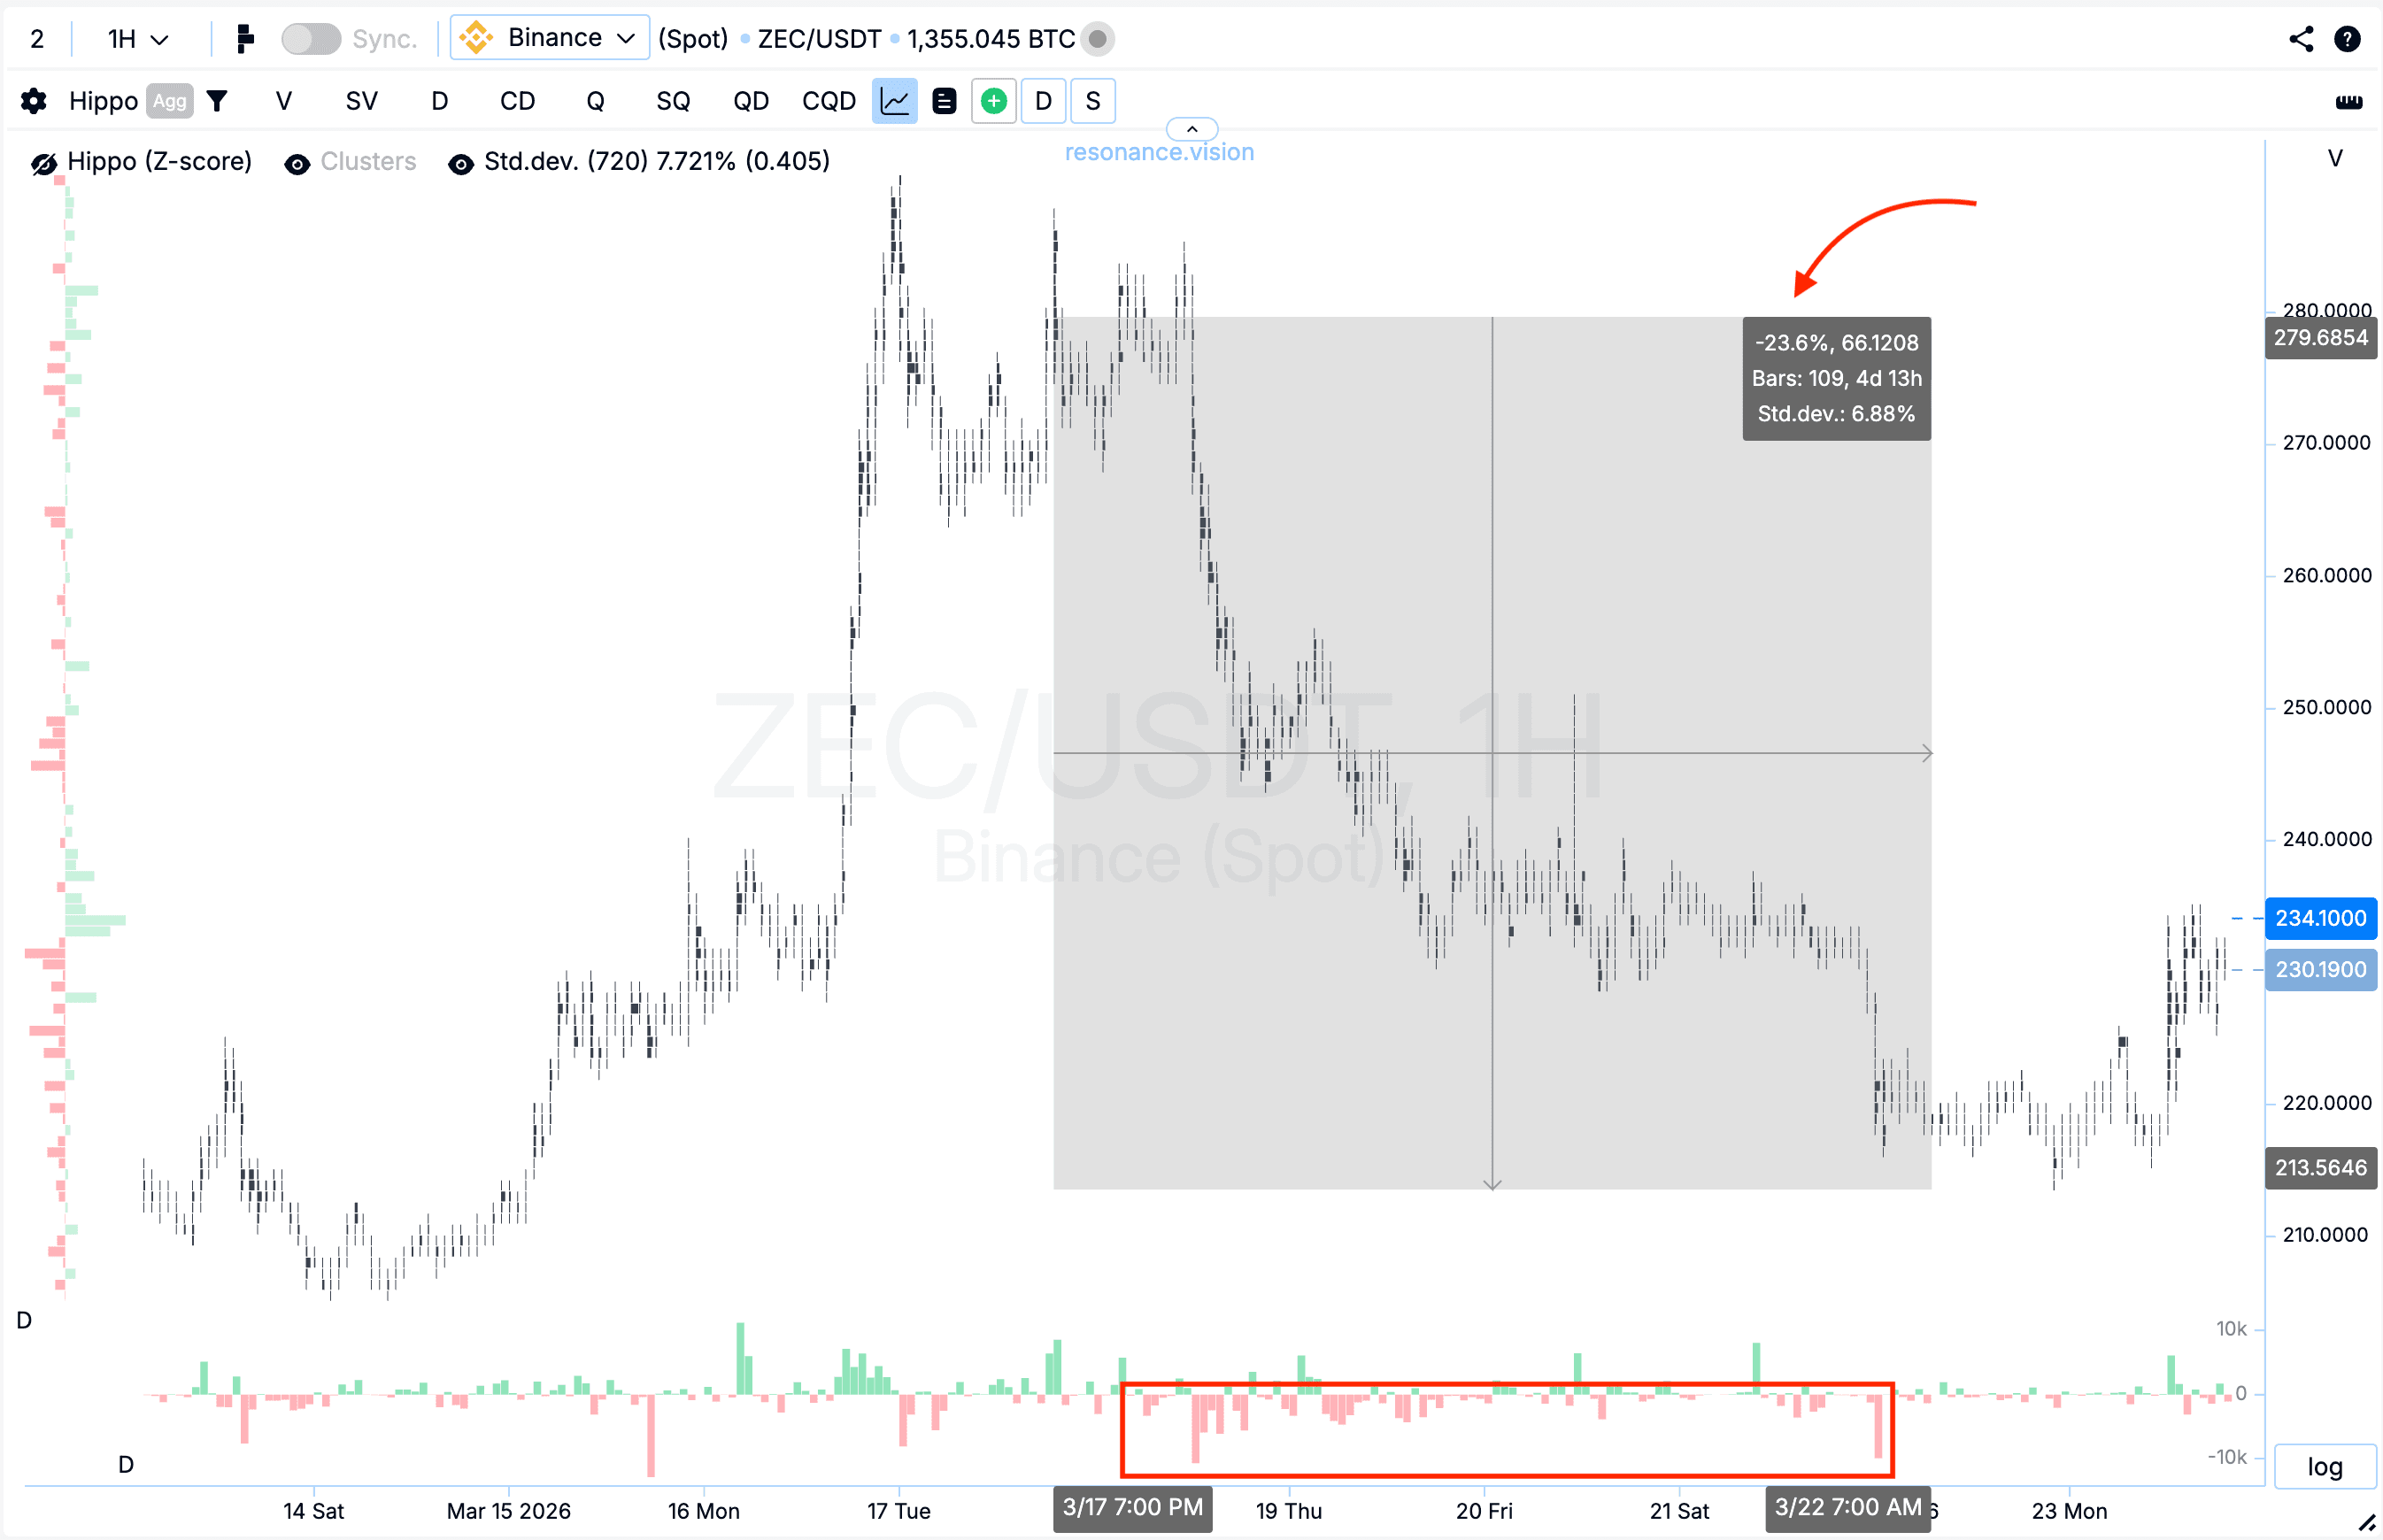
Later, price advanced by around 60%. In the highlighted area (blue box), volatility also expanded sharply. After such moves, the market often enters a neutral balance phase, a neutral range, or a consolidation period while participants search for a new equilibrium. Tracking these transitions is essential in both short-term trading and longer-term investing.
Positive Delta Without a New High
This is the mirror image of the setup above. Market buys remain active, delta stays clearly positive, but price no longer pushes higher with confidence near local highs. That may indicate that opposing limit sell orders are absorbing demand and that the upward move is running out of strength.
In that context, positive delta stops confirming continuation and instead becomes a sign of weakening trand. For cryptocurrency trading, this matters because buyers may continue spending resources while price delivers a smaller and smaller result. This kind of structure is especially important when tracking potential reversals on a live chart.
Market Specifics: Volatility and Cryptocurrency
It is important to remember that cryptocurrency is highly volatile and often produces sharp impulsive moves. In such conditions, the chart can display strong delta anomalies that an inexperienced trader may mistake for the start of a powerful trend.
This is why volume delta analysis is so important. It helps separate genuine continuation from an inefficient burst of activity. In the crypto market, you should never rely on one metric alone. You need context: the level, the chart structure, the reaction of price, and the type of liquidity standing against the move.
Systematic trading in cryptocurrency is difficult without understanding supply and demand. It is also highly relevant for tracking market behavior not only in short-term speculation, but in investing and even when you need to hedge risk or hedge exposure during unstable periods. A neutral reading in one part of the chart can quickly turn into directional expansion somewhere else, especially in fast online markets.
Resonance: Learning to Find Market Anomalies
Understanding market reversals and points of trend weakness becomes much easier when you do not rely on just one metric, but read the market as a whole: through the cluster chart, price reaction, volume, and the mechanics of supply and demand.
That approach helps you see more than numbers on a chart. It helps you understand the logic behind why a move either continues or begins to lose strength. In Resonance, these scenarios can be studied on real-time online market data, and trading ideas can be reviewed in a live online environment. In the mini-course and at Resonance University, you can build a solid foundation in crypto trading and learn how to recognize moments when one side of the market is still aggressive, but price is no longer responding in the same way.
In practice, trading cryptocurrency using delta becomes much more effective when it is combined with structure, context, and live market observation rather than treated as an isolated metric. This approach is useful not only for intraday trading, but also for investing, portfolio management, and online market tracking.
Conclusion: From Price Movement to Market Logic
Moving from simply watching candles to understanding supply and demand is a major step forward for any trader. When your decisions are based on volume, order flow, and price response, you stop searching for random patterns and start seeing the real reasons behind pauses, slowdowns, and reversals.
The market tends to reward those who look deeper into the process rather than focusing only on price changes. By using a modern online analytical platform for crypto trading Resonance and continuing to study market mechanics, you can make your decision-making more structured and more objective.
Delta is valuable not because it predicts the future, but because it helps reveal when pressure is no longer producing the same result. That is the point where a trend may be losing strength, where a neutral phase may form, and where the next strong scenario may begin. Whether your goal is active trading, investing, or learning how to hedge risk in cryptocurrency, this deeper reading of the chart can give you a clearer view of what is really happening in the market.
If you want, I can now do a second pass and give you this same translation in a cleaner blog-ready layout with tightened sentence rhythm for publication.
Follow new insights in our telegram channel.
No need to invent complex schemes and look for the "grail". Use the Resonance platform tools.
Register via the link — get a bonus and start earning:
OKX | BingX | KuCoin.
Promo code TOPBLOG gives you a 10% discount on any Resonance tariff plan.
Recommended articles


