The "Head and Shoulders" Pattern in Trading: A Reliable Reversal Pattern

Why does the classic “Head and Shoulders” pattern often lead to losses? Market participants blindly trust technical analysis, ignoring the real balance of supply and demand. Find out why a visual model without volume assessment is a false signal, and how to switch to objective market analysis.
Table of contents

Many participants in trading continue to believe that classic chart patterns — such as the Head and Shoulders pattern — are capable of consistently generating profit on their own. They find a familiar formation on the chart, open a position, and expect a predictable price movement in the “desired direction.”
But the market reality is much more complex. There are situations where the pattern is perfectly formed, the neckline breakout has occurred… but the price goes in the opposite direction. And the trader is left with a loss, wondering: “Why is that? The pattern was there!” and everyone writes that technical analysis works…
The problem is that any figure in trading is just a visual model, not an objective indicator of the real balance of power between buyers and sellers. If the volume structure and order effectiveness are ignored, the pattern easily gives false signals.
What the Head and Shoulders Pattern Is
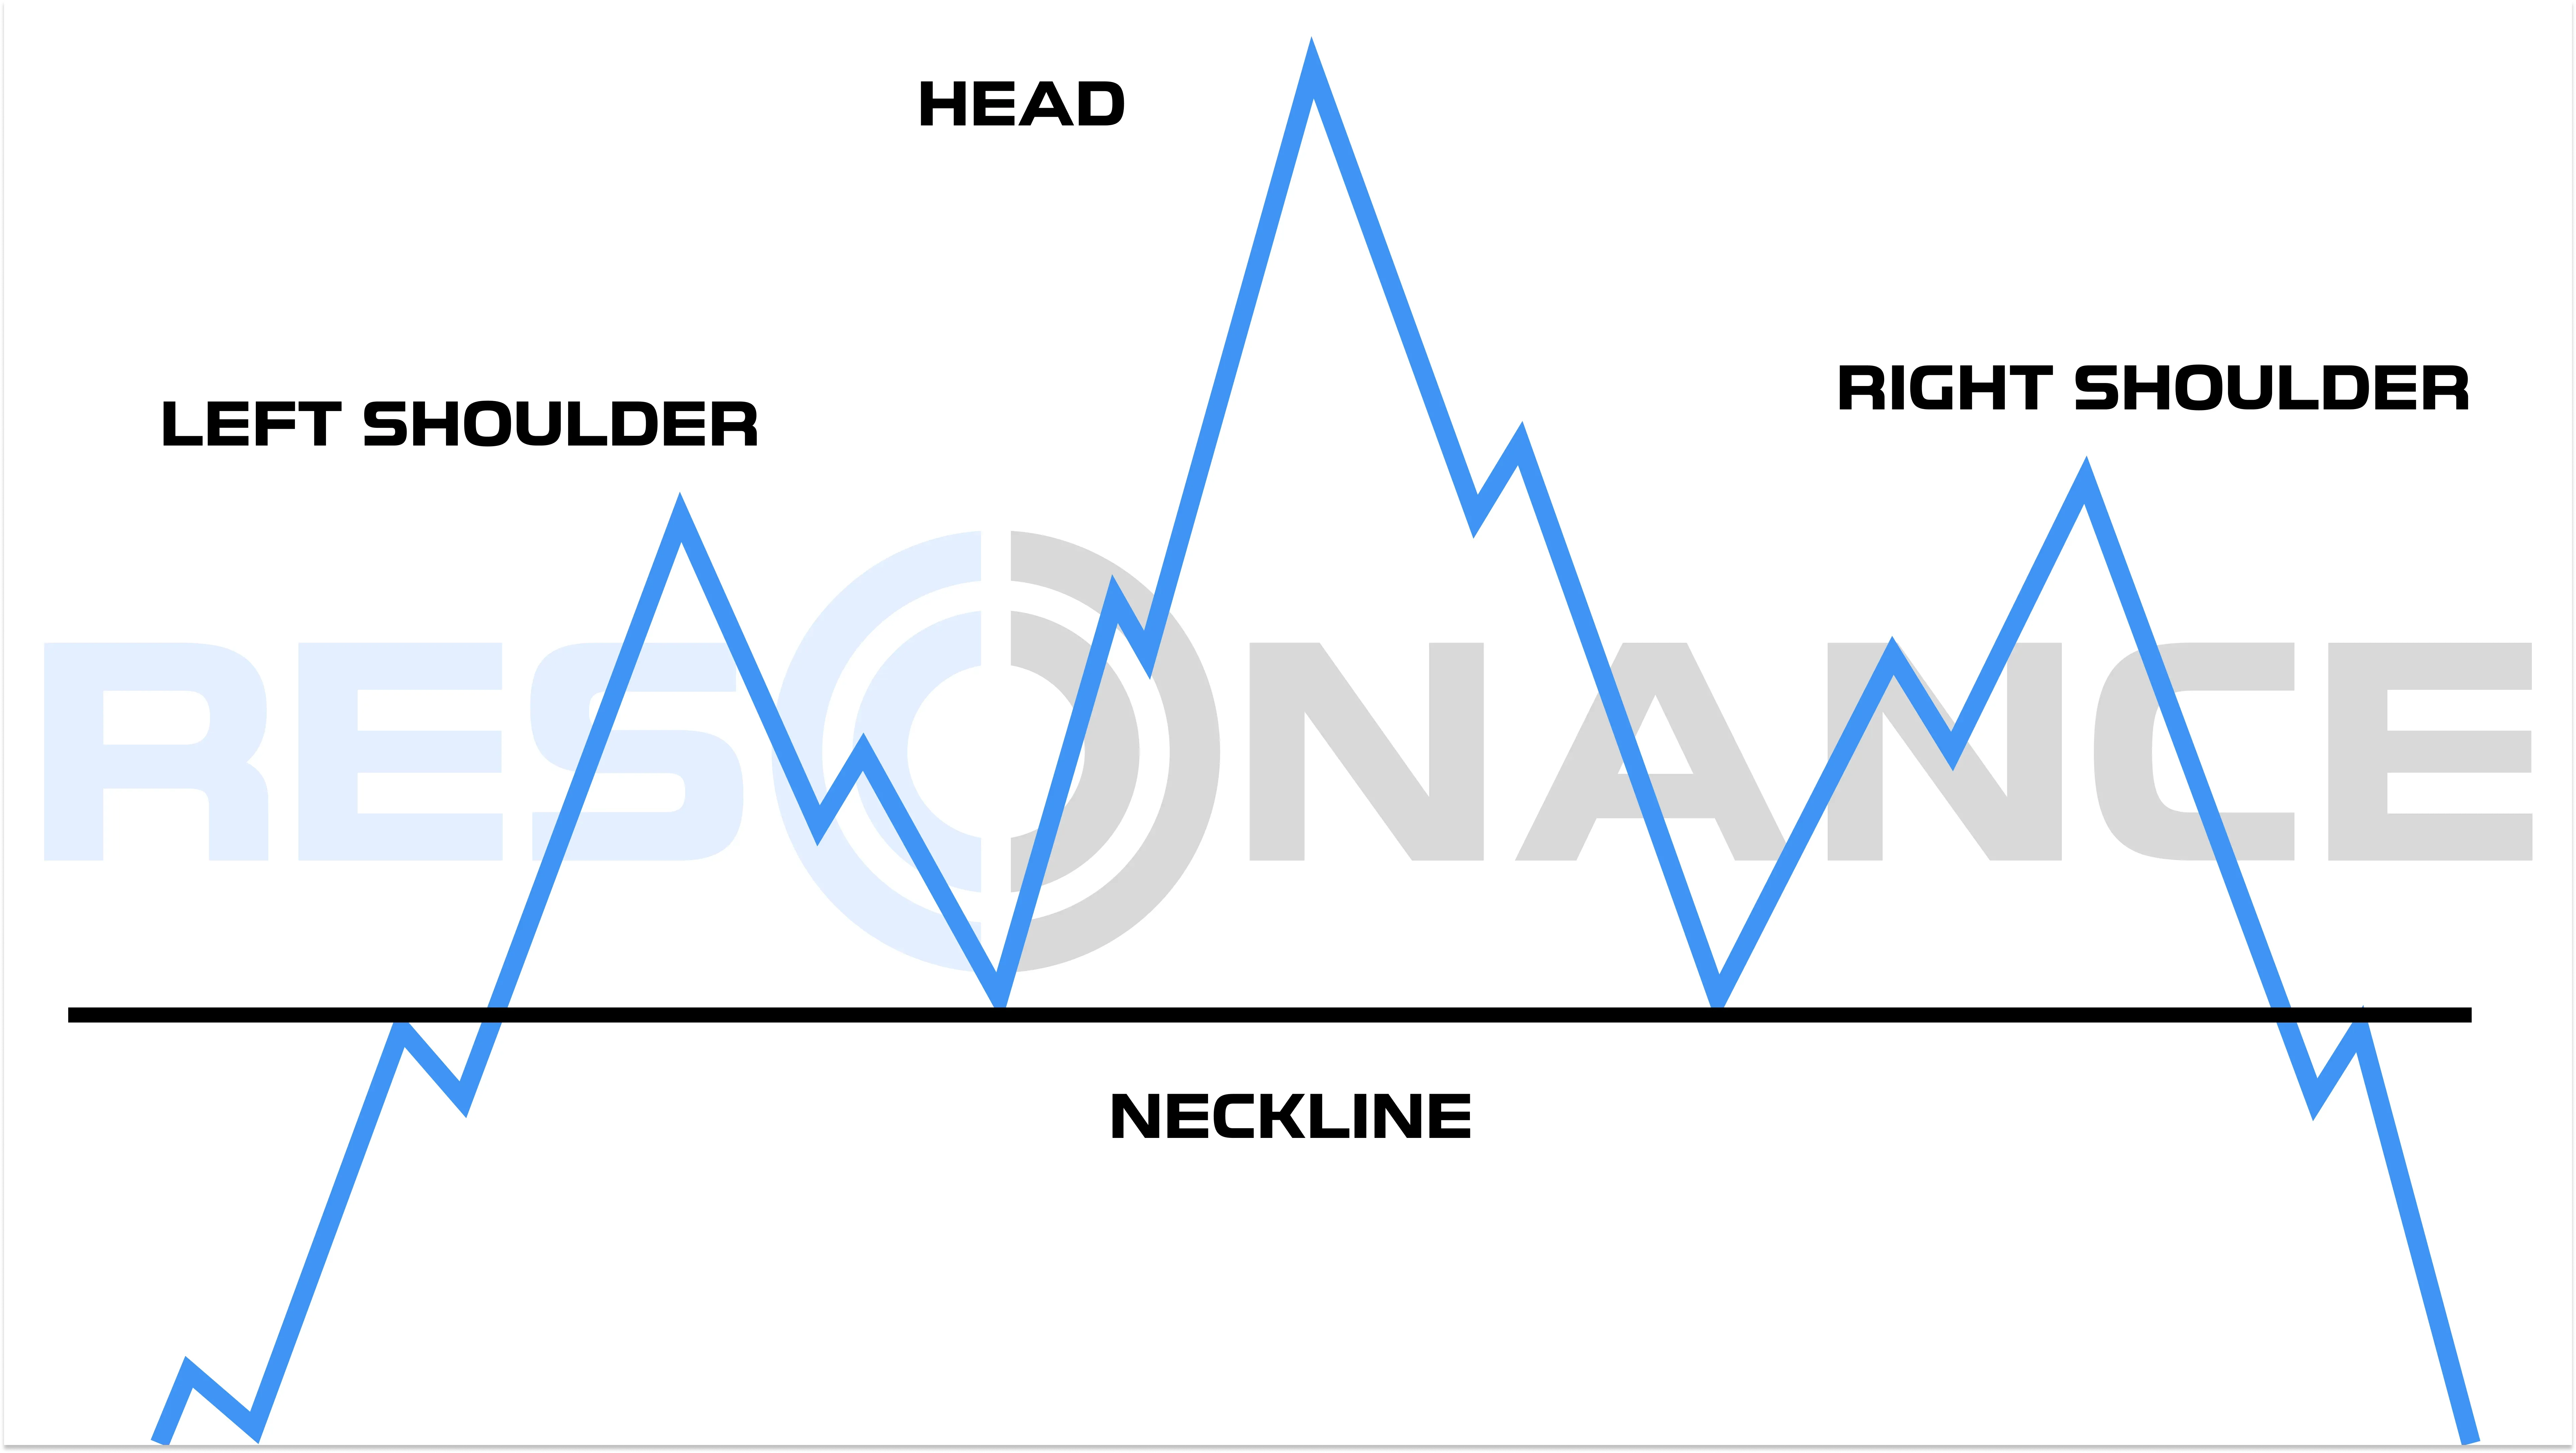
The Head and Shoulders pattern is formed on the chart by three consecutive peaks:
- Left Shoulder: The price makes a peak and pulls back down.
- Head: A new upward impulse leads to a higher maximum and a subsequent decline.
- Right Shoulder: The price rises again, but the maximum is lower than the “head,” after which the drop begins.
- Neckline: Connects the two troughs between the shoulders and the head. It can be horizontal or slightly ascending.
- Signal: A breakout of the neckline downwards after the formation of the right shoulder — a potential downward reversal.
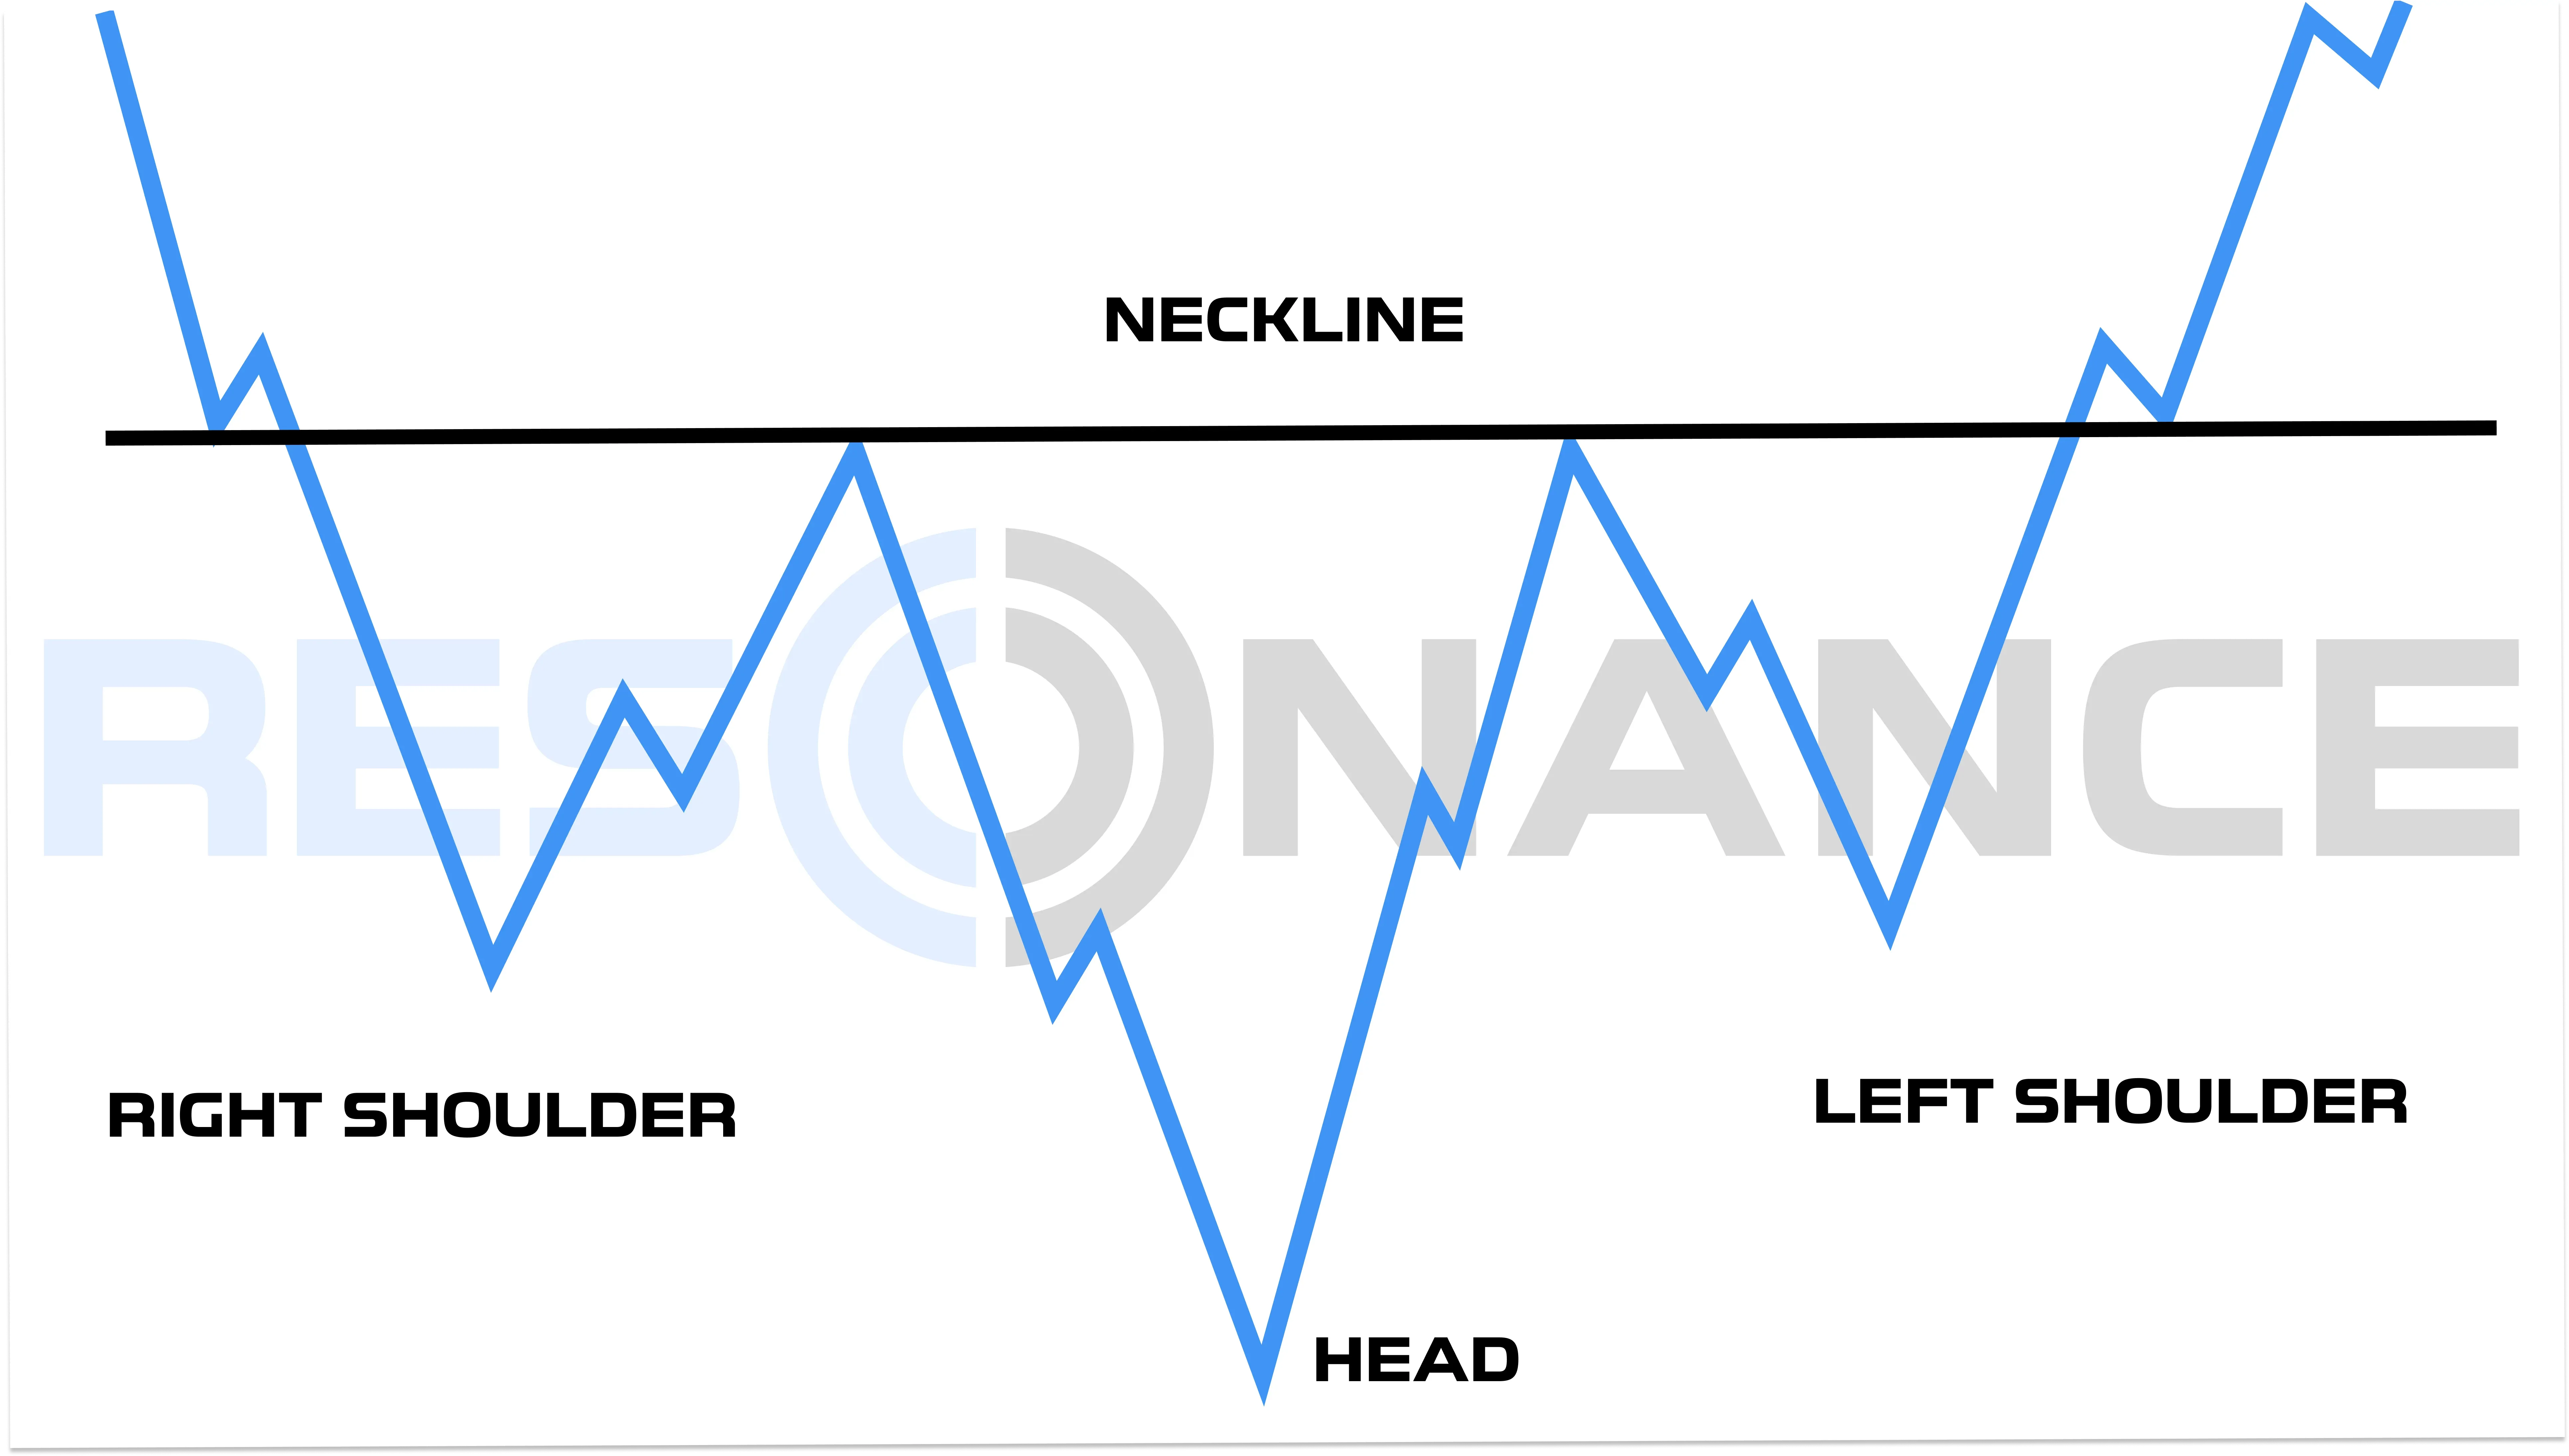
The Inverse Head and Shoulders Pattern on the Chart
The mirror model, the Inverse Head and Shoulders pattern, occurs at the end of a downtrend:
- Three minimums are formed, where the central one is the deepest.
- A breakout of the neckline upwards — a potential upward reversal.
So What is the Real Problem?
The pattern on the chart itself does not account for the key factor — the effectiveness of volume influence on price. Therefore, it often brings losses to traders instead of the expected profit.
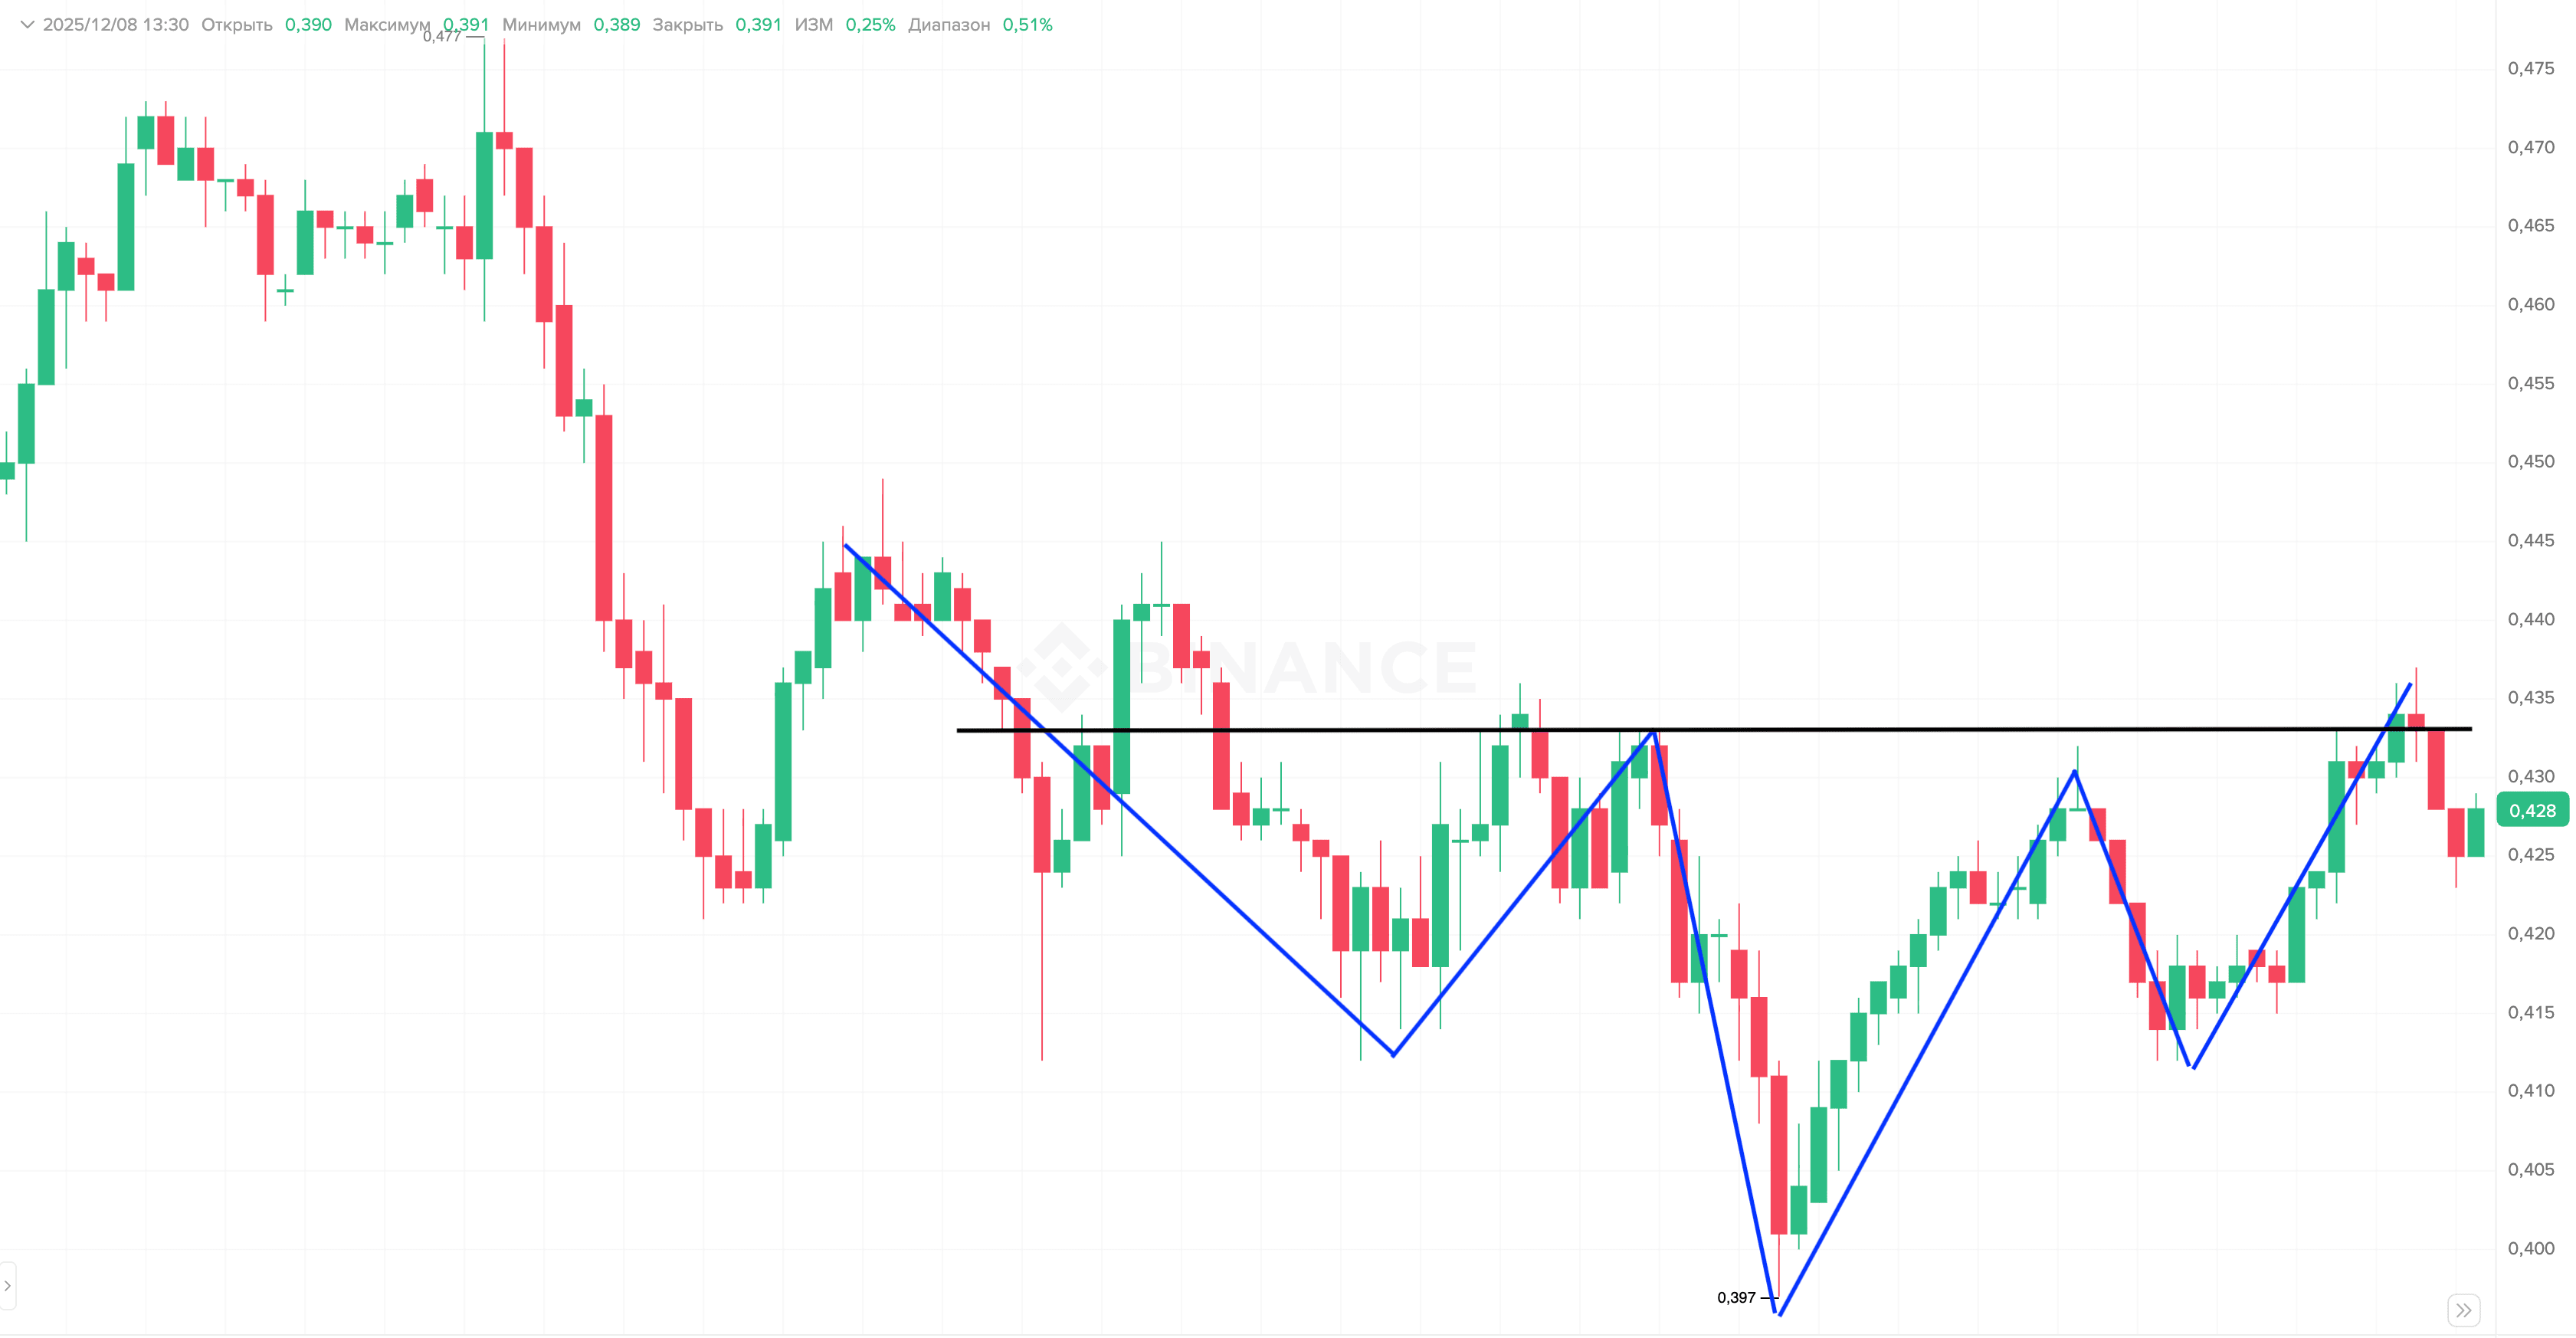
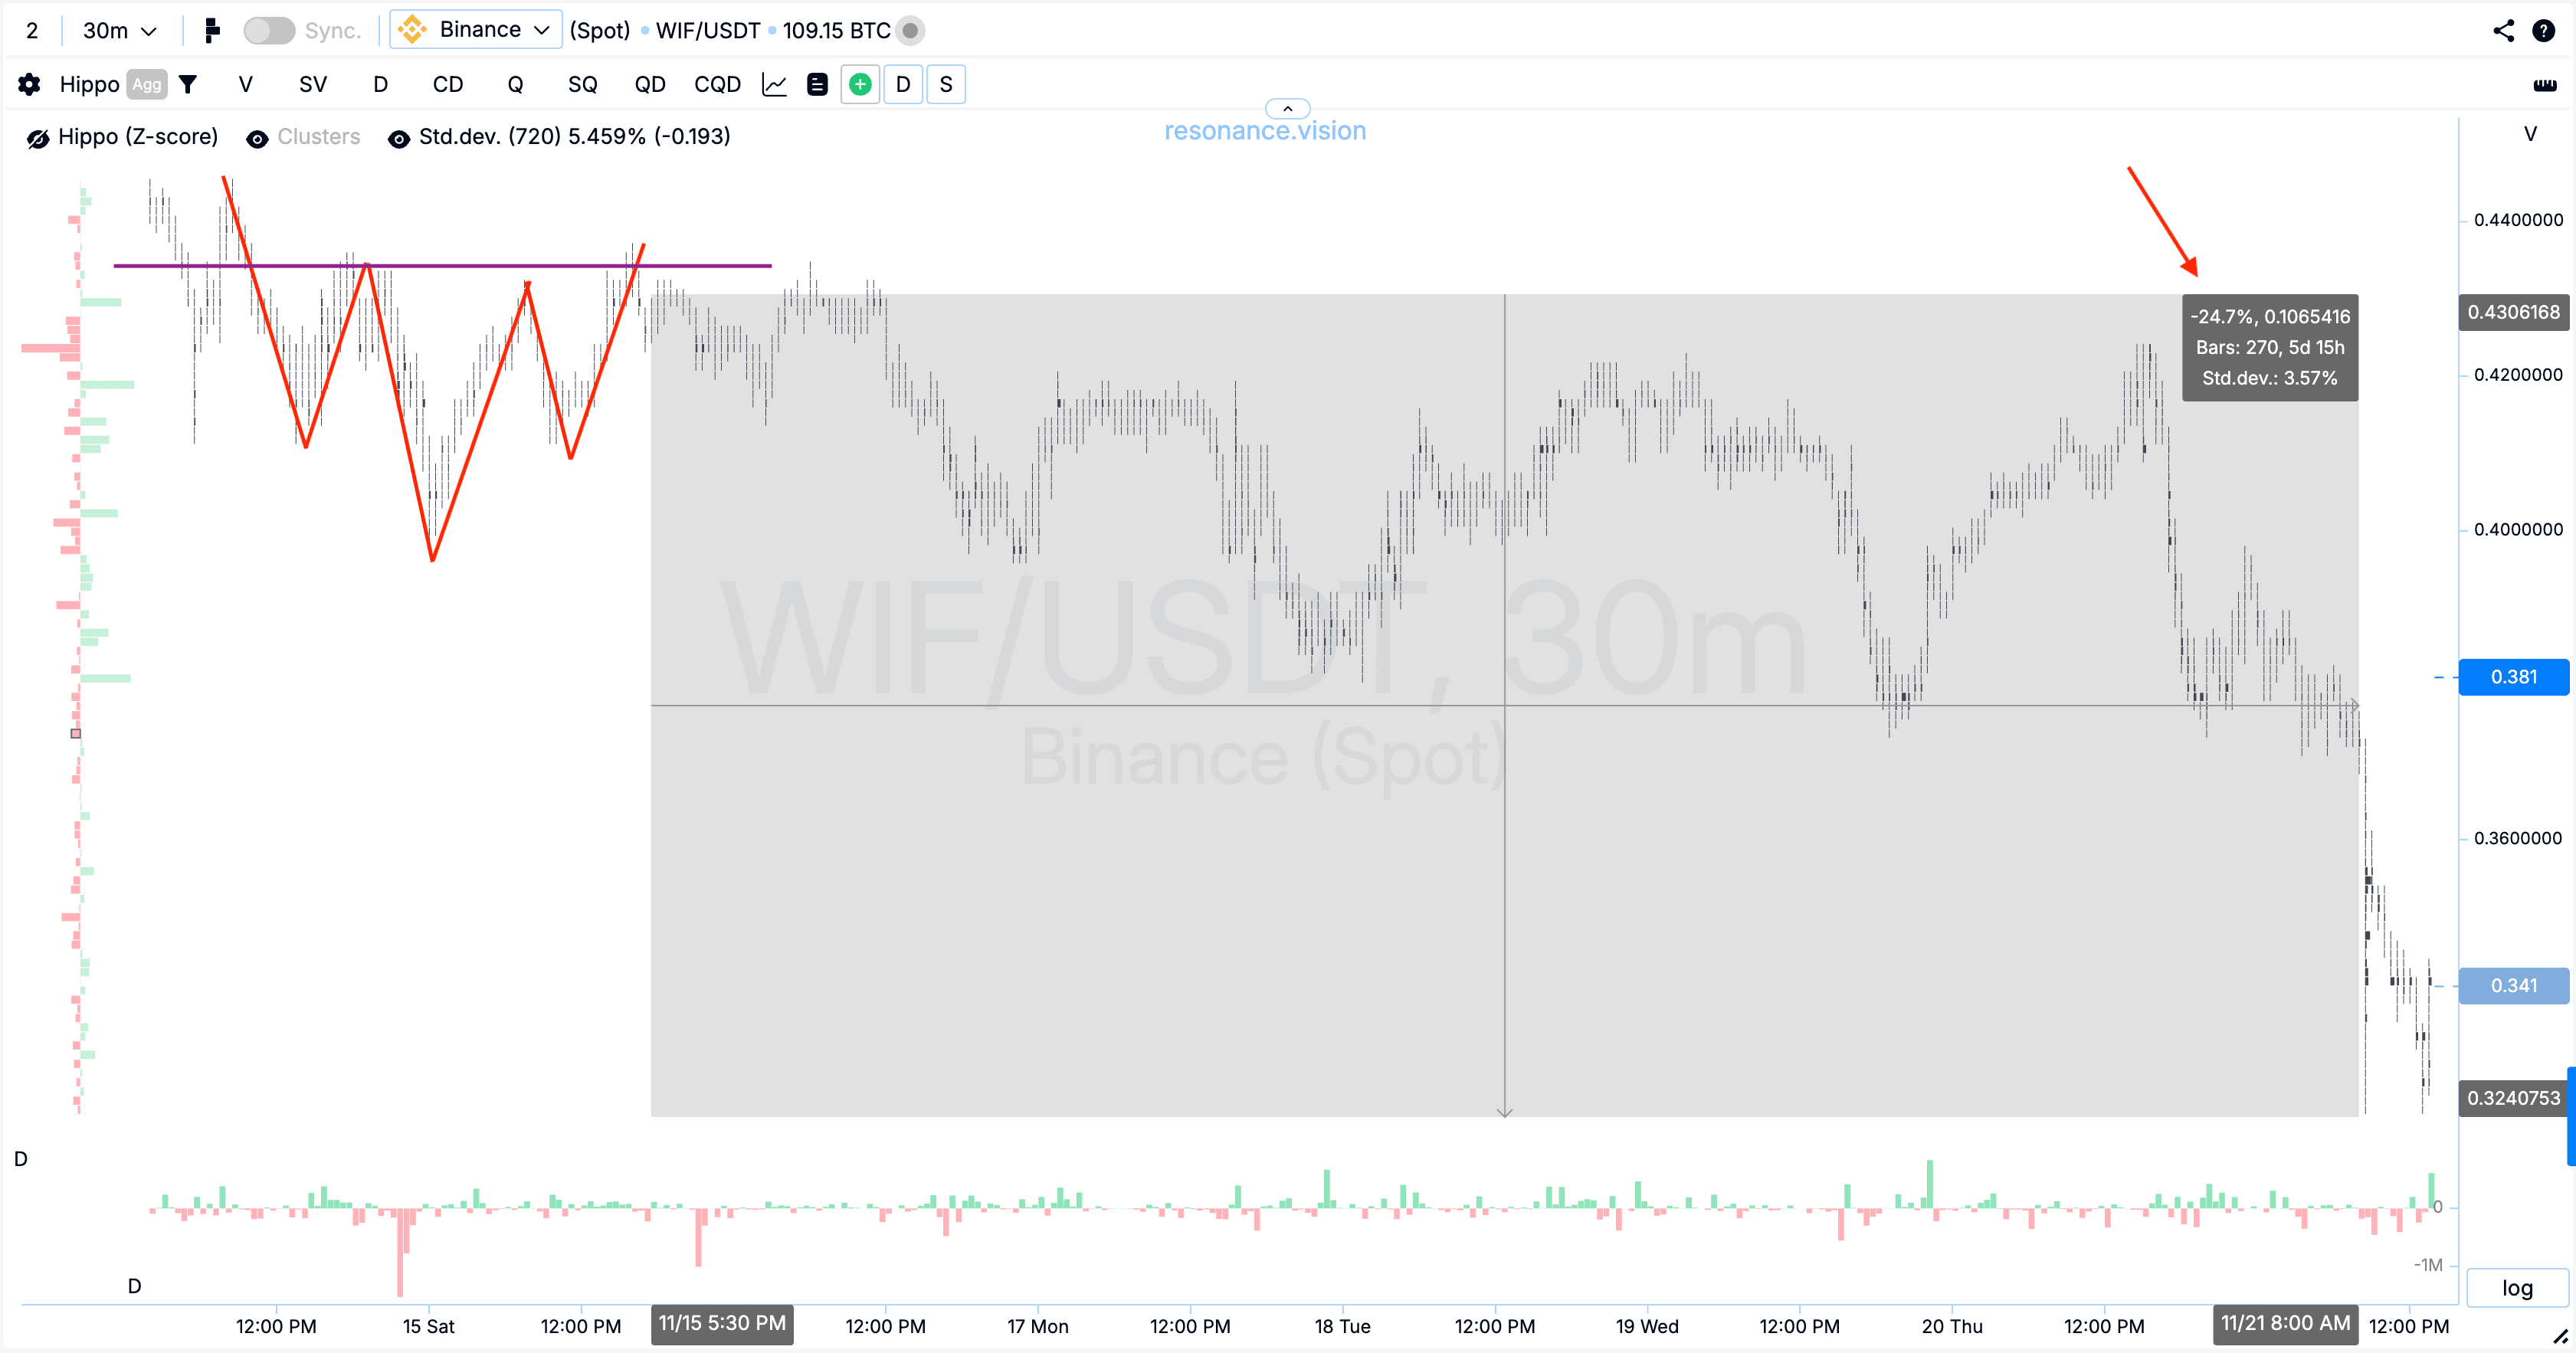
Let’s consider the situation of a downtrend - inverse Head and Shoulders: a trader found the ideal Head and Shoulders formation, entered a long position, and expects the price to rise. But the price goes against them instead.
Why?
Because in trading, the Inverse Head and Shoulders pattern says nothing about what volumes are behind the movement, how effective they are, and how the price actually reacts to market and limit orders.
For example, cluster analysis can show that at the moment the trader saw the Head and Shoulders pattern:
- market buys are ineffective (red rectangle),
- the price increase on buys does not update the local maximum (red line),
- buys do not show the desired result — the price does not update the maximum, and these are signs of surplus (prophicit).
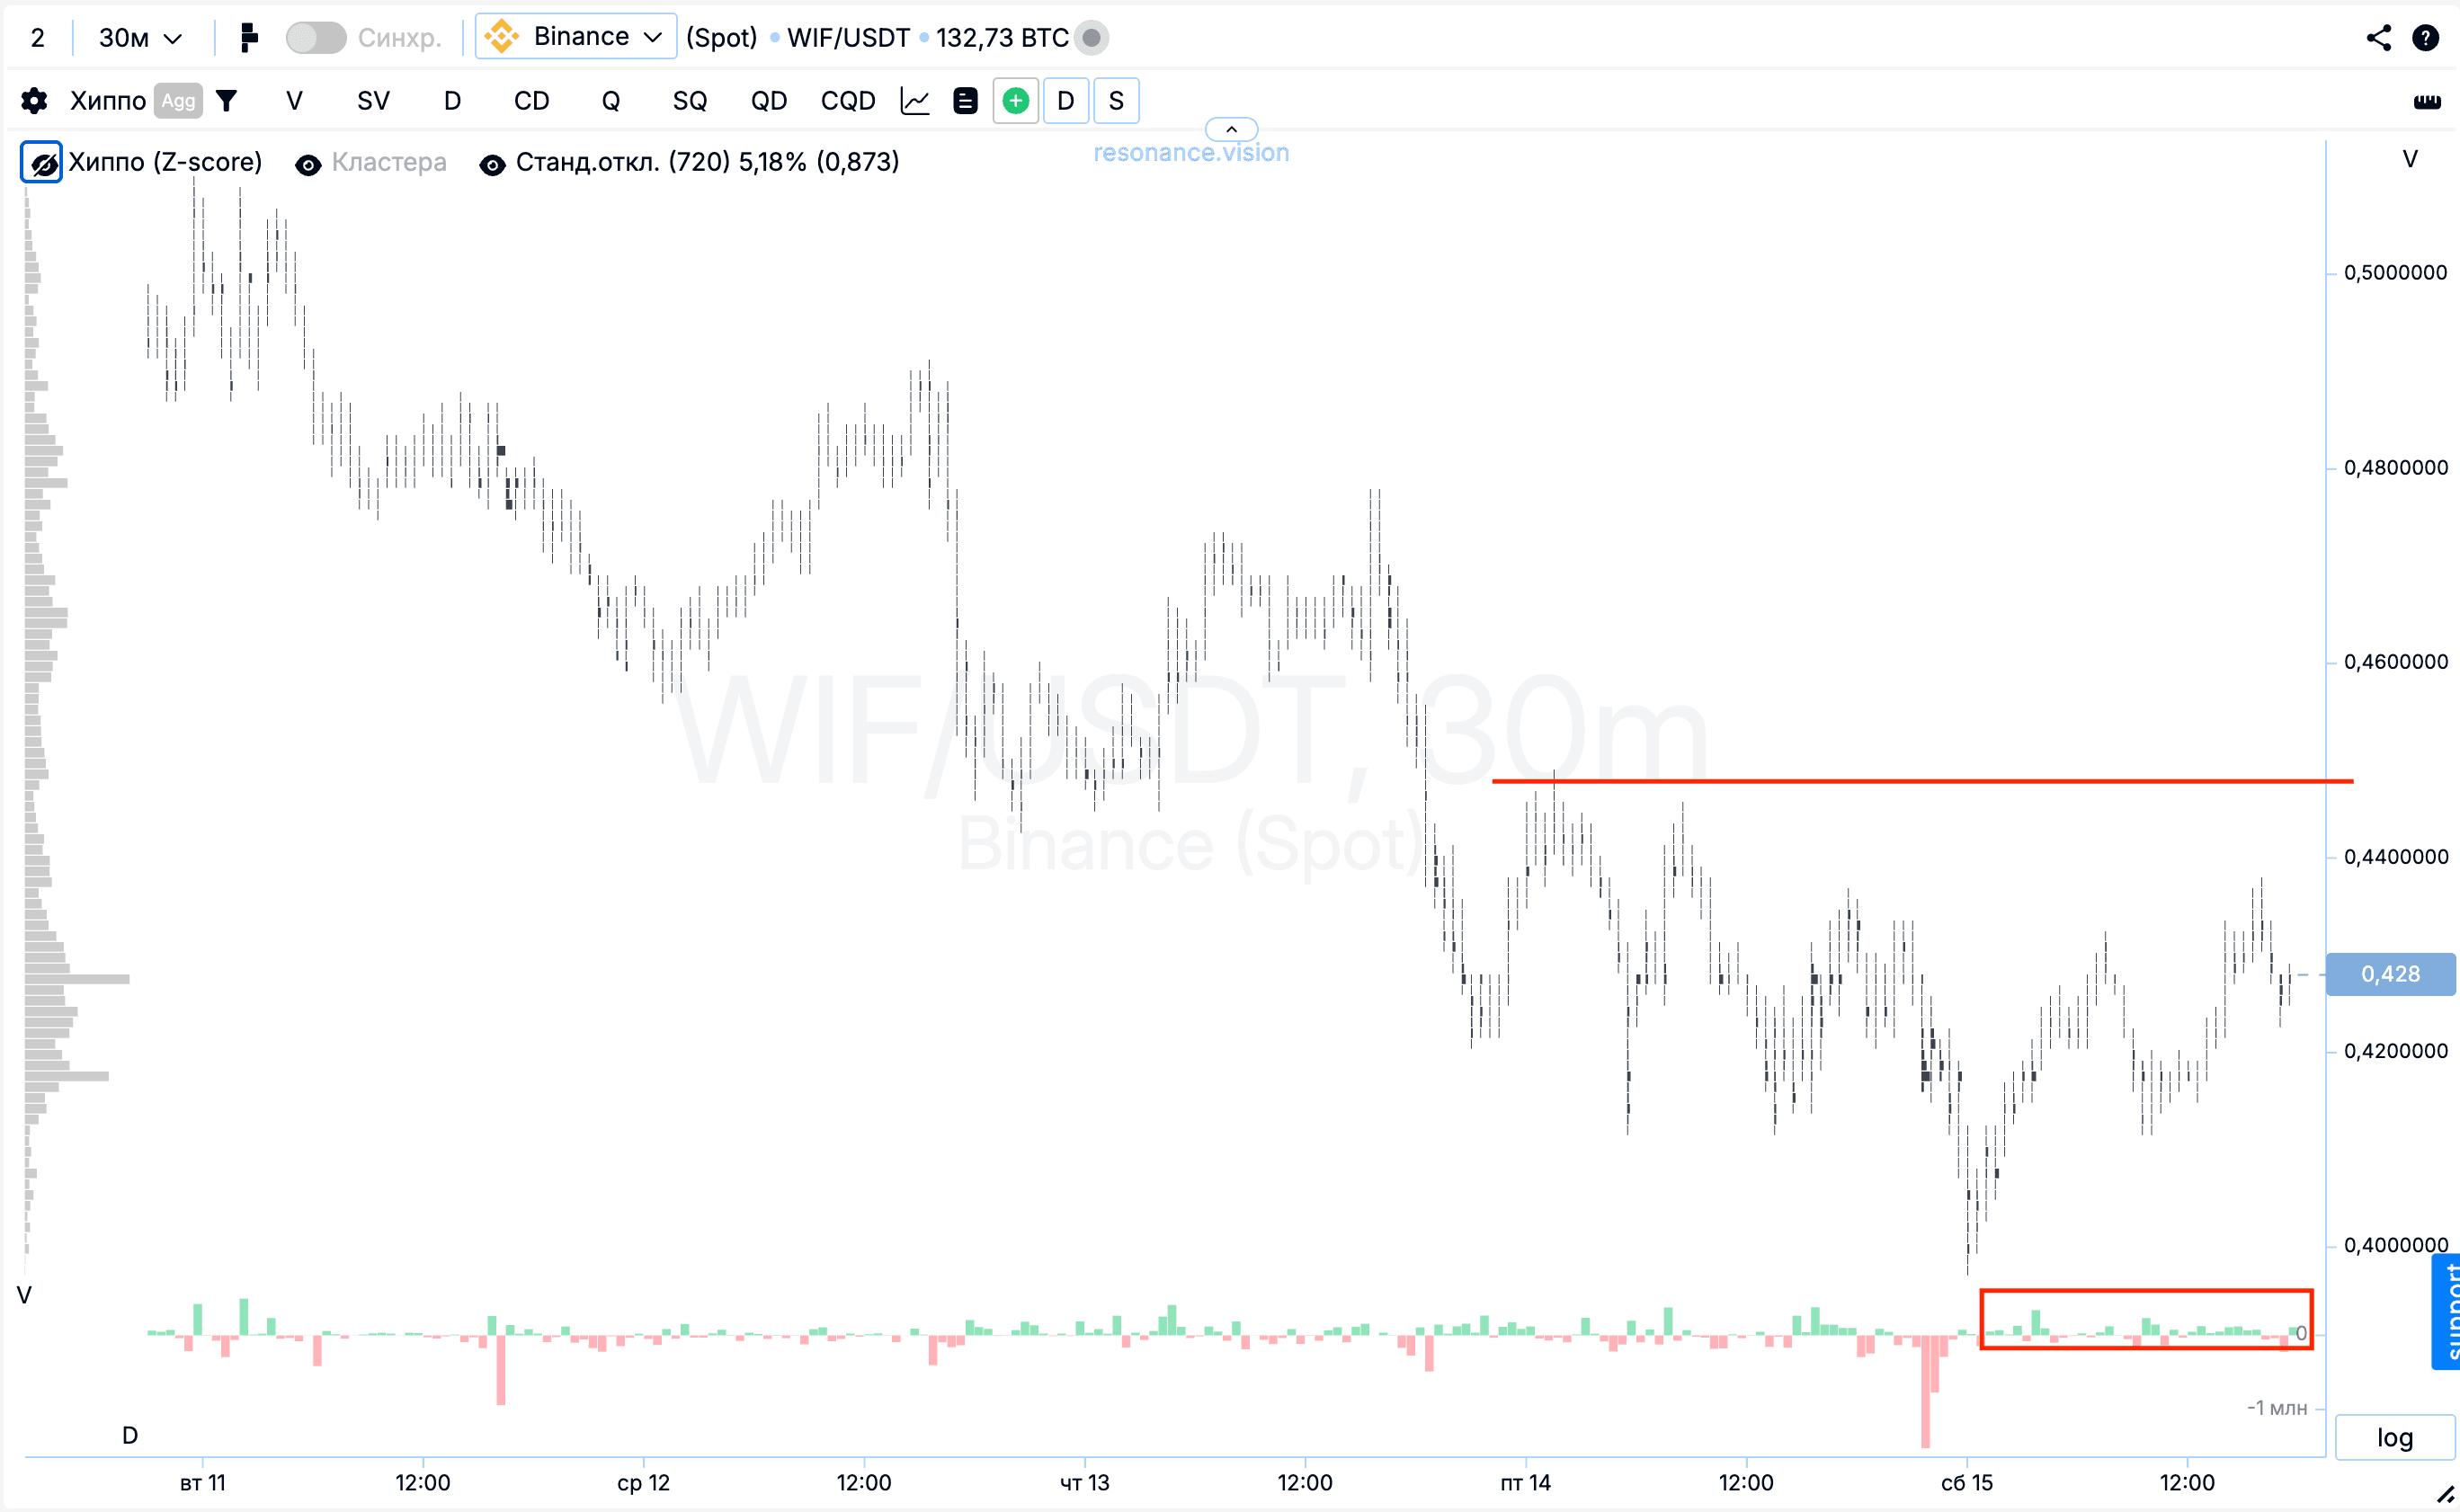
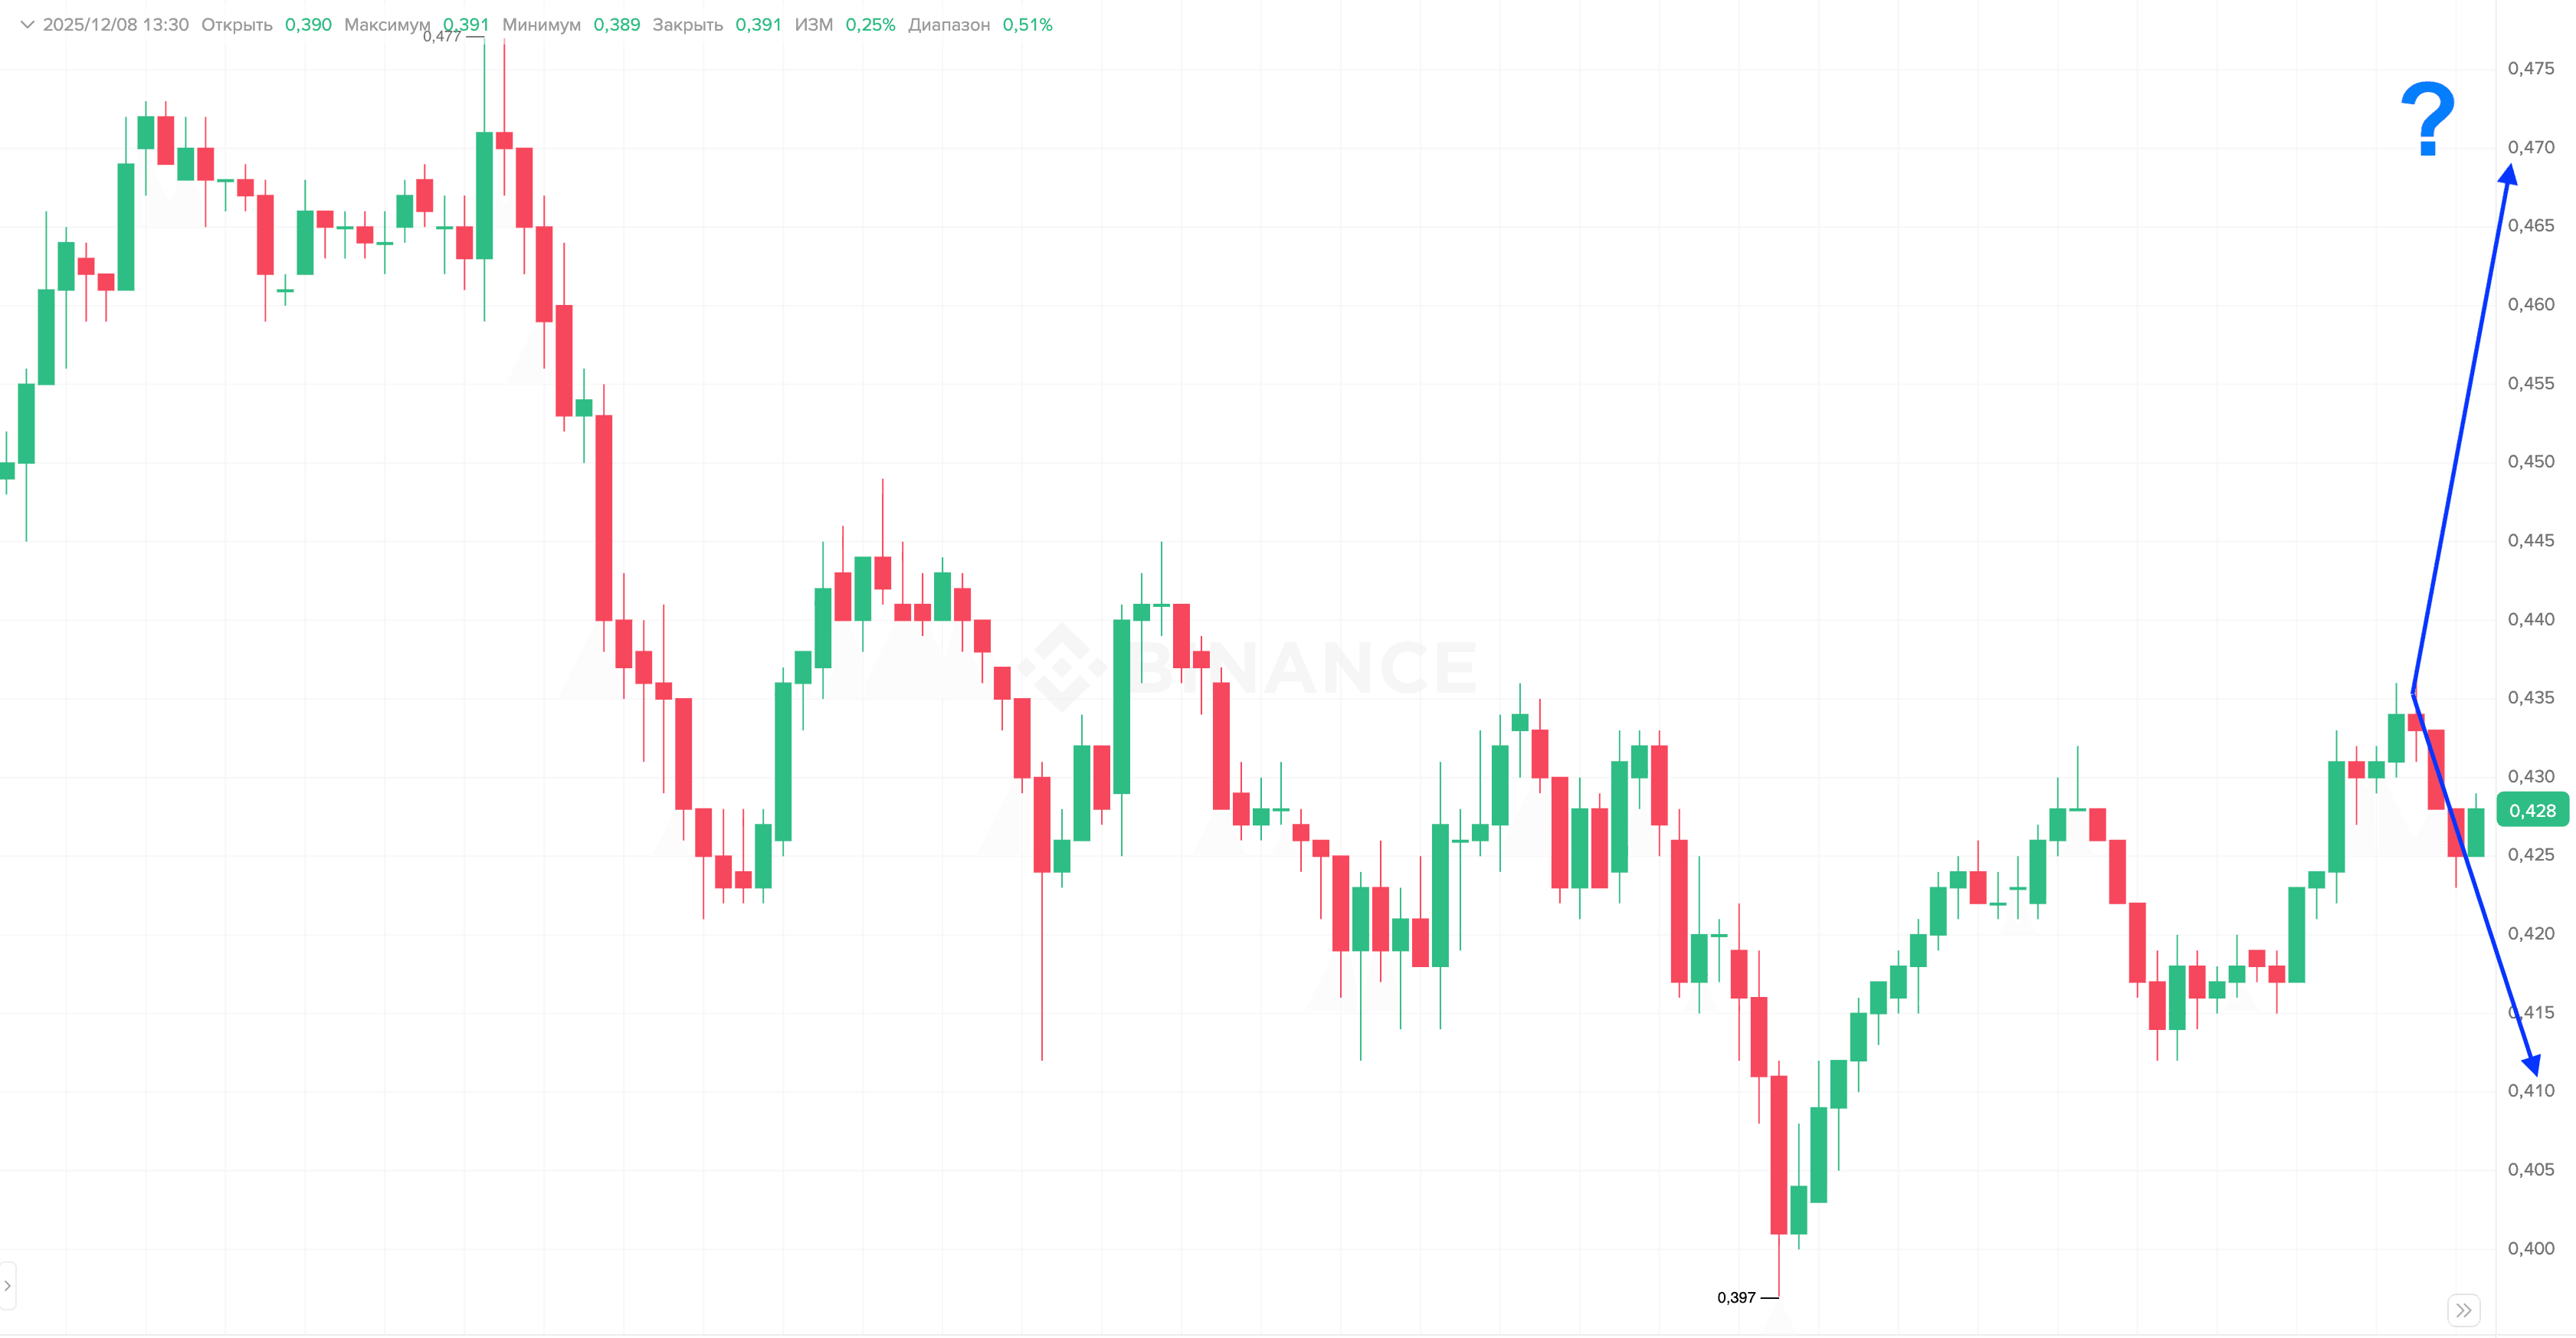
We also look at the limit order heatmap, where anomalous limit densities are visible above the chart, absorbing the entire market volume for buying and forming local limit resistance, restraining further price growth.

And if there is a surplus — the price will decline despite the pattern. This is exactly what happened in the example provided: the price dropped almost 25% further, completely disproving the “ideal” signal — the Head and Shoulders pattern.
Because the price in any market is always formed by the balance of supply and demand. Our task is to accurately determine whose side is currently dominating.
How to Solve the Problem of Losses When Trading with Technical Analysis
1. Abandon Blind Faith in Patterns Technical analysis and visual patterns in trading are just form. They do not show what is actually happening with supply and demand in the market.
2. Move to Objective Analysis of the Causes of Price Movement Analyze the cluster chart, specifically looking at:
- how volumes affect the price;
- which orders prevail;
- where a deficit or surplus (prophicit) is evident;
- which participants are truly moving the market.
In trading, it is important to rely on objective market data; only this way can one truly understand who is currently dominating — supply or demand. This allows one to avoid falling under the influence of subjective interpretations and not become part of the crowd that relies solely on classical technical analysis.
3. Use a Platform Focused on Cluster Analysis This is exactly what the Resonance platform was created for. With our analytical tools, you can:
- assess the effectiveness of market orders;
- see the behavior of limit orders on the heatmap;
- objectively understand the current market phase — we wrote about the phases in the article;
- trade deliberately.
Conclusion
The Head and Shoulders pattern is nothing more than a visual reflection of price movement that the trader sees. It cannot be useful and should never be the basis for a trading decision.
Only the assessment of volume influence on price, understanding market phases, and objective analysis of supply and demand allow a trader to trade confidently and profitably over the long term.
That is why Resonance helps market participants trade consciously, avoiding illusions and false signals.
Follow new insights in our telegram channel.
No need to invent complex schemes and look for the "grail". Use the Resonance platform tools.
Register via the link — get a bonus and start earning:
OKX | BingX | KuCoin.
Promo code TOPBLOG gives you a 10% discount on any Resonance tariff plan.
Recommended articles


