Trading Performance Analysis: Why One Trade Is Not Enough
Why one trade is not enough to evaluate your trading performance and how statistics help analyze results and identify mistakes.
Table of contents
- 01How do you know how well you are actually trading?
- 02Why a Winning Trade Can Tell You Very Little
- 03Why One Losing Trade Proves Almost Nothing
- 04Look at the Sample, Not the Last Trade
- 05What Should You Review After a Trading Session?
- 06Separate Strategy Problems From Execution Problems
- 07Win Rate Is Only One Part of the Picture
- 08The Final Result Does Not Tell You How It Was Achieved
- 09Do Not Look for One Metric That Explains Everything
- 10How Resonance Turns Practice Into Data You Can Analyze
- 11Build a Repeatable Review Loop
- 12Frequently Asked Questions
- 13What Is Trading Performance Analysis?
- 14Can a Winning Trade Still Be a Poor Decision?
- 15Does One Losing Trade Mean a Strategy Does Not Work?
- 16How Many Trades Do You Need for Performance Analysis?
- 17Why Is Win Rate Not Enough?
- 18How Can You Tell Whether the Problem Is the Strategy or the Execution?

How do you know how well you are actually trading?
Looking only at your most recent trade is not enough. A profit or loss on a single trade can tell you a lot about that particular situation, but very little about the quality of your trading process as a whole.
To spot meaningful patterns, you need to move from judging individual trades to analyzing a series of decisions: what keeps repeating, where execution drifts from the plan, and what actually drives the result.
Consider two trades.
In the first, the trader deviates from the plan, enters impulsively, takes more risk than intended — but price still moves in their favor and the trade closes at a profit.
In the second, everything is done according to plan. There are clear reasons for the entry, risk is defined in advance, and the position is managed as intended. But price moves the other way and the trade ends in a loss.
Which trade was better?
If you look only at the financial outcome, the answer seems obvious: the first one.
If you evaluate the quality of the decision itself, the answer is much less clear.
A single trade tells you how one specific situation ended. It does not tell you how consistently you make decisions, whether you can follow your plan, whether the result is repeatable, or where problems may be appearing in your trading process.
For that, you need more than your best trade. You need a series of decisions and a way to analyze them.
Why a Winning Trade Can Tell You Very Little
It is easy to treat profit as confirmation that everything was done correctly.
But the final outcome and the quality of the decision are not the same thing.
You can enter without enough evidence, break your own rules, increase risk, or change the plan after entering — and still make money because the market happened to move in your favor.
If you then conclude, “The trade made money, so I did everything right,” a favorable outcome can reinforce behavior you would not actually want to repeat across a larger sample.
That is why a useful review needs to separate two questions:
- What was the outcome?
- How sound and consistent was the decision itself?
Those answers may align.
Or they may not.
Why One Losing Trade Proves Almost Nothing
The same logic works in reverse.
A losing trade does not automatically mean the decision was poor.
You may have followed predefined rules, assessed the available information correctly, and stayed within your risk plan.
The market still does not have to follow your scenario every time.
That is why one loss is not enough to conclude that the approach does not work.
In the same way, one profitable trade is not enough to conclude that the strategy works.
Both conclusions try to judge a repeatable process from a single observation.
One observation is not enough for that.
This does not mean there is a magic number of trades after which every conclusion suddenly becomes reliable. Different strategies, market conditions, and trade types can produce very different distributions of results.
What matters more is building a sample and checking whether recurring patterns begin to appear.
Look at the Sample, Not the Last Trade
With one trade, you have one story.
With a larger series, you can start comparing.
- Do you enter similar situations in a consistent way?
- Do you use the same approach to calculating risk?
- Do you start changing your rules after several losses?
- Do you manage Long and Short positions in the same way?
- Does most of the result depend on one unusually large winner?
This is where analyzing a sample becomes useful.
The goal is not simply to accumulate as many trades as possible. The goal is to collect enough observations to identify repeatable behavior.
Closing one profitable position early may mean very little.
But if you exit well before your planned target in nearly every winning trade, that is no longer just a one-off event. It is a feature of your execution.
One losing Short also tells you very little.
But if Short performance consistently differs from Long across a sample that is large enough to examine, that becomes a separate question worth investigating.
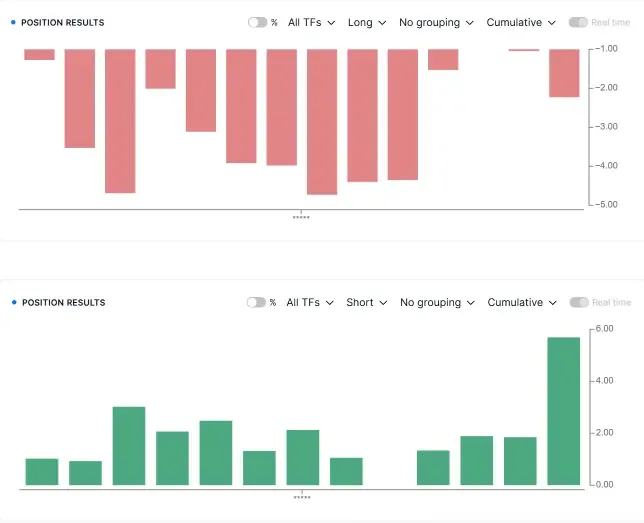
A series of trades lets you move beyond reviewing isolated outcomes and start examining the characteristics of your trading approach and execution.
What Should You Review After a Trading Session?
One of the easiest mistakes is to open the statistics and look only at the final profit or loss.
That number matters.
But it answers only one question:
What was the final result of this sample?
A useful review looks at the result in several layers.
First comes the overall picture: the final result, the number of trades, how many ended in profit or loss, and how Long and Short trades were distributed.
Then comes the structure of the result: the average winning and losing trade, whether total profits outweighed total losses, and how evenly the result was generated.
Only after that does it make sense to look more closely at execution: whether actual risk matched planned risk, whether the trading plan was followed, how positions were closed, whether there was a meaningful difference between Long and Short, and whether the same execution issues kept recurring.
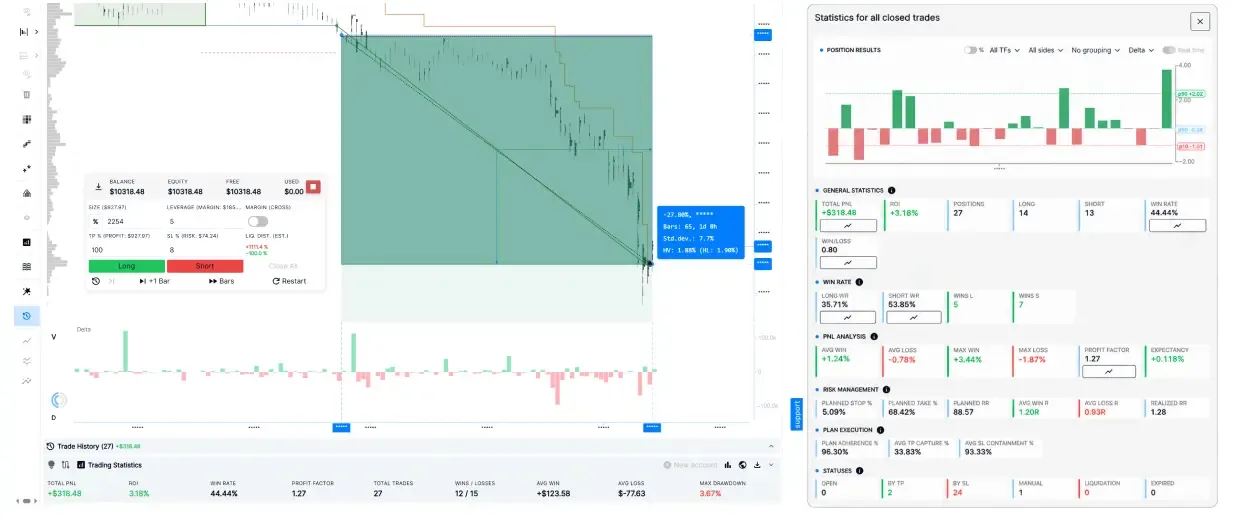
In Resonance, these layers are reflected in sample-level statistics such as Total PnL, number of positions, Long/Short split, Win Rate, average wins and losses, Profit Factor, Expectancy, planned and realized risk, plan adherence, and other breakdowns.
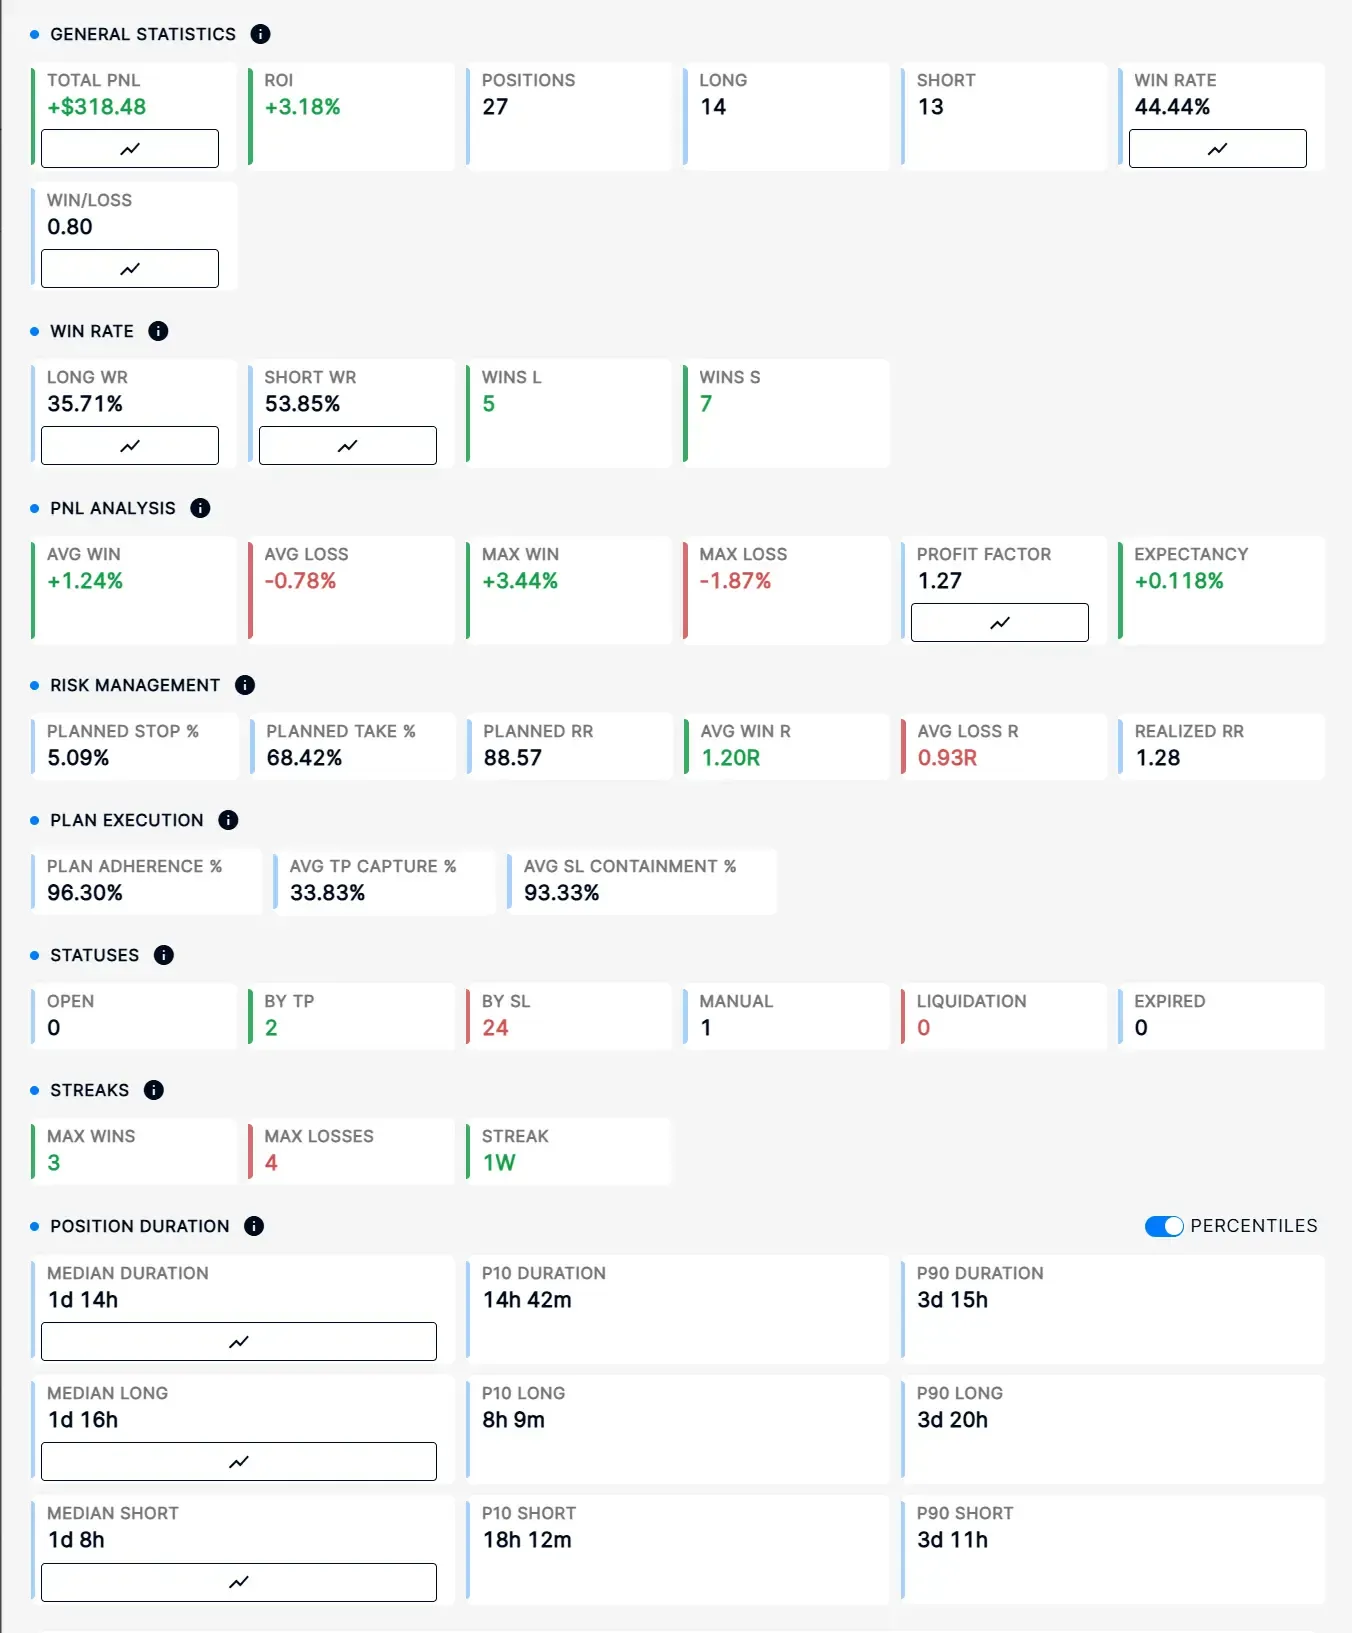
But metric names alone are not analysis.
What matters is understanding what question about the trading process each metric helps you answer.

Separate Strategy Problems From Execution Problems
This is one of the most important parts of performance analysis.
A weak result does not automatically tell you why the result was weak.
For example, the entry logic may be consistent, while profitable positions are repeatedly closed too early.
Planned risk may look reasonable, while actual losses regularly exceed it.
The overall result may be driven almost entirely by Long trades, while Short trades consistently drag the sample down.
Or the rules may be followed consistently until several losses occur in a row, after which position sizing or exit logic starts changing chaotically.
All of these situations can produce weak overall performance.
But the underlying causes are different.
Instead of asking only:
“Why did I make or lose money?”
it is more useful to break the review into more specific questions:
- Did I have a plan before making the decision?
- Did I execute what I intended before entering?
- Did I change the risk after the position was opened?
- Do I manage winning and losing trades consistently?
- Is there a persistent difference between Long and Short?
- Does the overall result depend on a small number of exceptional trades?
This turns performance analysis from a search for one “bad metric” into a diagnosis of the decision-making process.
Win Rate Is Only One Part of the Picture
Win Rate tells you what percentage of closed trades ended in profit.
But by itself, it does not answer the more important question:
What is happening to the overall result?
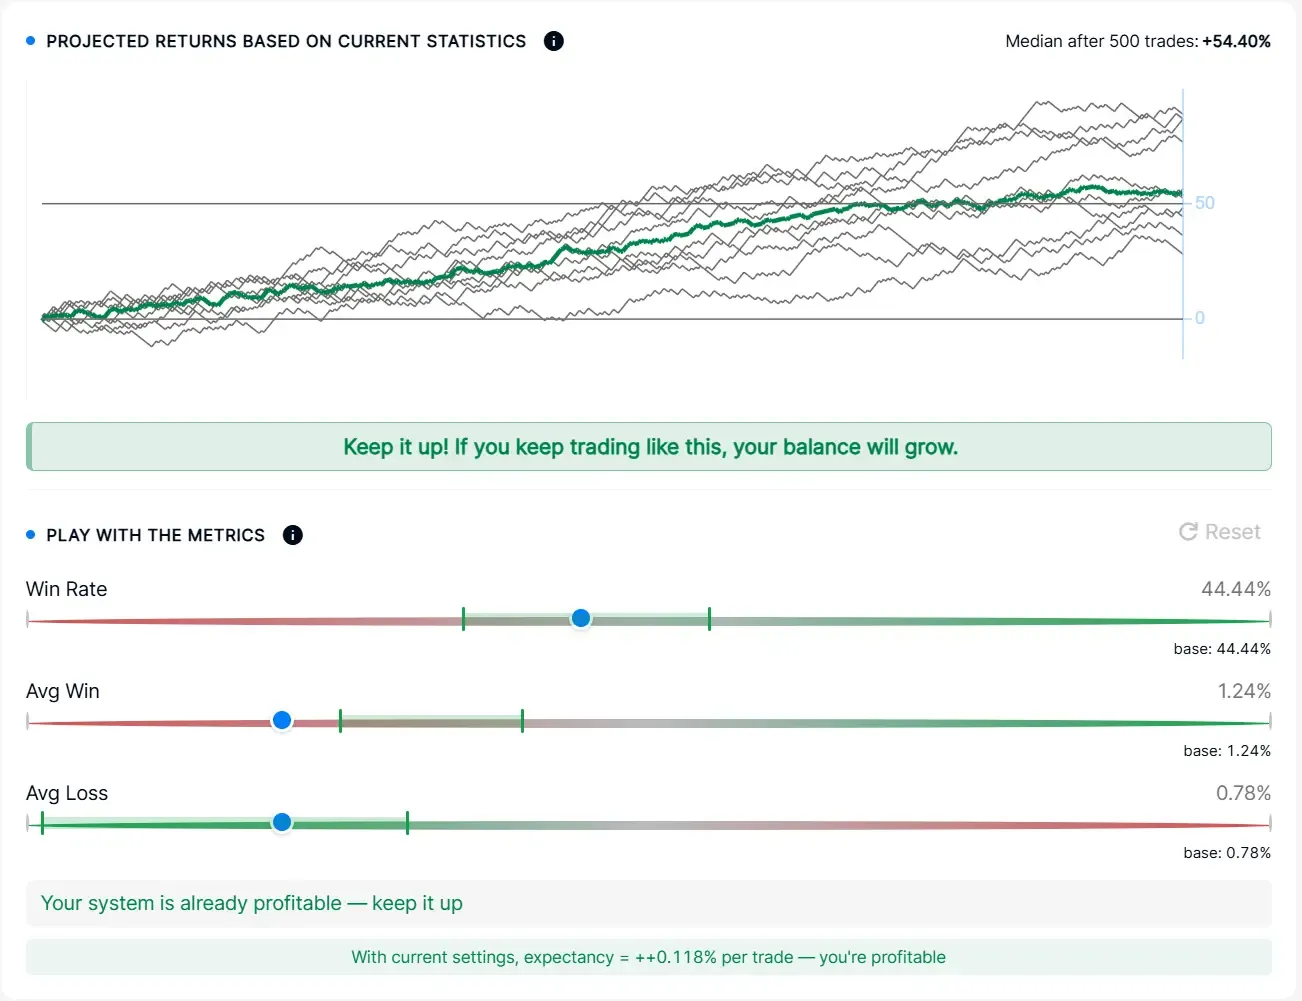
Two samples can have the same Win Rate and still produce very different financial outcomes.
The reason is simple.
It matters not only how often trades are profitable, but also how much you make on average when they win and how much you lose when they do not.
That is why Win Rate is usually reviewed alongside metrics such as Avg Win, Avg Loss, Profit Factor, Expectancy, Drawdown, and other performance measures.
For this article, one principle is enough:
No single number should be interpreted in isolation from the rest of the sample.
We will look separately at what each metric means, what it can hide, and how to read the metrics together in Trading Statistics: What to Measure Beyond Win Rate.
The Final Result Does Not Tell You How It Was Achieved
Imagine two series of trades that end with the same final result.
In the first, performance improves relatively steadily.
In the second, the balance declines for much of the sample before one large winning trade pulls the overall result into positive territory.
The final number is the same.
The structure of the result is not.
That is why it is useful to look not only at final PnL, but also at how that PnL developed over time.
A cumulative view can help show whether the result built up relatively evenly, whether it depended on isolated large wins or losses, where drawdowns appeared, and after which trades the overall picture changed.
In Simulator, results can be viewed as individual trade outcomes or as a cumulative result. Direction filters and result distributions also make it possible to move from the final number to specific parts of the sample.
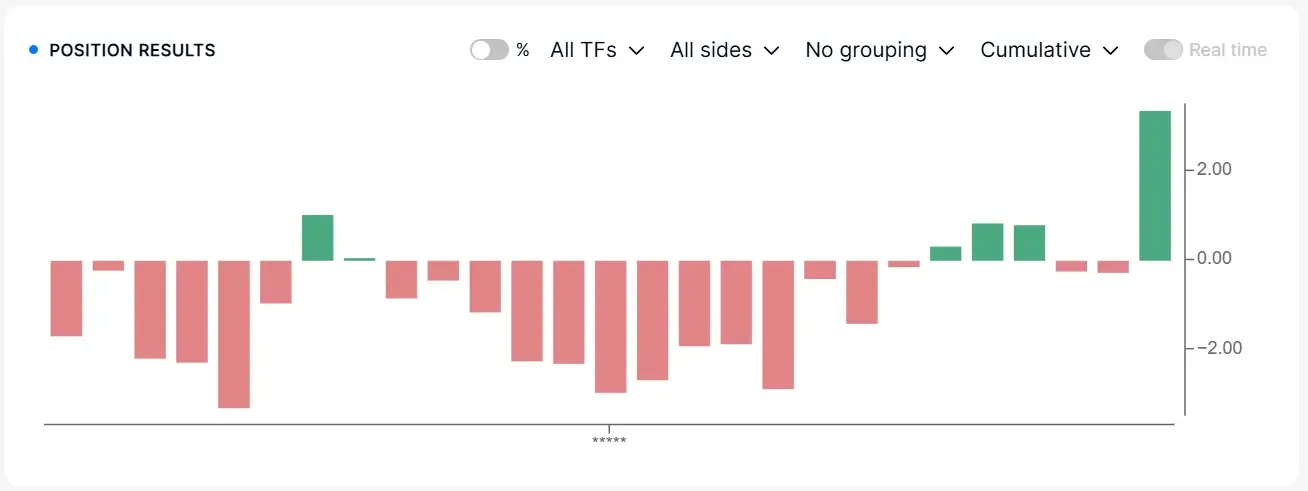
That does not mean that a “good-looking” cumulative profile proves the quality of a strategy.
Its purpose is different.
It reveals information that a single final number can hide.

Do Not Look for One Metric That Explains Everything
Trading analysis can easily swing from one extreme to another.
First, everything is judged by the latest trade.
Then the focus shifts to finding one “correct” metric that supposedly provides the final answer.
But Profit Factor does not replace risk analysis.
Win Rate does not show the size of wins and losses.
Final PnL does not explain how the result was generated.
A Long/Short split does not, by itself, explain why one direction performed better.
Statistics become useful when different metrics allow you to examine the same sample from different angles.
So this article is not about finding the single most important number.
It is about changing the way performance is evaluated:
from an isolated outcome to recurring patterns across a series of decisions.
How Resonance Turns Practice Into Data You Can Analyze
After a simulation, it is not enough to see whether the virtual balance increased or decreased.
In Resonance Trading Simulator, results can be reviewed as a sample.
The statistics show the overall result and the number of trades. They also allow you to review Long and Short separately, compare average wins and losses, and examine how planned risk compares with actual execution.
Trade History lets you return to individual positions when something unusual or recurring appears in the overall statistics.
It is also useful to review how trades were closed, winning and losing streaks, position duration, and how the cumulative result changed over time.
These data are not useful simply because they give you more numbers.
They help reveal what cannot be seen from one final figure alone: which decisions keep repeating, where execution regularly drifts from the plan, and what is actually shaping the overall result.
That is when individual trades begin to form a body of data that can be analyzed.
Build a Repeatable Review Loop
A useful review should help you understand what to check in the next series of trades.
For example, you may notice that profitable positions are often closed before the planned target.
In the next session, you can specifically watch whether that behavior repeats and what happens when you follow the original plan.
Or the statistics may reveal a clear difference between Long and Short.
The next step is not to declare one direction “bad.”
It is to review the trades and understand where the difference is coming from: trade selection, risk, position management, or exits.
That creates a repeatable loop:
plan → series of decisions → data → analysis → recurring deviation → next check
A series of trades is what makes this process possible.
One trade may make money.
Another may lose money.
But only a sample allows you to ask the more useful question:
What keeps repeating in my trading process?
Do not judge your trading by the last trade. Build a sample, analyze the process, and test your conclusions in the next sessions.
Frequently Asked Questions
What Is Trading Performance Analysis?
Trading performance analysis means evaluating a series of trading results and the process that produced them, rather than judging one individual trade. It helps identify recurring patterns in decision-making, risk management, plan execution, and other parts of the trading process.
Can a Winning Trade Still Be a Poor Decision?
Yes. If the trade was impulsive or broke predefined rules, a favorable outcome does not automatically make the decision process sound. A weak decision can still produce a profitable result.
Does One Losing Trade Mean a Strategy Does Not Work?
No. One trade is only one observation. Evaluating a repeatable process requires a series of results and an analysis of how those results were generated.
How Many Trades Do You Need for Performance Analysis?
There is no universal number that works for every strategy and every market condition. The smaller the sample, the more cautiously its results should be interpreted. The goal is to collect enough observations to examine recurring patterns rather than draw conclusions from a few isolated trades.
Why Is Win Rate Not Enough?
Win Rate shows the percentage of profitable trades, but it does not account for the size of wins and losses, the shape of drawdowns, or how much the overall result depends on a few unusually large trades. It should therefore be interpreted alongside other performance measures.
How Can You Tell Whether the Problem Is the Strategy or the Execution?
Compare what was planned with what actually happened across a series of trades. If entry rules remain consistent but risk, exits, or trade management repeatedly drift from the plan, the problem may be execution. If the rules are followed consistently but the sample still shows weak results, the trading approach itself may need further review.
Theory builds understanding. Practice builds trading skills.
With Trading Simulator by Resonance, you can practice trading decisions using historical market data, test your strategies, analyze mistakes, and gain experience without risking real capital.
🚀 Try Trading Simulator and turn market knowledge into practical experience.
🎁 Use promo code TOPBLOG to get 10% off any Resonance subscription plan.
📢 Follow new articles, market insights, and practical trading content in our Telegram channel.
🔗 Register with our partner exchanges:
Recommended articles