Grid Bot: The 100% Monthly Profit Strategy on a Sideways Market and Step-by-Step Guide

A detailed guide on how to use the Grid Bot to achieve 100% monthly profit. Breakdown of the 6 stages of a trade: from screening ideal assets (significant drop, trend change) to validation using a cluster chart (signs of balance) and implementation with a long Grid Bot. Key settings (range, grids, SL/TP) and the importance of capital diversification.
Table of contents
How can you achieve 100% monthly profit on your capital? The answer lies not in aggressive directional trades, but in a tool that effectively monetizes volatility within a range – the Grid Bot (Grid Trading Bot). This is an execution tool that is part of a complex trading process consisting of six stages: Analysis, Validation, Implementation, Management, and Profit Realization.
It is the Implementation stage using the Grid Bot that allows a boring consolidation phase to be turned into a consistent source of income.
Stages 1-2: Trigger and Analysis – How to Find the Ideal Asset
The success of a Grid Bot starts with selecting the right asset. Our goal is to find a coin that has dropped significantly but is now showing signs of accumulation or sideways movement.
1. Trigger (Screening)
A screener (e.g., the Resonance platform) is used to select ideal assets.
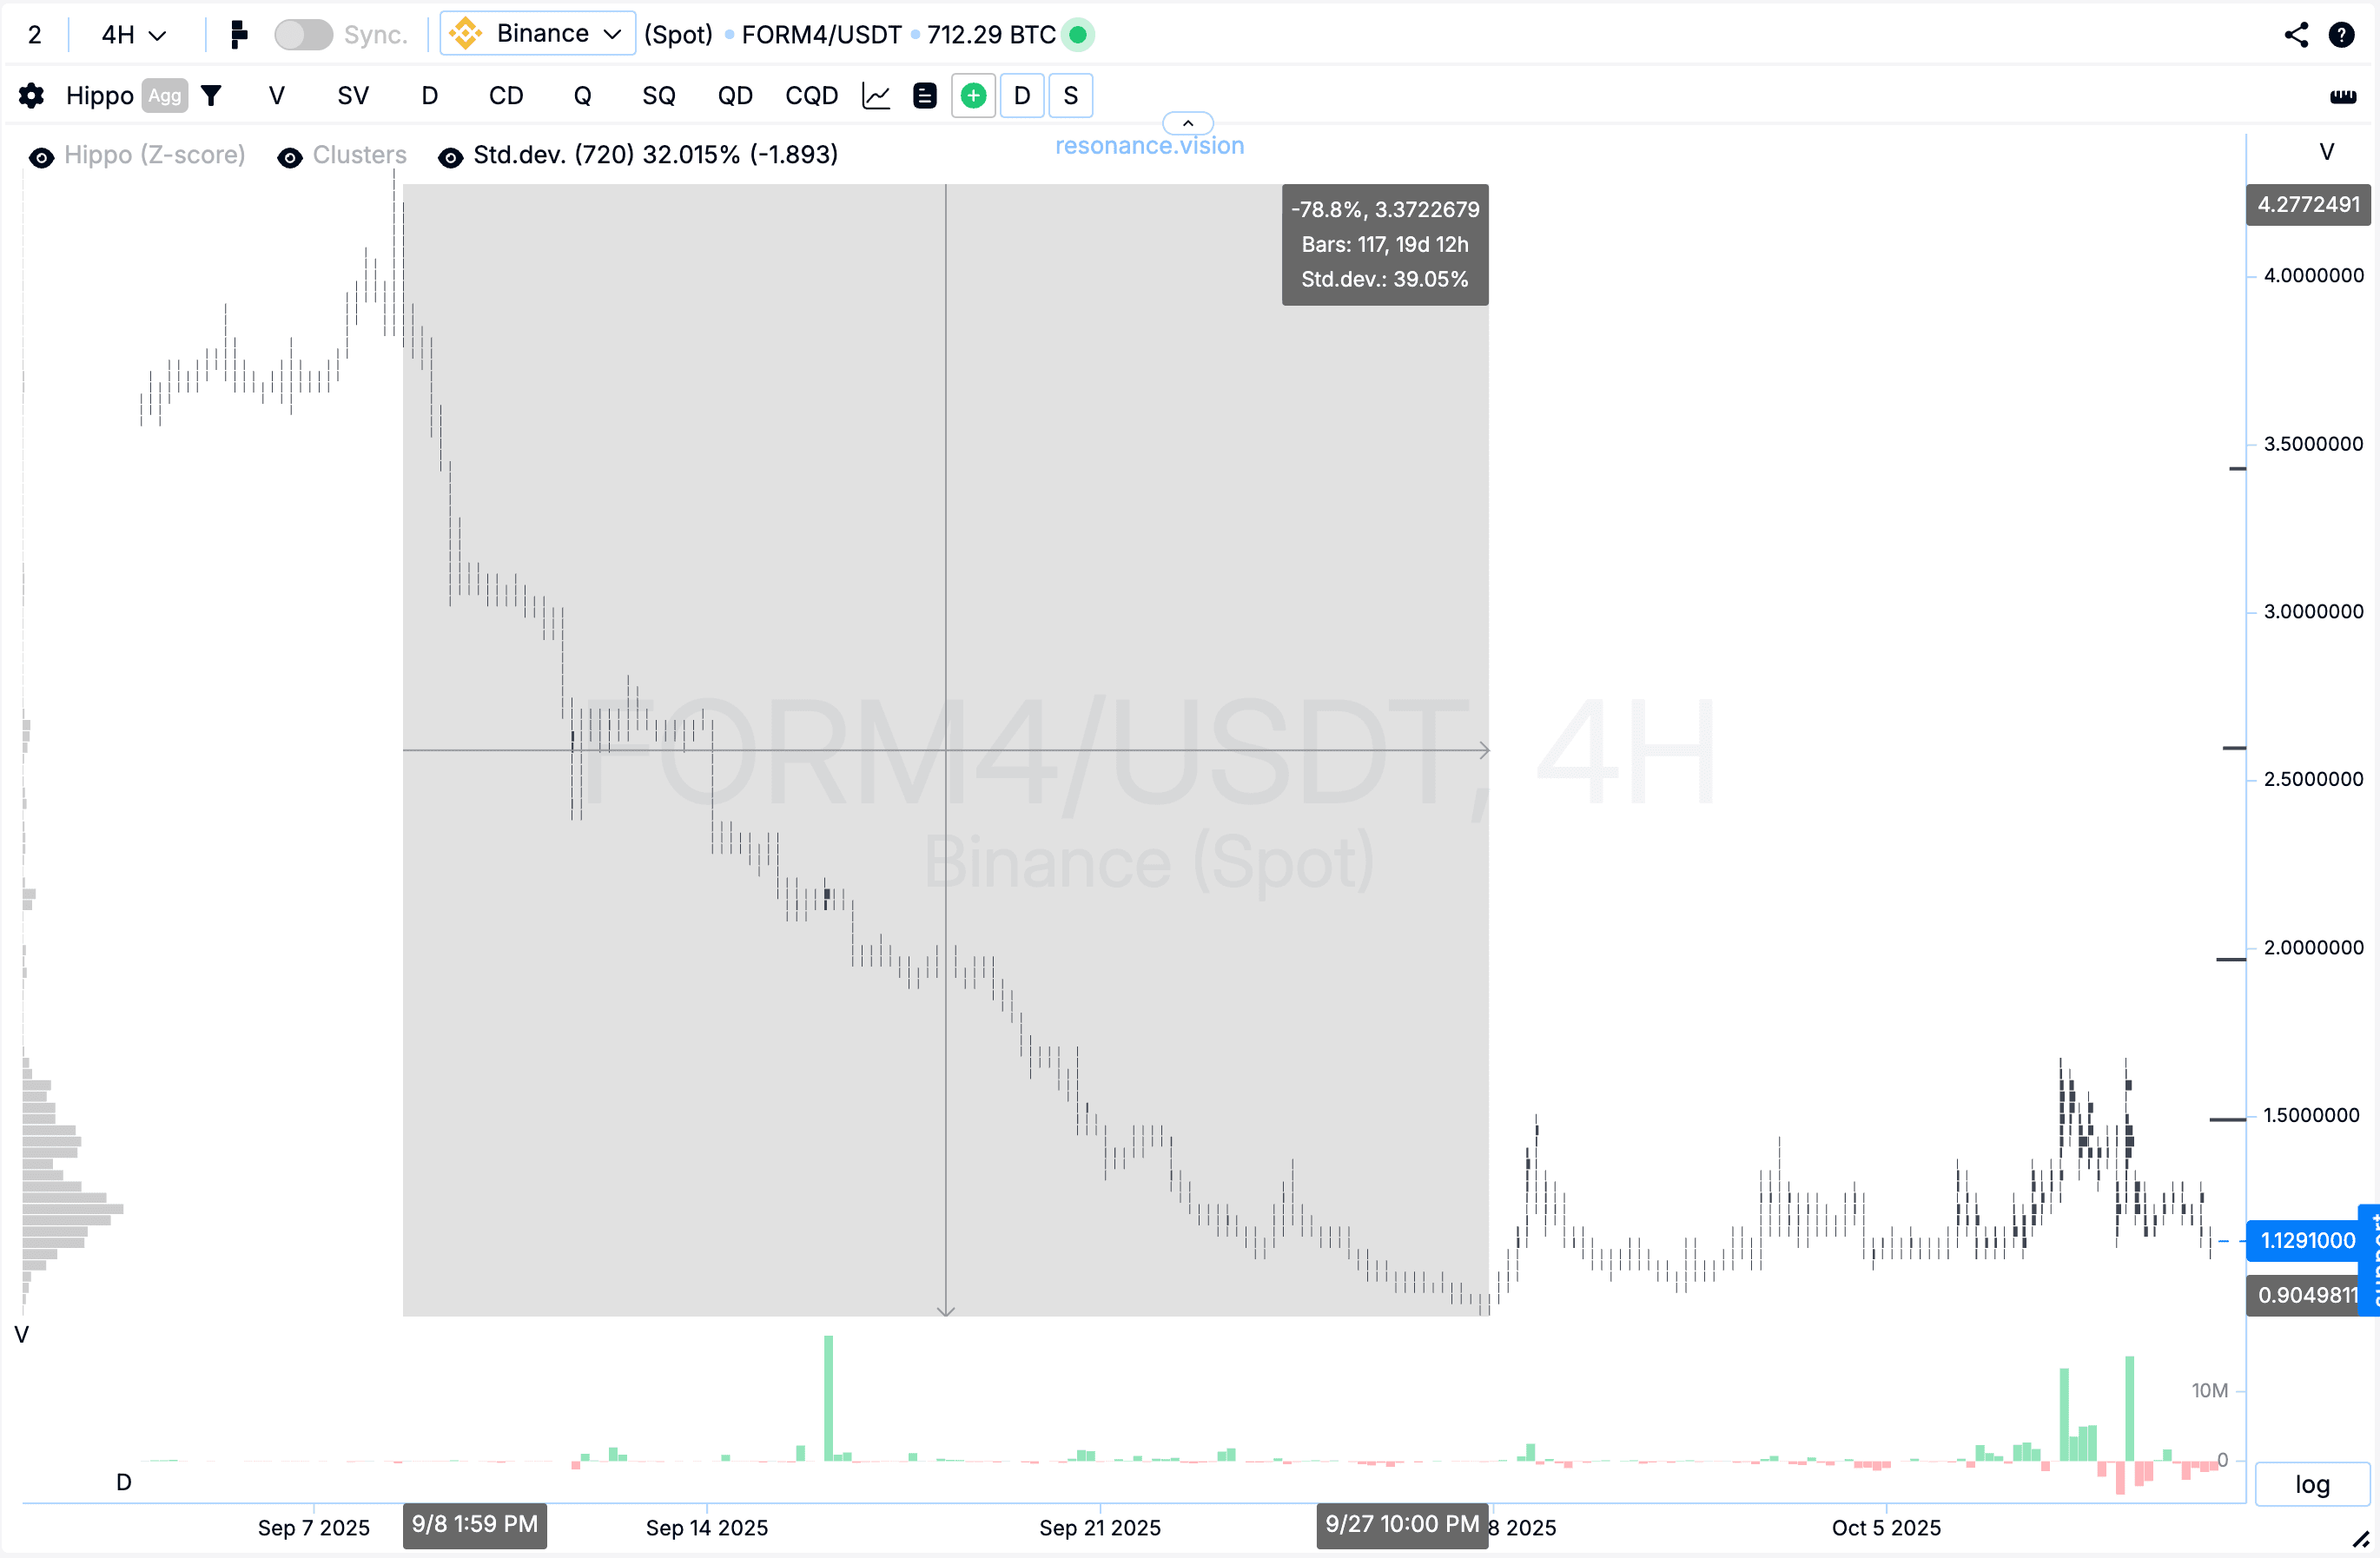
- Settings: H4 timeframe, exchanges with high liquidity (e.g., Binance Spot), ticker filter */USDT.
- Search Criterion: Assets that have experienced a significant drop (70%+) but have now halted the downtrend. This indicates that selling pressure is becoming ineffective.
2. Analysis and Validation (Cluster Chart)
The asset found by the screener is checked using a cluster chart and the Delta indicator (the difference between market buys and sells).
- Sign of Balance: If large market sales (red Delta bars) do not break the low, and large market buys (green Delta bars) do not push the price past the upper limit, it means that demand and supply are balanced.
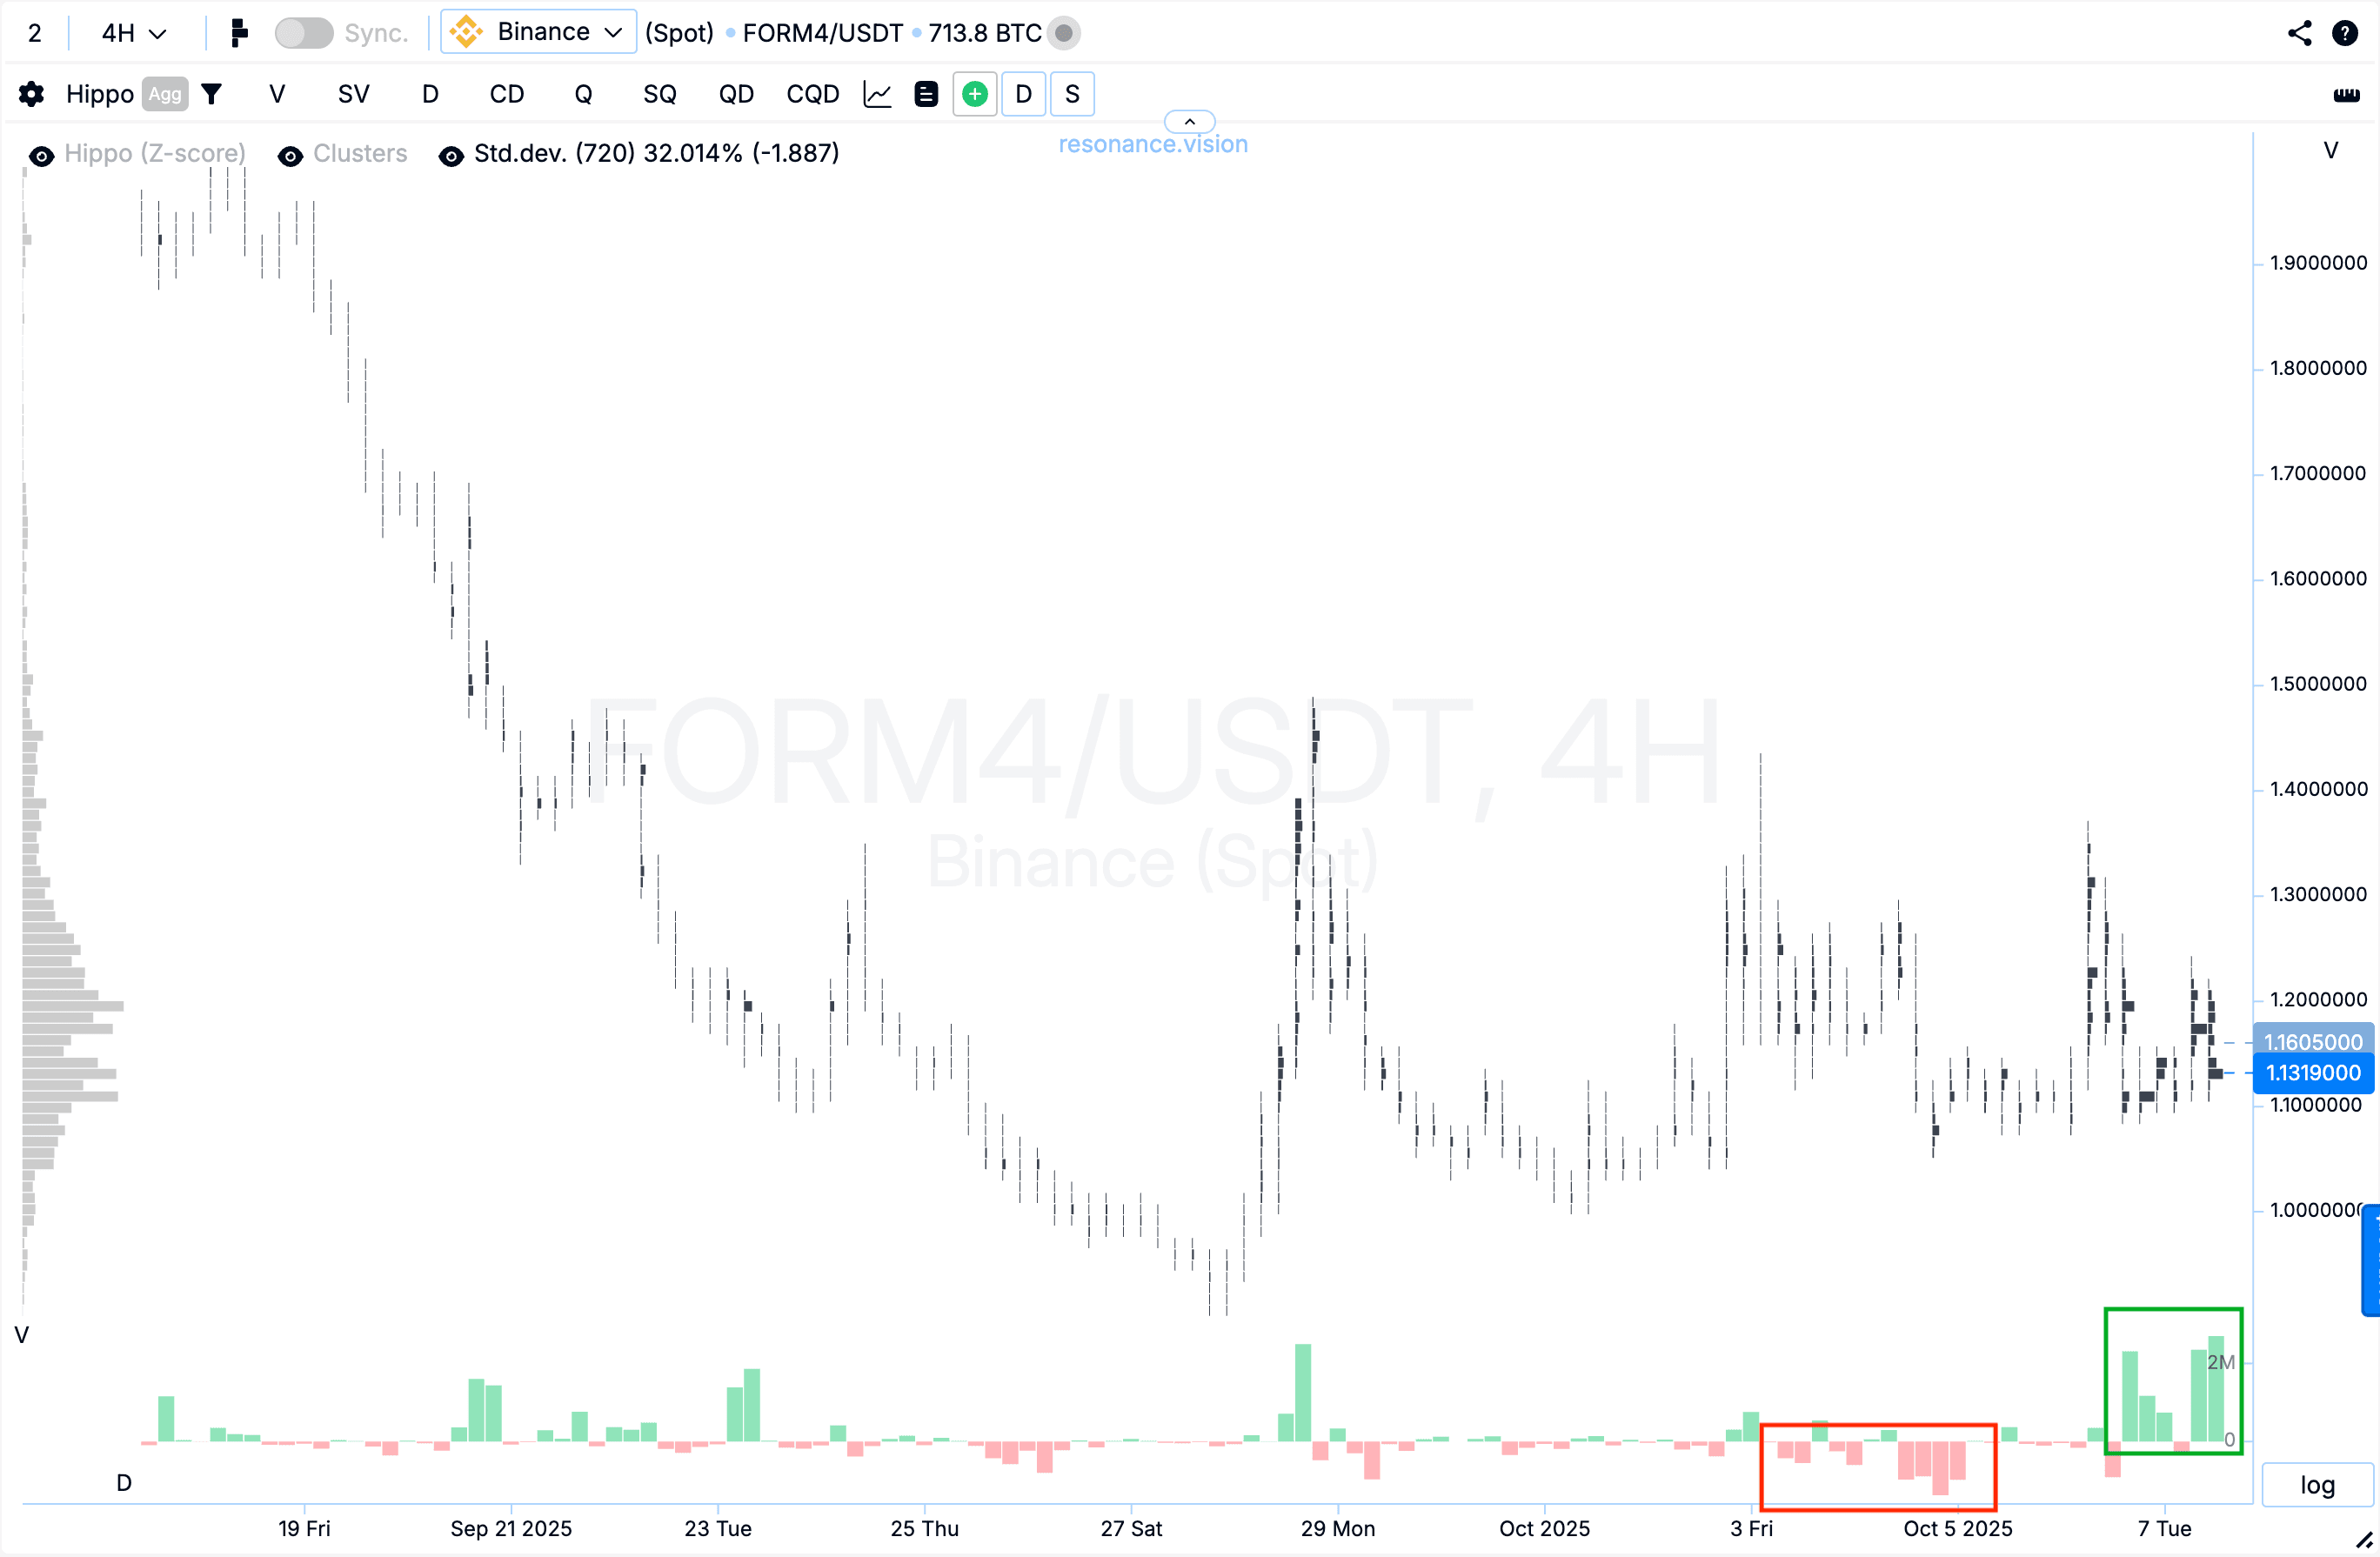
- Validation Conclusion: If the price is in prolonged sideways movement (consolidation), the Grid Bot idea is valid because the market lacks clear directionality.
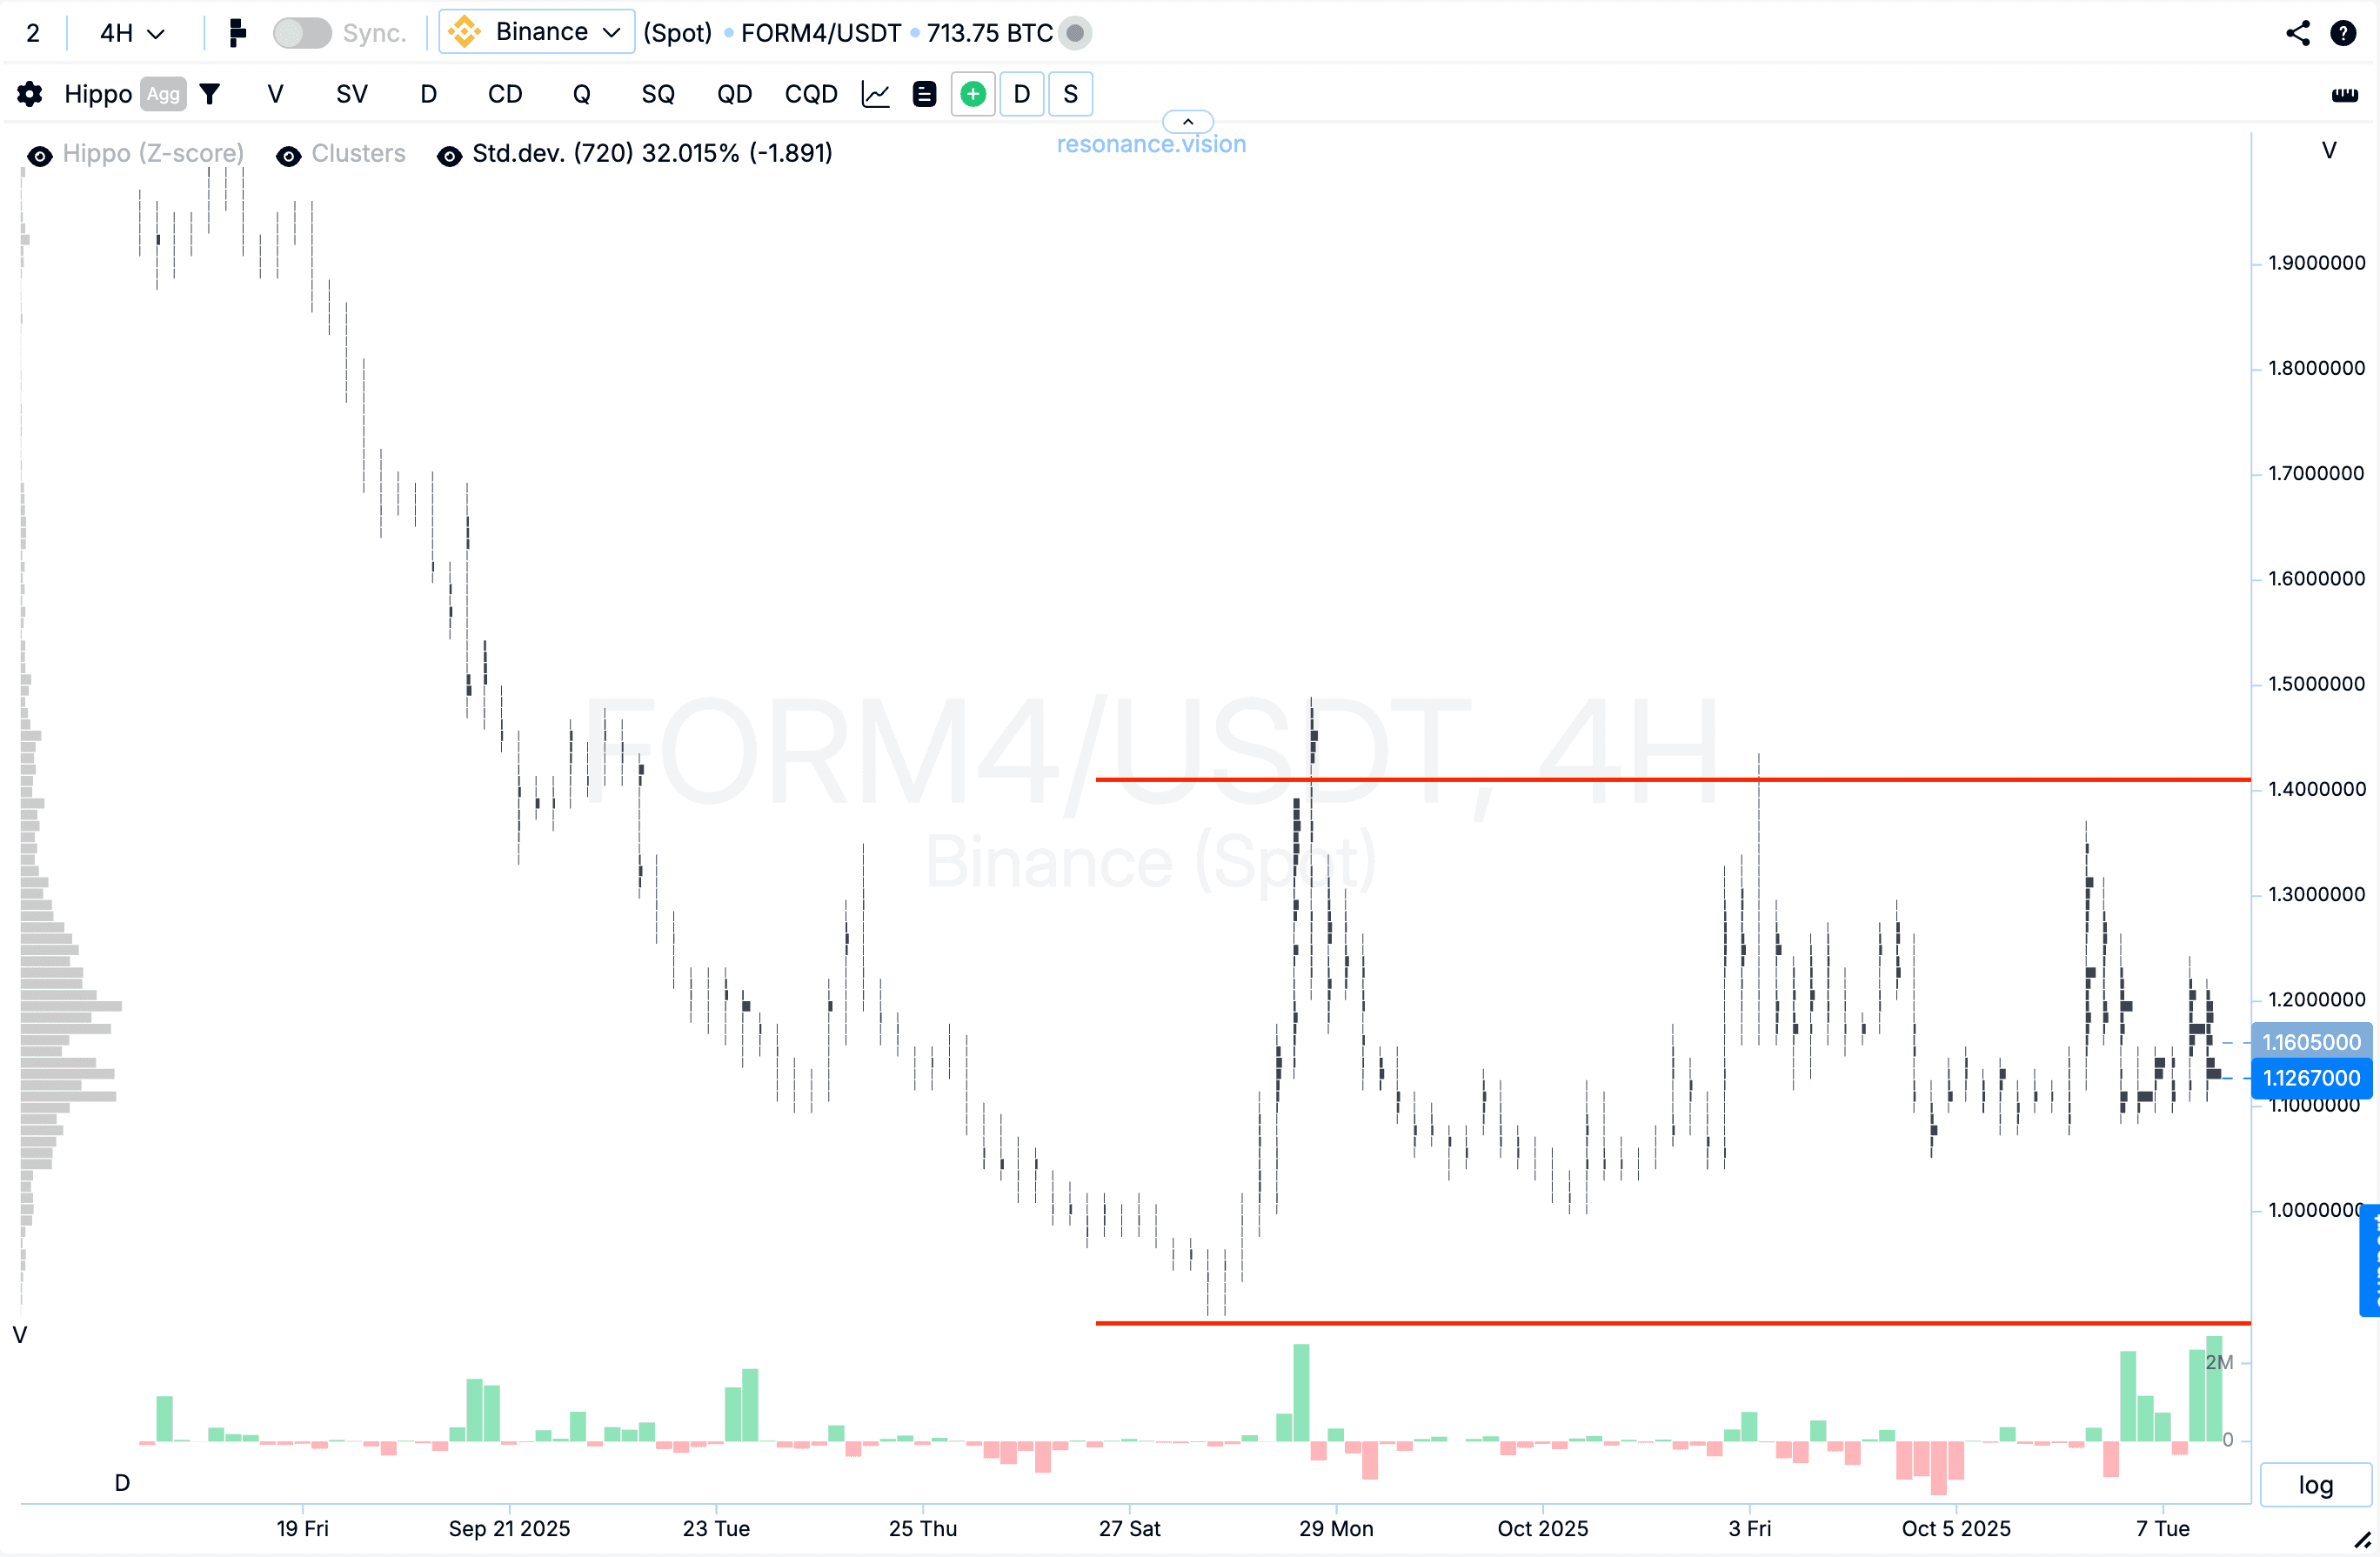
Stage 3: Implementation – Grid Bot Setup
The Grid Bot is an algorithm that places limit buy orders below the current price and limit sell orders above the current price. As the price fluctuates, it constantly buys cheap and sells dear, generating profit from volatility arbitrage.
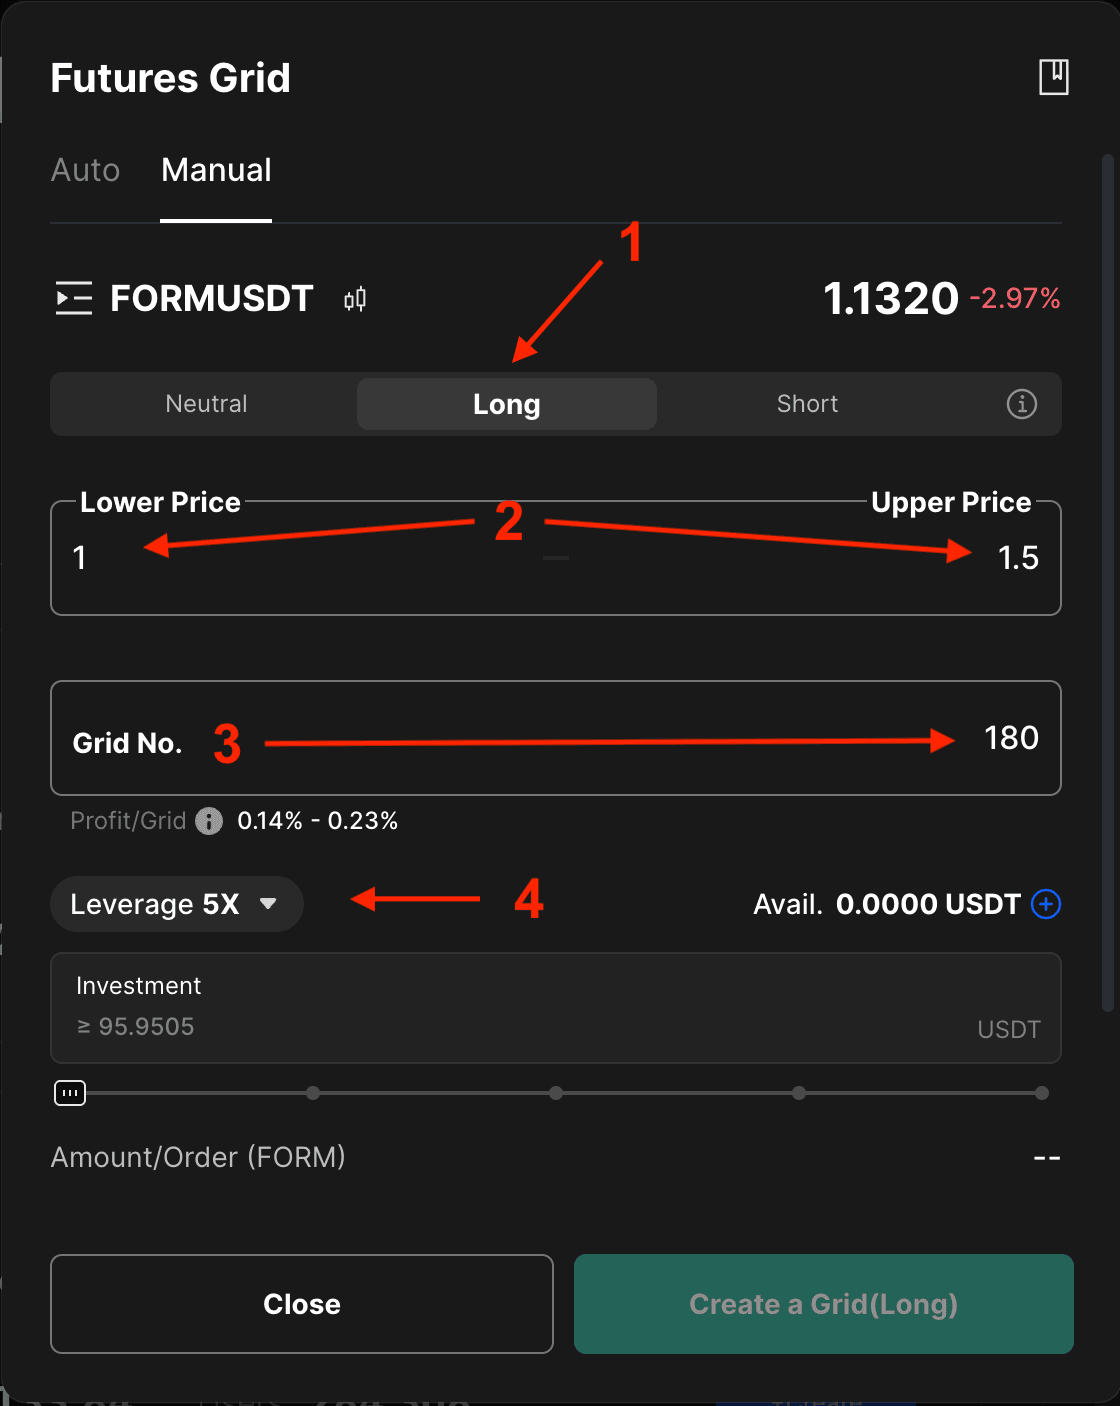
Key Settings (using BingX as an example):
- Bot Type: Long Grid Bot. Since the asset stopped after a drop, we expect that the breakout from consolidation will likely be upward.
- Range: The graphically determined corridor is set (e.g., $1.00 – $1.50).
- Number of Grids (Orders): Determined so that the profit per grid is about 0.2%. This covers the exchange commission (0.1%) and leaves a net profit (0.1%).
- Futures Grid and Leverage: It is recommended to use a Futures Grid Bot with low leverage (e.g., 5x). This allows you to reduce the amount of margin used, increasing the Return on Invested Capital (ROI).
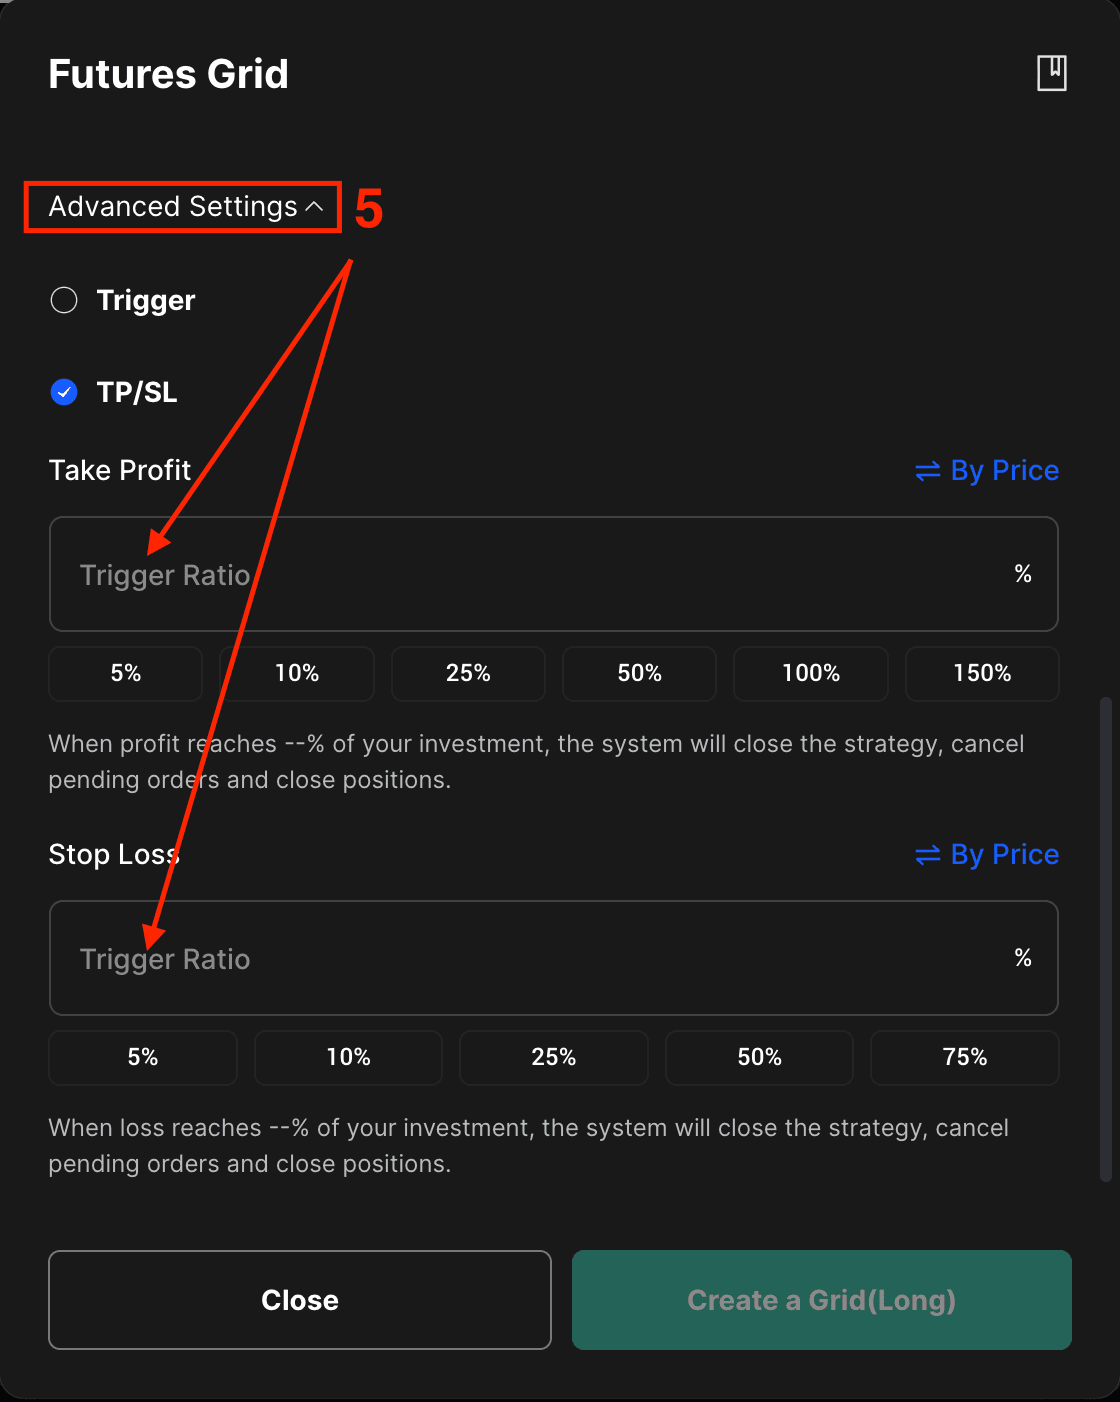
- Risk Management (Stop Loss/Take Profit): This is critically important!
– Stop Loss (SL): Set slightly below the lower range limit ($0.95). A price exit downward means the idea is no longer valid.
– Take Profit (TP): Set slightly above the upper range limit ($1.55). A price exit upward means the start of a trending phase where the Grid Bot becomes less effective.
Stages 4-6: Management, Closure, and Diversification
Management and Closure
Your job is to ensure the price stays within the range. The bot is capable of making thousands of small trades (e.g., 4,738 trades in 38 days), generating hundreds of percent profit on invested capital.
Profit closure happens automatically when the price exits the range and the SL or TP is triggered.
Diversification – The Key to Safety
The most common mistake: investing 100% of capital into a Grid Bot on a single asset.
- Rule: Divide your capital (e.g., $1000) into 10-20 parts. Run the Grid Bot simultaneously on several assets that show similar signs of consolidation (diversify).
- Reason: You don’t know which asset will be most volatile. Diversification allows you to minimize the risk if one asset exits the range via SL, while others continue to generate profit from volatility.
The Grid Bot is a powerful tool that requires analysis and discipline, not just the push of a button.
No need to invent complex schemes or hunt for the “grail”. Use the tools of the Resonance platform.
Sign up on exchanges via our links and get bonuses:
OKX | BingX | KuCoin.
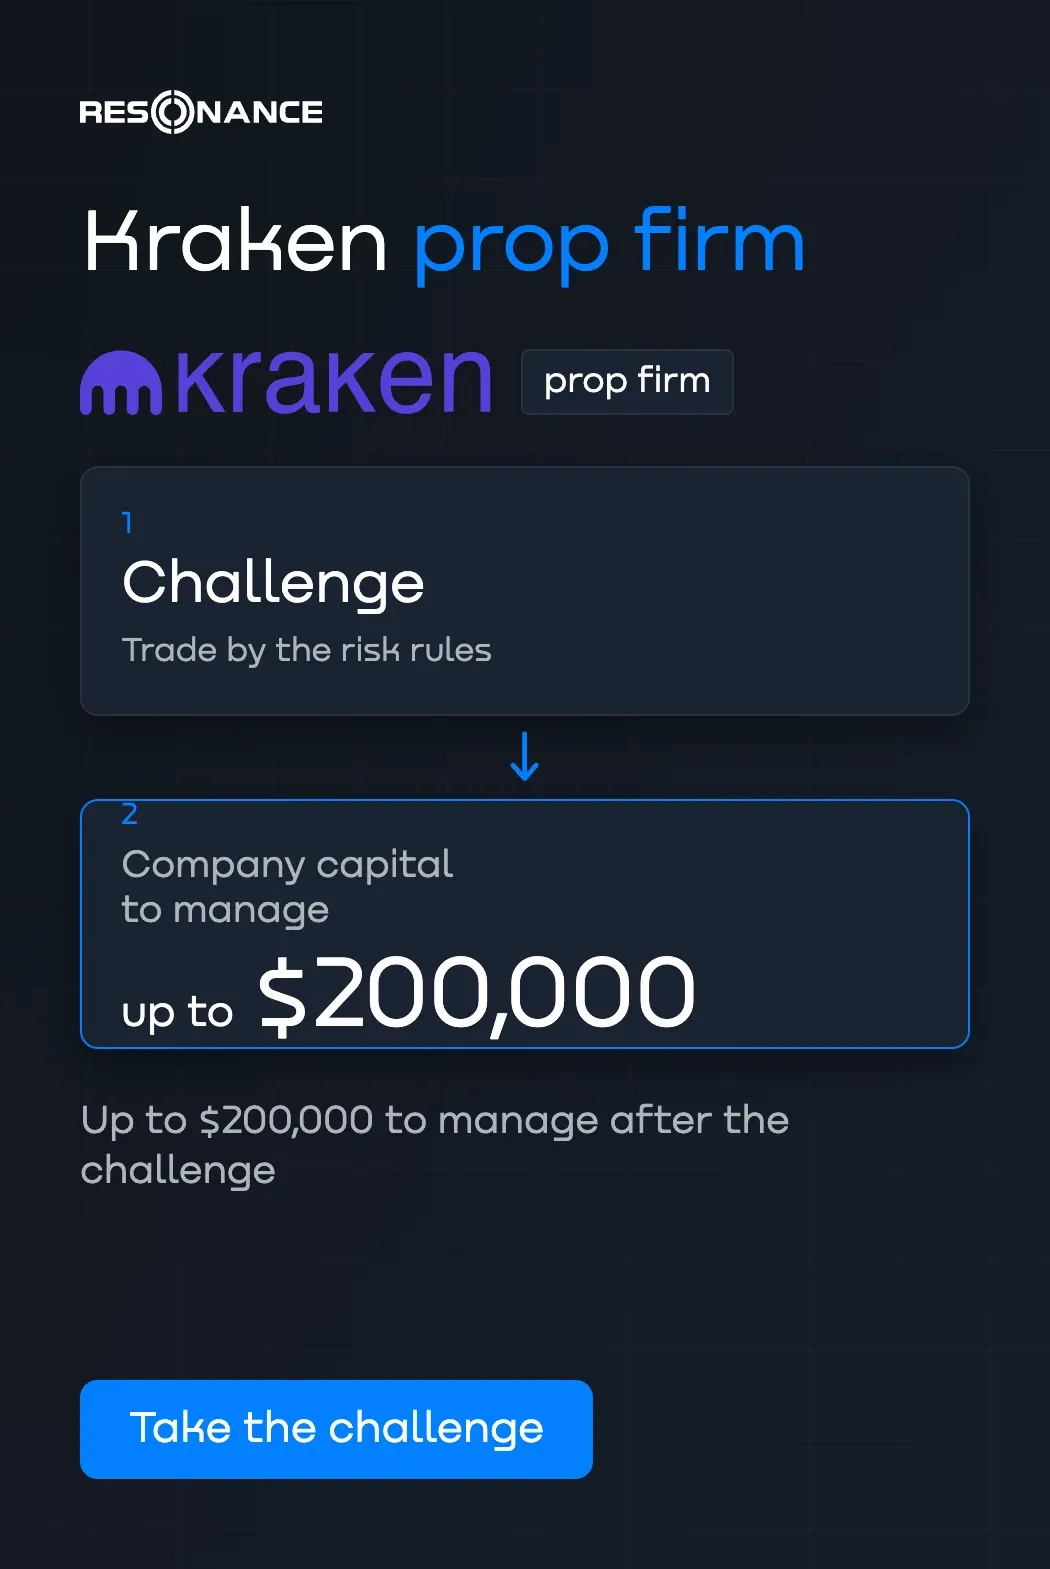
Prop firm — trade with the company’s capital: Kraken.
Promo code TOPBLOG gives you 10% off any Resonance plan.
Recommended articles