The 4 Market Cycle Phases: How to Tell Where the Market Is
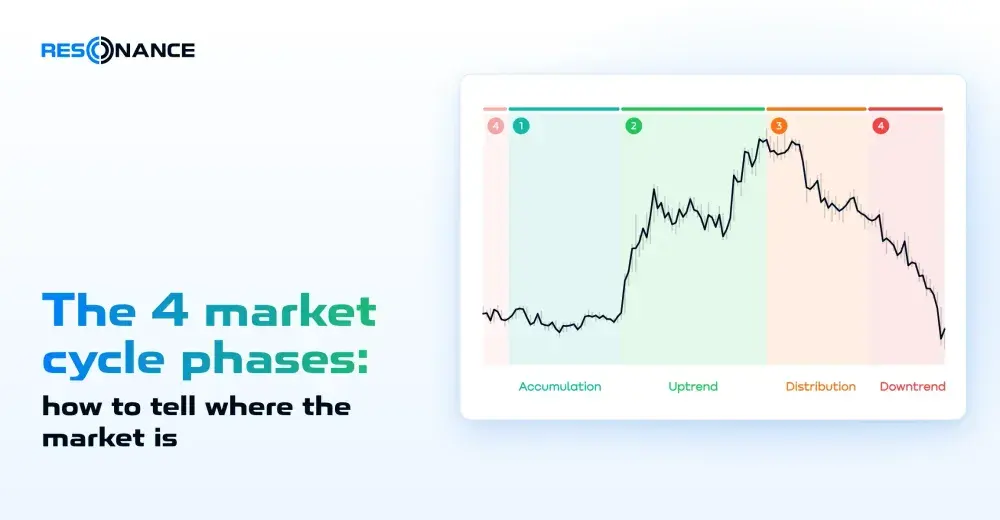
The market moves through four phases: accumulation, uptrend, distribution and downtrend. You tell them apart by two signs: whether buying and selling move the price, and how widely the price swings. A quiet sideways range after a fall is accumulation; a noisy sideways range after a rise is distribution. You can see all of this on the cluster chart of any coin, on any timeframe.
Table of contents
- 01What Are Market Cycle Phases
- 02What the Phases Are Called and Why We Use Different Names
- 03Phase 1: Accumulation — Forming a Deficit
- 04Phase 2: Uptrend — Realizing the Deficit
- 05Phase 3: Distribution — Consolidation
- 06Phase 4: Downtrend — Searching for Balance
- 07How to Identify the Market Phase
- 08How to Spot a Phase Change Early: Pressure Efficiency
- 09Accumulation vs Distribution: How to Tell Them Apart
- 10Wyckoff Market Cycle vs Our Approach
- 11What to Do in Each Phase: Goal First
- 12Common Mistakes
- 13What Manual Phase Labeling Shows
- 14Market Cycle Phases on Different Timeframes
- 15Market Cycle Phases and the Big Bitcoin Cycle
- 16FAQ
- 17Market Examples
- 18What's Next





What Are Market Cycle Phases
People move the price. Some buy, others sell, and the balance between them keeps changing. Sometimes there are more
buyers than goods for sale, and a deficit builds up. Sometimes it’s the other way around, and there is a surplus.
These states replace each other in a circle, and the market goes through four market cycle phases: the accumulation
phase, the uptrend, the distribution phase and the downtrend.
You tell the phases apart by two signs:
- whether trades move the price. Does buying push the price up, or does it stall? Does selling push the price
down, or does it get absorbed? - how widely the price swings — this is volatility, the size of the move per unit of time.
| Phase | What it’s called | What you see on the chart | Volatility |
|---|---|---|---|
| 1 | Accumulation — deficit formation | A sideways range after a fall. Selling no longer makes new lows | Low |
| 2 | Uptrend — deficit realization | Buying pushes the price up, new highs appear | Rising |
| 3 | Distribution — consolidation | A sideways range after a rise. The price is thrown up and down, but buying no longer pushes it higher | High |
| 4 | Downtrend — balance search | Selling easily pushes the price down, new lows appear | Not the main sign: watch how selling goes through |
A phase describes what the market is doing now. It doesn’t predict what comes next. It’s a handy language for
talking about any chart: Bitcoin or a little-known coin, on the hourly timeframe or the daily one.
Why does the quiet end one day? Picture snow on a sloped roof. Each snowflake on its own changes nothing, but one day
one more flake shifts the whole mass. In the same way, the trades of many participants add up to a state we call a
phase.
What the Phases Are Called and Why We Use Different Names
The four phases are not our invention. They are usually called accumulation, uptrend, distribution and downtrend.
Uptrend and downtrend are the common ground, nothing to argue about there. In the Wyckoff method, phases 2 and 4 are
also called markup and markdown.
We name the phases by what actually happens in them:
| Phase | Common name | Wyckoff | Our name | Why |
|---|---|---|---|---|
| 1 | Accumulation | accumulation | Deficit formation | This is where the deficit builds up, and the rise grows out of it |
| 2 | Uptrend | markup | Deficit realization | The rise is the deficit being realized |
| 3 | Distribution | distribution | Consolidation | In economics, this word describes an exchange rate stabilizing after a sharp rise — exactly what happens here |
| 4 | Downtrend | markdown | Balance search | The price falls and searches for balance; the balance it finds becomes the next deficit formation |
Markup and markdown are subjective words. Maybe a hundred years ago market participants really did “mark up”
stocks. Today the market has huge liquidity and many different approaches and strategies, so the word “markup”
explains nothing.
One more word. A short sideways stretch inside a trend, when participants pause for a while, is a pause within
a trend — a sideways stretch inside an uptrend or a downtrend. We don’t call it consolidation: that word belongs to
phase 3.
Phase 1: Accumulation — Forming a Deficit
After a fall, the price moves in a narrow sideways range. Selling no longer makes new lows, and volatility is low.
Why it’s quiet here. A common answer is “the price found the bottom.” But the price doesn’t look for anything: it
is the result of trades. The real reason is that participant activity has dropped. Sellers have already sold out
during the fall, and buyers haven’t yet switched from limit orders to market orders. When participants go quiet,
nobody eats through the order book, and it gets denser. Dense orders are the result of the quiet, not its cause.
Why this is a balance at all. During the fall, large participants have already bought enough, and supply and
demand have evened out. Accumulation is a state of balance, a result of the fall. From the buyer’s side, a deficit is
forming here: there are fewer and fewer goods that people are ready to sell. Large participants don’t leave, though:
when they see that the price has found its balance and signs of a deficit appear, they keep averaging down their
positions to bring their average price as low as possible.
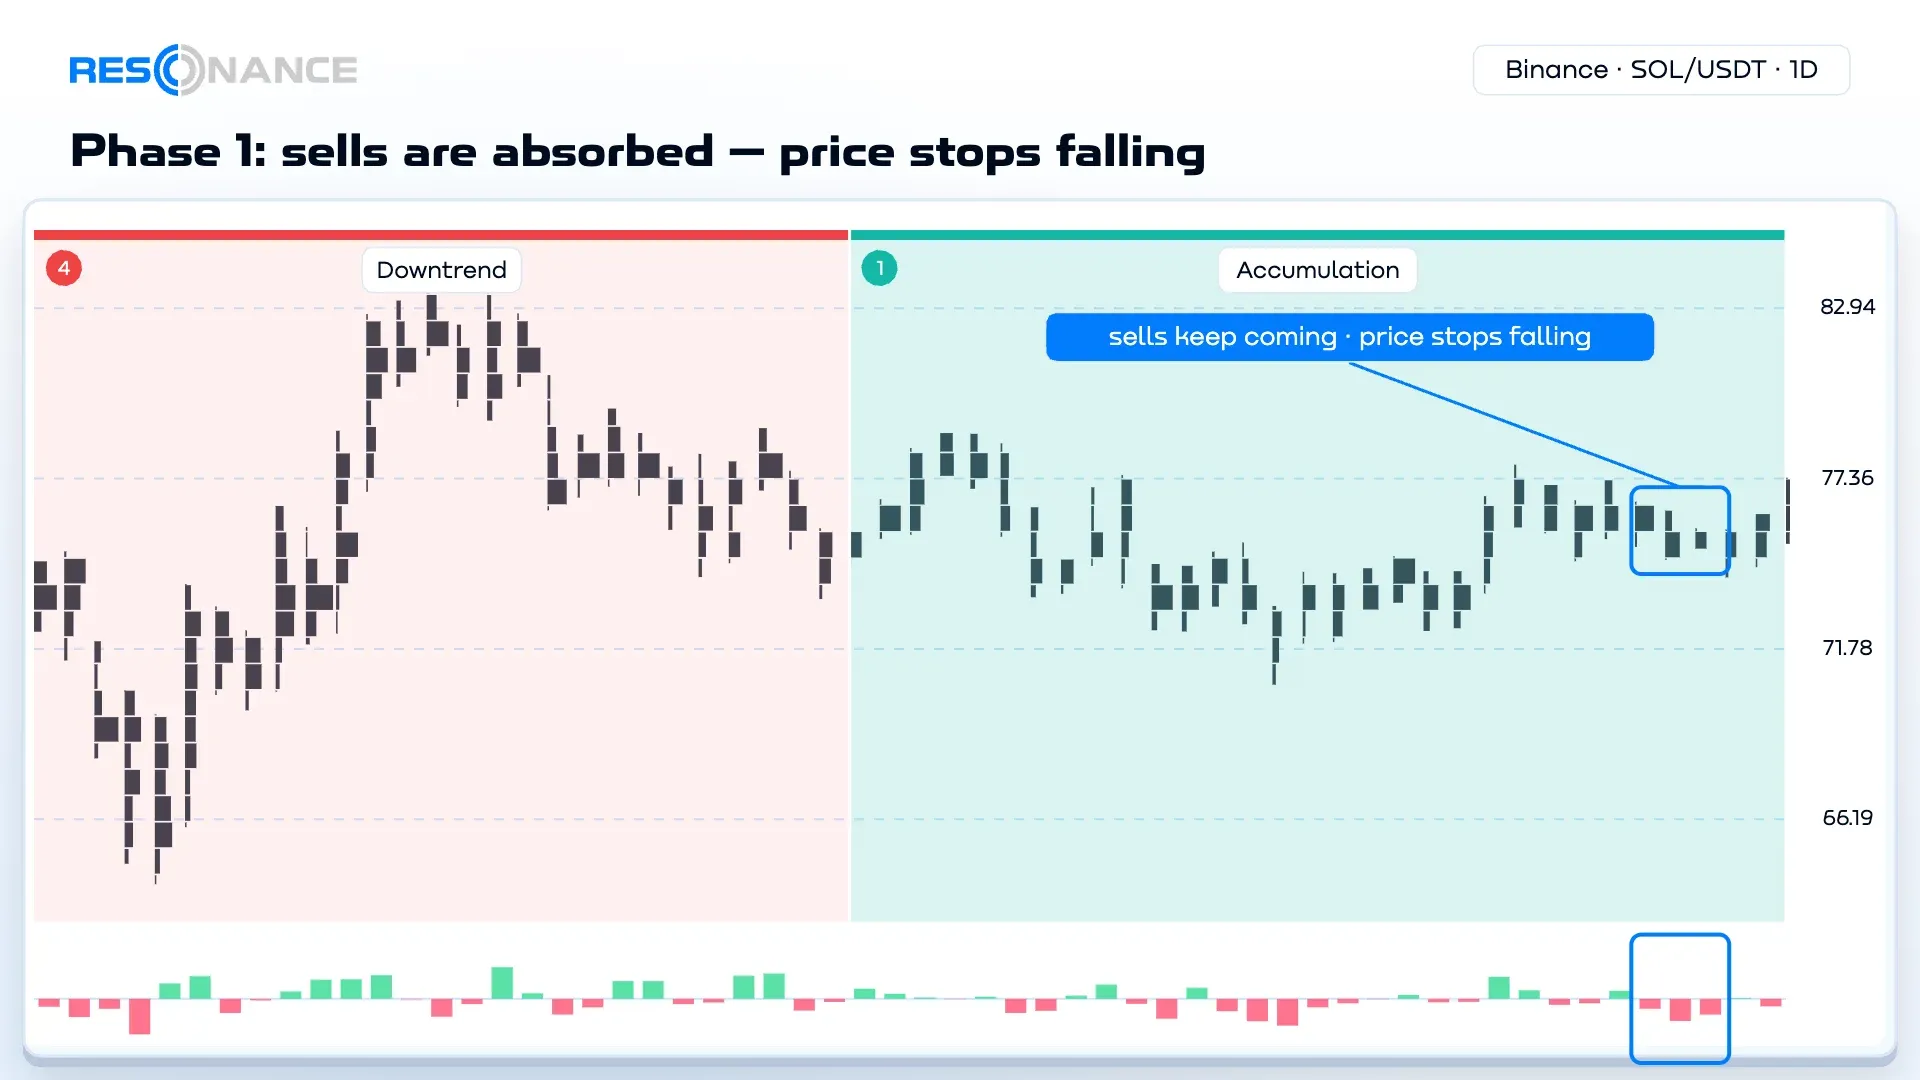
People buy in this phase in different ways — with limit orders and with market orders. The cluster chart (also called
a footprint chart) is mostly quiet: there are fewer trades than in any other phase. But large volumes happen too.
Someone sells big, and limit buyers take it all: the delta is huge, yet the price stays in place. This is one of the
clearest signs of a deficit.
Phase 1 is usually quieter and longer than phase 3: people build up a deficit for longer than a surplus. It can last
for weeks — and never turn into a rise.
Phase 2: Uptrend — Realizing the Deficit
Buying pushes the price up, selling doesn’t push it down, and new highs appear. Under the cluster chart you see
green delta: there are more market buys than market sells.
Along the way there are pauses within the trend — short breaks when some buyers take profit.
How the rise begins. We call the move from phase 1 to phase 2 validation. Its signs:
- Large sells no longer push the price down — buyers absorb them.
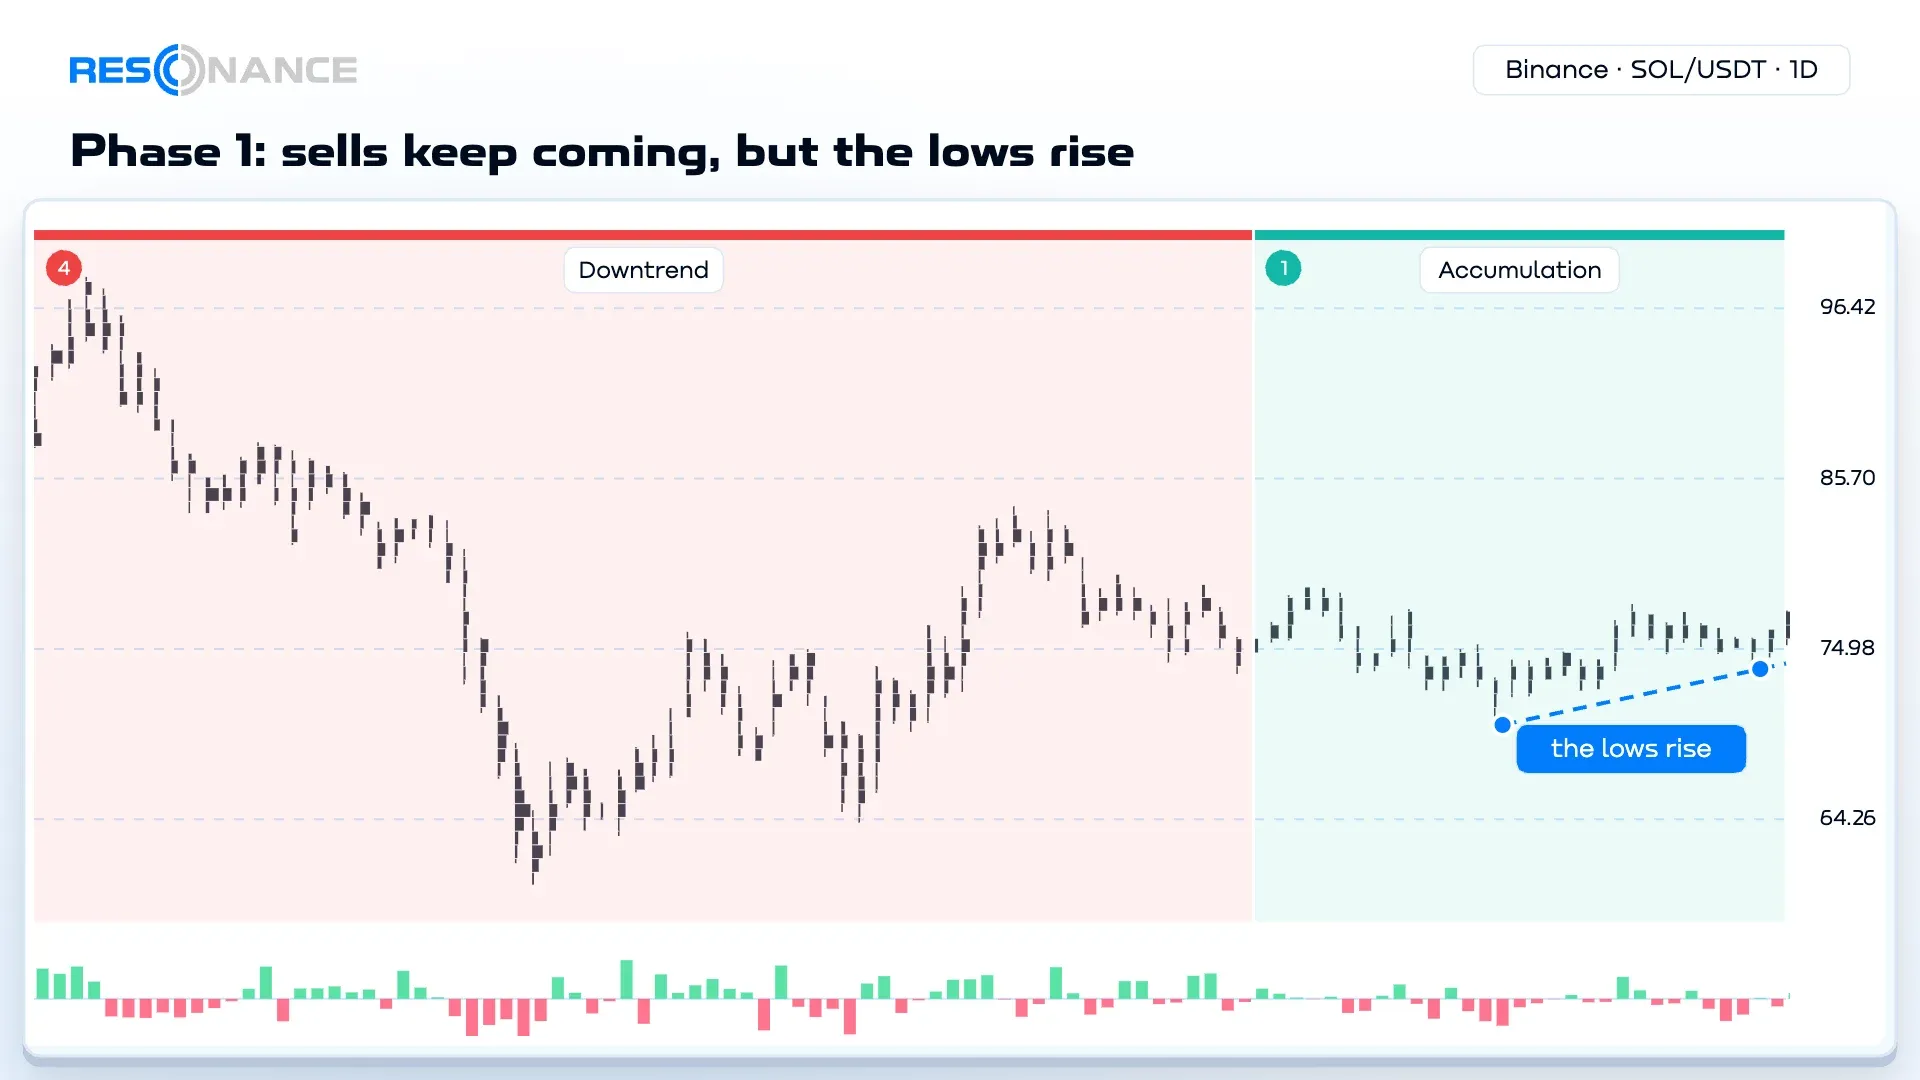
- The low gets higher — a pullback ends above the previous one.
- Small buys push the price to the top of the range and beyond: there is little supply.
Volatility rises during the transition, and that’s normal: quiet is the condition, a rise on buying is the signal.
Who sells during the rise. Large participants. They bought during the fall and sell during the rise — and that’s
how the surplus for the next phase builds up.
Phase 3: Distribution — Consolidation
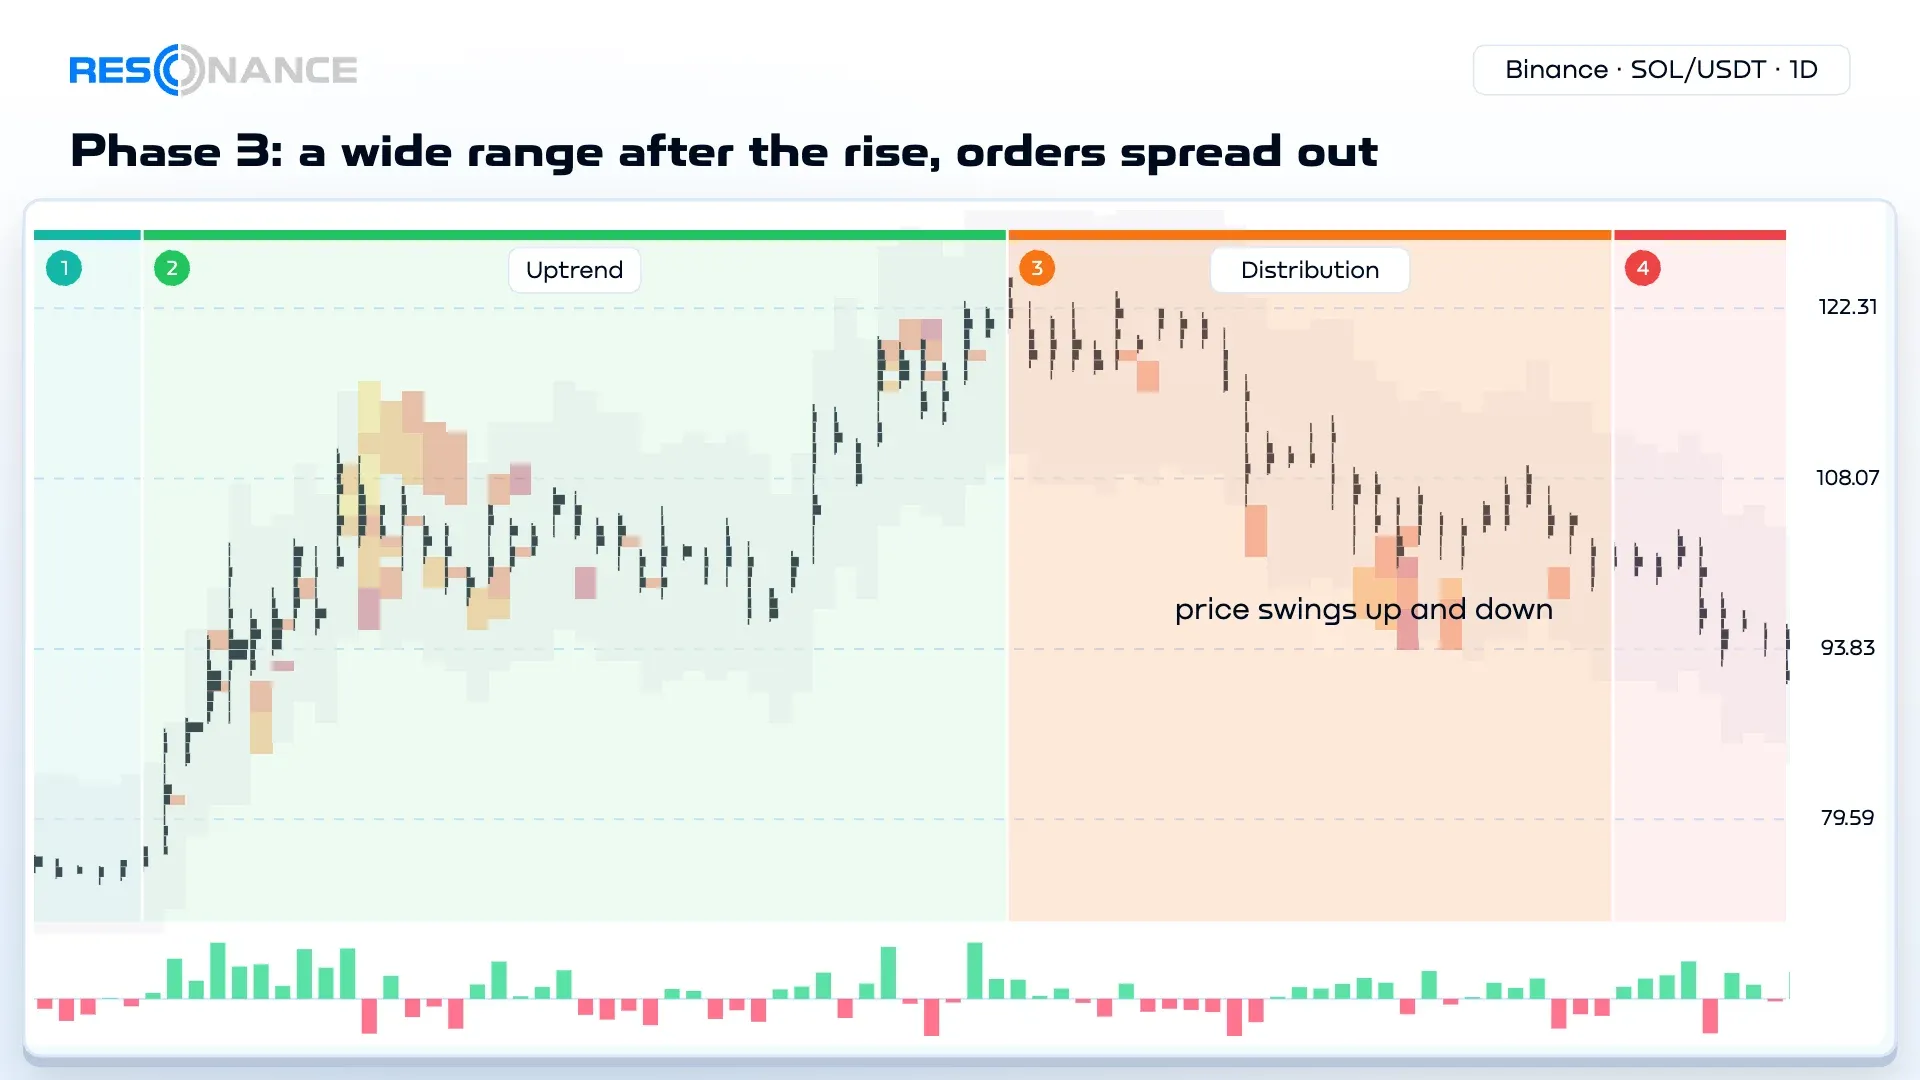
After a strong rise, the price goes sideways. But this isn’t quiet like in phase 1 — it’s hype: the price is
thrown up and down, the swings are wide, and buying no longer pushes it higher.
Activity here is the highest. Participants come with all kinds of money, clear out the order book and place new
orders at random. There are more trades than in any other phase, but they are small. This is a state of balance
again: large participants have already sold during the rise.
This is the most dangerous phase. After the hype, the price more often goes down, but it’s almost impossible to say
for sure in the moment that phase 3 has started (more on this in the section on mistakes). There are hints, though —
see the section on pressure efficiency.
Phase 4: Downtrend — Searching for Balance
Selling easily pushes the price down, and new lows appear. The price is searching for balance.
Who buys during the fall. Large funds that average their positions with other people’s money. Their buys get
absorbed — the price still goes down — but they are the ones who create the deficit. When participants realize the
balance has finally been found, they invest in the deficit for real — and phase 1 begins.
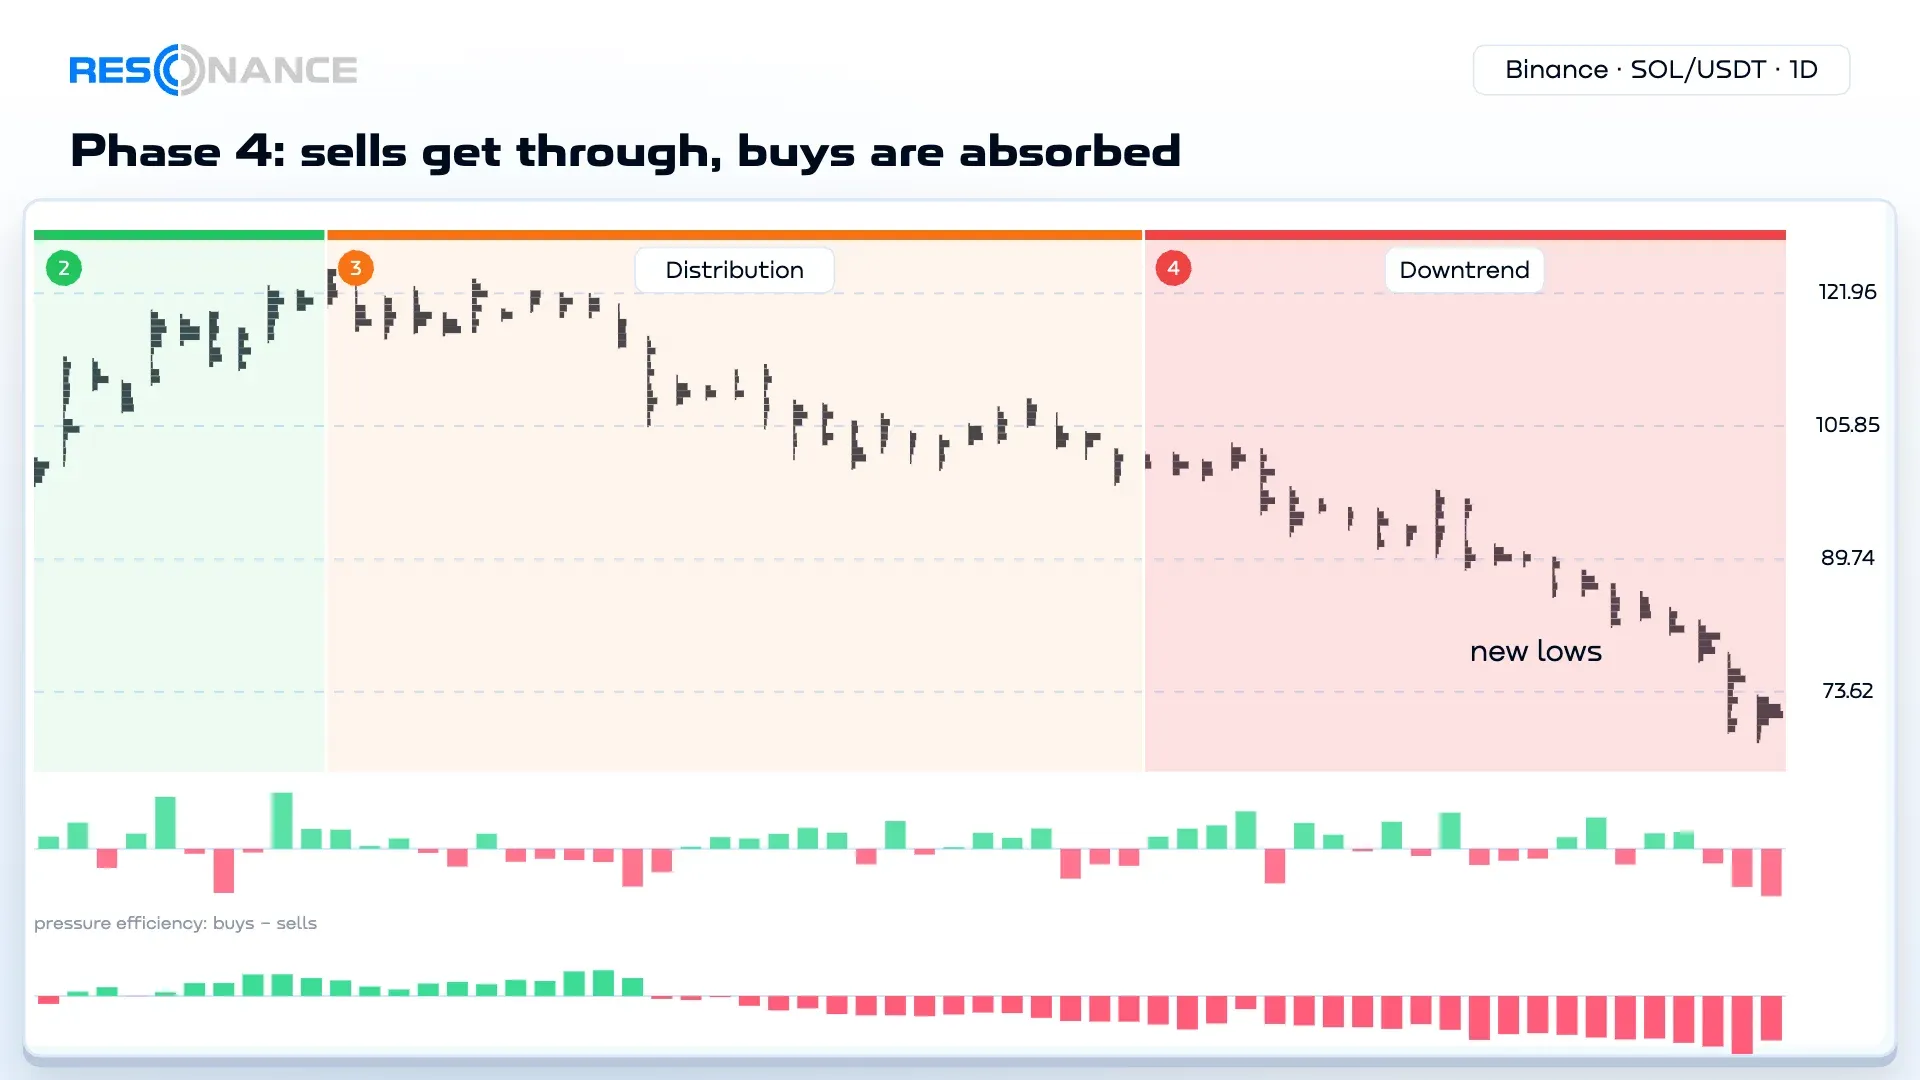
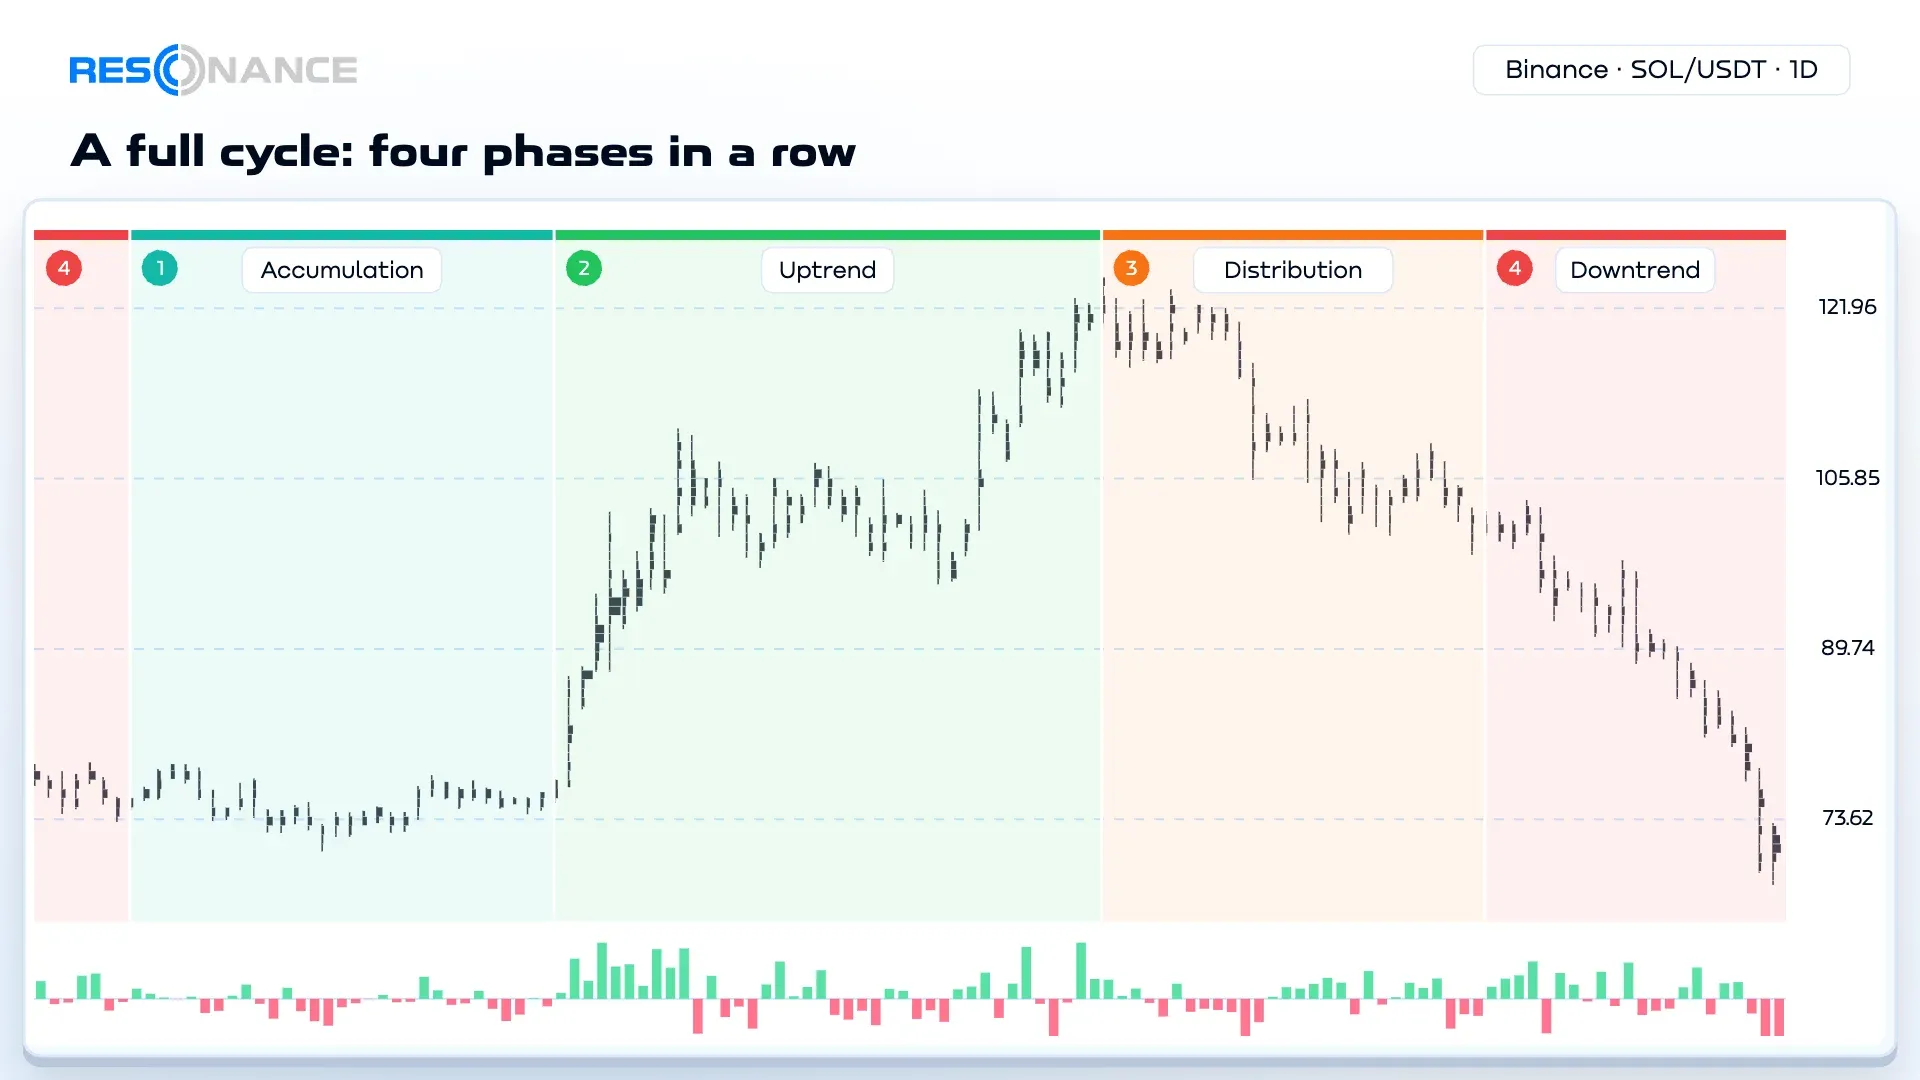
A full example — SOL/USDT on the daily timeframe, as in the pictures above. The price falls from $97 to $62 —
phase 4. Then it moves between $71 and $79, and a pullback now ends at $74 — phase 1 and the start of the transition.
Buying pushes the price up to $122 — phase 2. Wide swings from $100 to $125 — phase 3. The price drops below $100 —
phase 4 again.
How to Identify the Market Phase
- Look at what came before. Go up one timeframe. A sideways range after a fall and a sideways range after a rise
are different phases, and a sideways stretch in the middle of a trend isn’t a phase at all — it’s a pause within
the trend. - Check volatility. Quiet and narrow — most likely phase 1. Wide and noisy — phase 3.
How to read volatility. - Check whether trades move the price. Buying pushes it up — a rise. Selling pushes it down — a fall. Neither —
balance. Delta helps here. - Look at where the large orders are. In phase 1 the order book is dense; in phase 3 the orders are spread out.
The heatmap shows this clearly — see
Guaranteed edge: Resonance heatmap.
Next, label the phases yourself. On the Resonance cluster chart, the left
panel has the “Phase labeling” tool. Mark a zone, choose phase 1–4 and where it turns into the next one. There is one
set of labels per coin, and it’s visible on all charts of the platform. This trains your eye — and you see a coin’s
whole history as a chain of phases.
📸 Screenshot: the “Phase labeling” tool — the button in the left panel and labeled zones on the chart.
How to Spot a Phase Change Early: Pressure Efficiency
Nobody knows in advance what the next phase will be. You can’t say for sure that this sideways range will turn into
distribution and that one into accumulation. But there are signs, and one of the most useful is pressure
efficiency.
Volume on its own says little. You can pour in a huge volume and not move the price: someone on the other side will
calmly take it all. Or you can move the price noticeably with a small volume if almost nobody stands in the way.
Pressure efficiency shows exactly this: how far the price actually moves per unit of volume — separately for
buying and for selling.
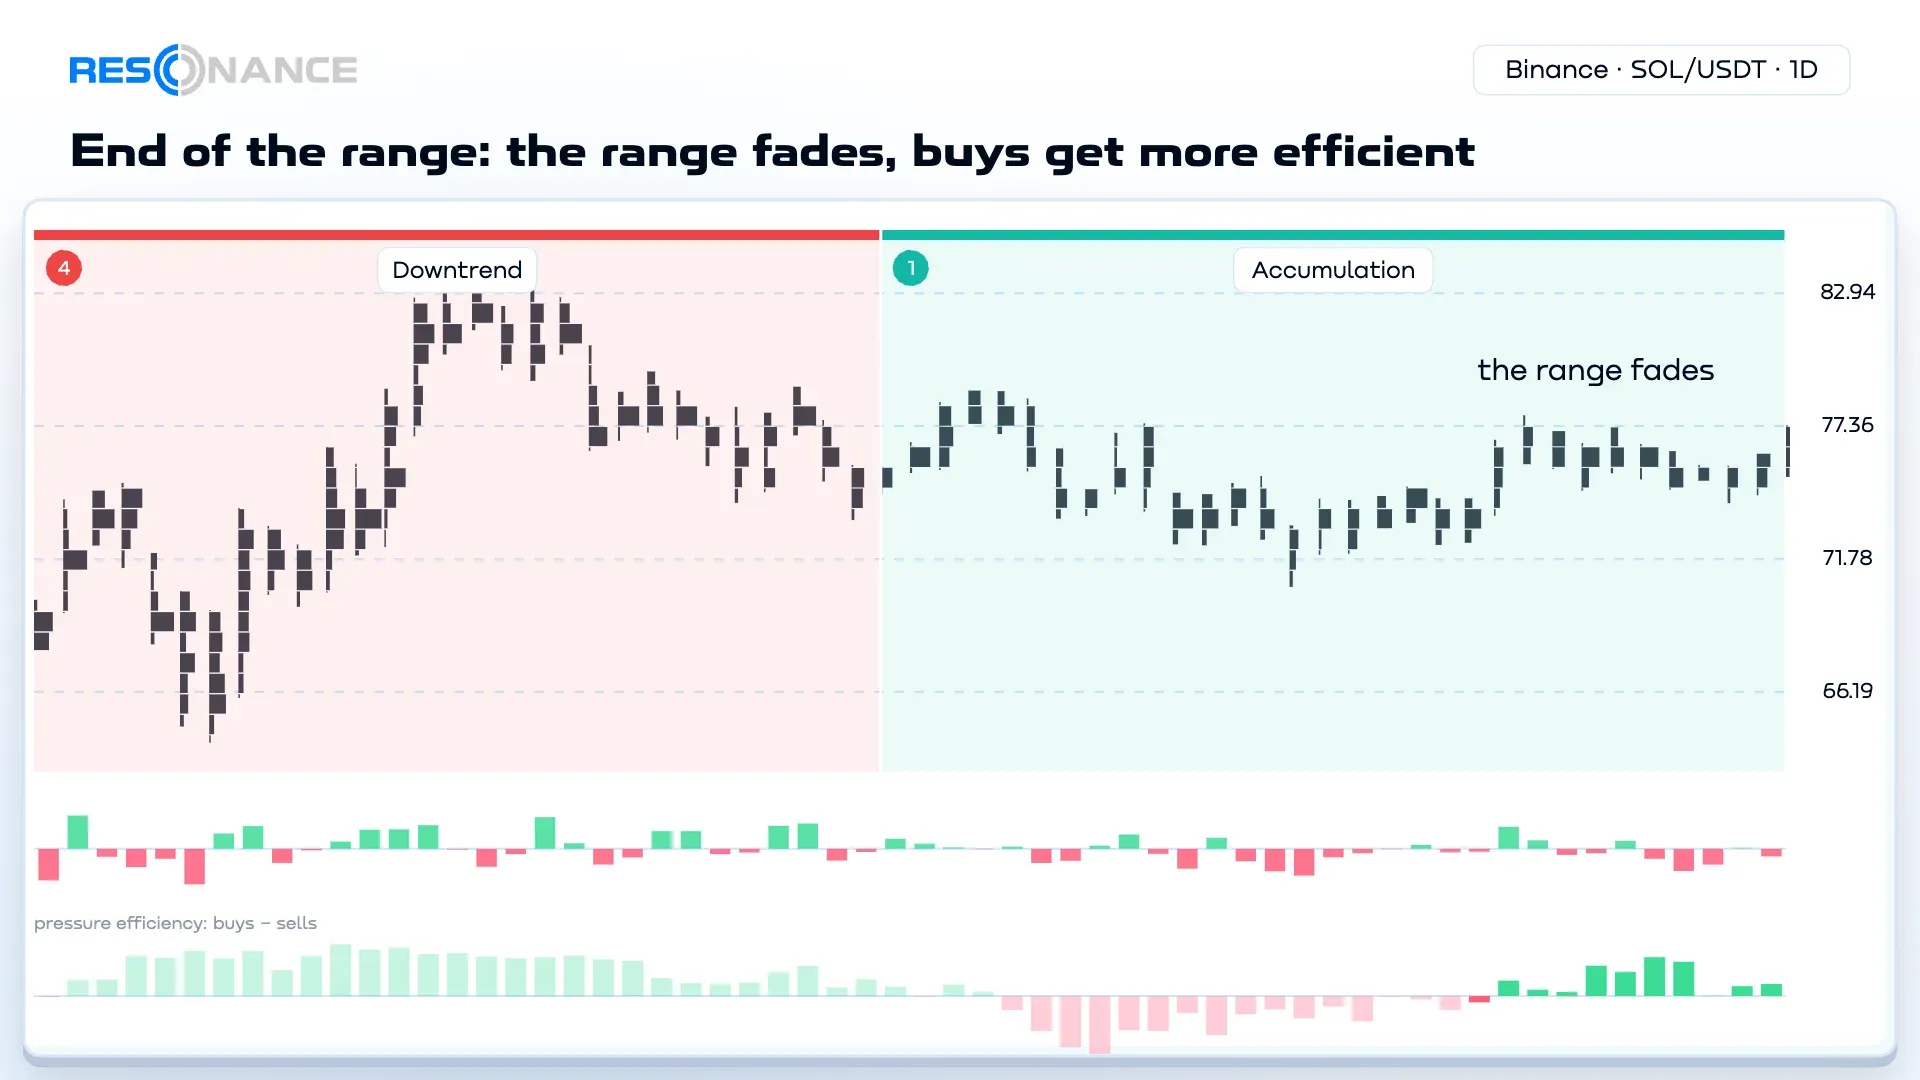
A sign of a coming fall. Toward the end of a sideways range, volatility fades and selling becomes more efficient:
selling pressure grows, and each sell moves the price further. This is a sign the market may start to fall.
A sign of a coming rise. A pause within a downtrend, volatility fades. Buying efficiency grows, selling
efficiency drops, and the price slowly creeps up. This sign can turn into validation — the start of a rise — and
become a reason to open a position.
These are signs, not a guarantee: they show which way the balance is leaning, not what will happen for sure.
On the cluster chart, pressure efficiency is a strip under the chart: you turn it
on in Trade State in the left panel (the “Pressure efficiency (Δ)” switch). Above zero, buyers are more efficient; below
zero, sellers are.
The Resonance short-term strategy is built on this idea:
a coin goes quiet, and a trade is opened when the price moves out of the quiet in the direction where the pressure is
more efficient.
Accumulation vs Distribution: How to Tell Them Apart
Both phases are sideways ranges, and at first glance they look alike. Four questions help tell them apart:
| Accumulation (phase 1) | Distribution (phase 3) | |
|---|---|---|
| Comes after | A fall | A rise |
| Volatility | Low, narrow range | High, the price is thrown around |
| Trades | Few trades | The most trades, and they are small |
| Order book | Dense | Orders are spread out |
Wyckoff Market Cycle vs Our Approach
Wyckoff has the same four phases. The difference is in who buys and sells, and when.
In the Wyckoff method, a large player builds a position during accumulation and dumps it during distribution. We see
it differently:
| Wyckoff method | Our approach | |
|---|---|---|
| Where large participants buy | During accumulation | During the fall. These are funds that average their positions with other people’s money. Their buying creates the deficit |
| Where large participants sell | During distribution | During the rise. Their selling creates the surplus |
| What accumulation is | A sideways range where a large player builds a position | A result: a state of balance, because large participants have already bought enough on the way down. When they see that the price has found its balance and signs of a deficit appear, they keep averaging down their positions — to bring their average price as low as possible |
| What distribution is | A sideways range where a large player dumps a position | Also a balance — after a rise during which large participants have already sold |
| How many large players | “The large player”, singular | There are many, and each acts on their own logic |
Wyckoff is close to the truth: the phases are the same. But he’s wrong about the main thing. Large participants work
in trends, not in sideways ranges. Accumulation and distribution are not where they trade, but the result of their
trading. And Wyckoff has no pauses within a trend at all — yet they are a common cause of mistakes, more on them
below.
What to Do in Each Phase: Goal First
Almost every article about phases says the same thing: buy in one phase, sell in another. That’s no accident.
Exchanges benefit when many people speculate with large volumes: that means commissions. People like a large
position — with leverage or without — because it means a large return, and ads promise a yacht, an island and
cocktails. That’s why almost all the attention online goes to directional trading with large volumes.
We suggest starting with something else.
- Goal. Why you came to the market and what problem you are solving.
- Approach. How much time and capital you have, and how much risk you are ready to take.
- Strategy. There are many:
- directional — a long position (going long) on a rise or a short position on a fall;
- investment — for example, DCA (dollar-cost averaging): buying in parts as the price drops, which averages
your cost; - a grid bot — a grid of orders for a sideways range: you don’t
trade in one direction, you earn on swings within the range.
Each strategy has its own timeframe: on a higher one, a position lives much longer than on a lower one.
So in any phase you can do anything — both buy and sell. Your goal, approach and risk decide, not the phase by
itself. For a conservative approach — something between speculation and investing, on a higher timeframe — the
options look like this:
| Phase | What you can do |
|---|---|
| 1 — accumulation | Run a long grid bot within the sideways range |
| 2 — uptrend | A long position: hold it while buying keeps moving the price |
| 3 — distribution | Take profit. Don’t open a long-held short position here: the risk is high compared to the possible profit |
| 4 — downtrend | DCA — buy in parts in a falling market. Or a long grid bot during a pause within the downtrend, but with a tight stop: the fall may continue, and it’s better to exit early than to keep piling up losses |
In short, and conservatively: if it’s rising, buy; if it’s falling, sell. Everything else depends on your goals,
plan and approach. How to build your own — in the articles
How to create your own trading strategy
and
Strategy is important, but risks are more important.
Common Mistakes
- A false phase 3. A pause within a rise is mistaken for distribution, someone opens a short position, and the
rise continues. The move from one phase to the next is most often visible only in hindsight. - A pause in the middle of a trend is not a new phase. “It fell, stood still, fell some more” is one phase 4,
not accumulation. - Guessing the phase without seeing the previous one. What came before a sideways range is what gives it its
name. Can’t see the start? Go up one timeframe. - “It’s already gone up, so it’ll go down soon.” Expensive compared to what? As long as buying pushes the price
up, the rise continues, and a short position goes against the side that is stronger right now.
What Manual Phase Labeling Shows
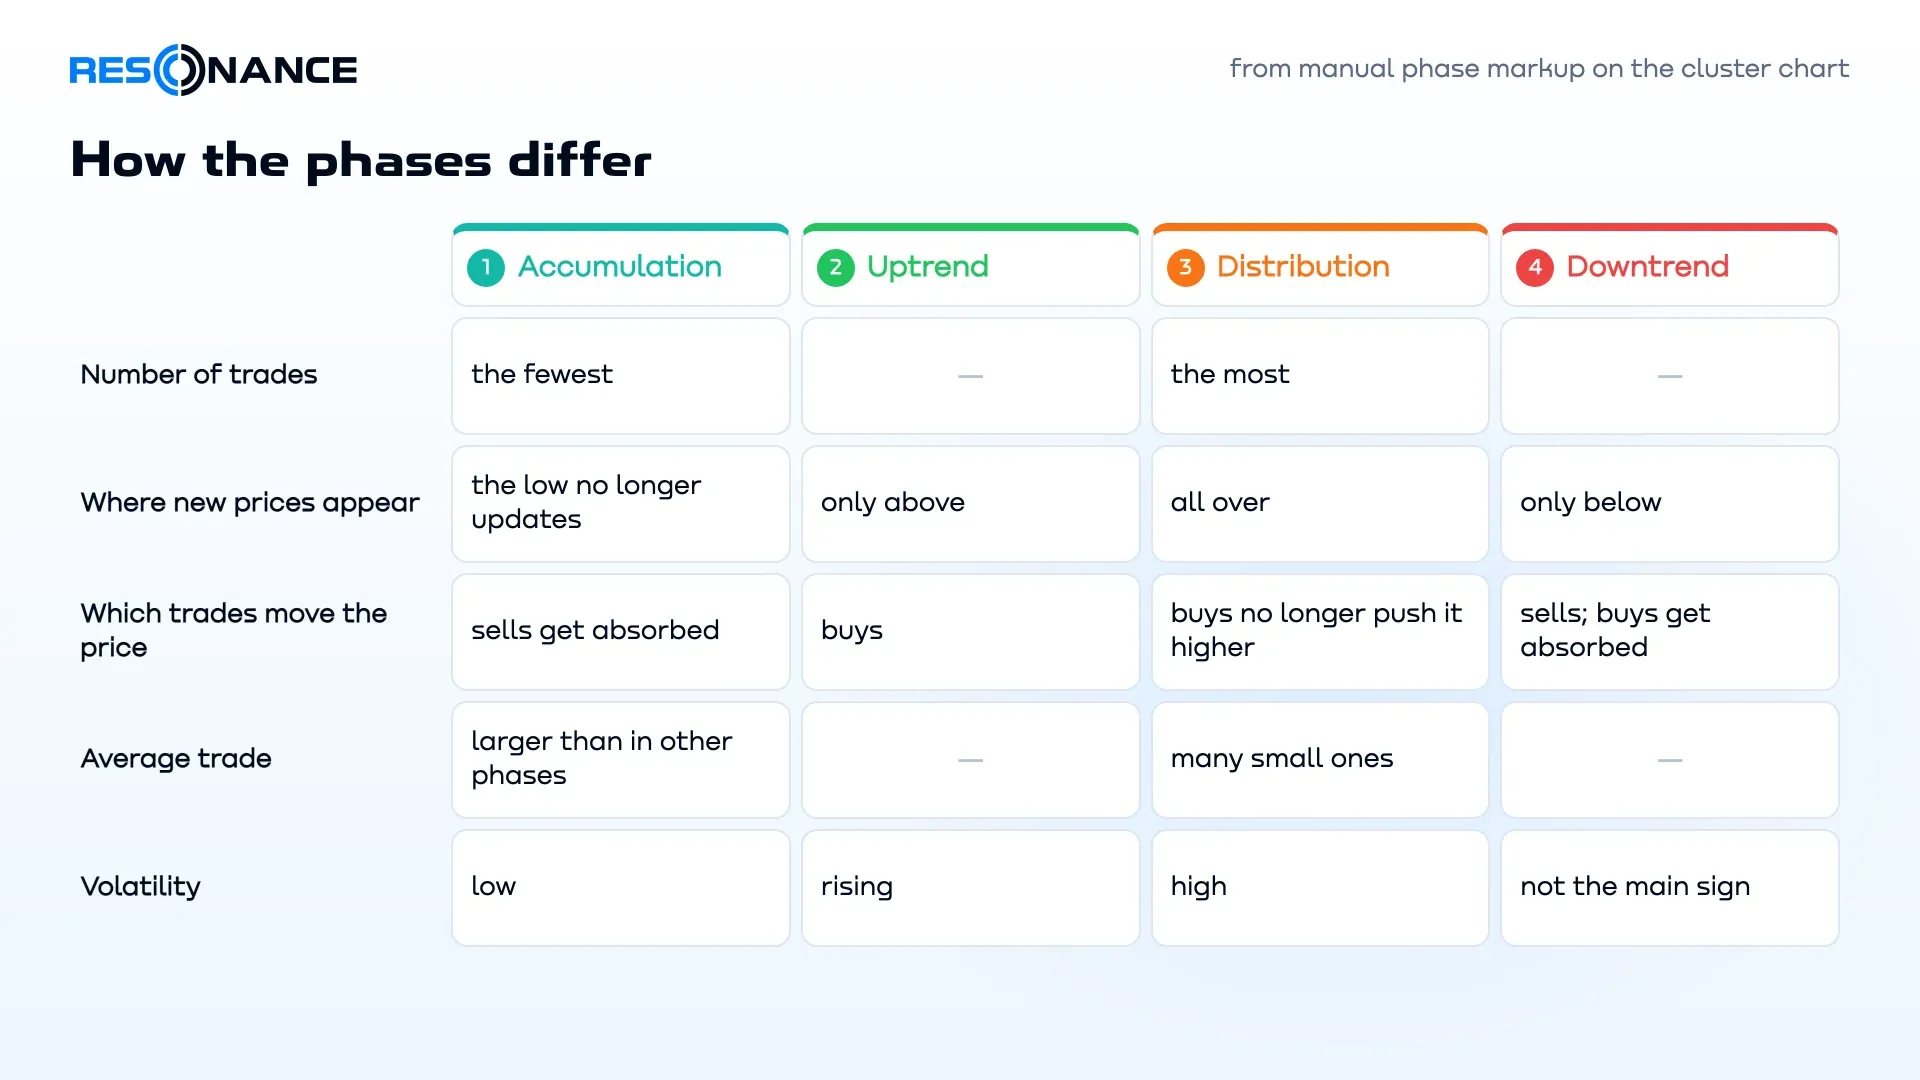
We label phases by hand — the way a trader sees them — and compare how the phases differ in numbers. Here is what
consistently repeats in our manual labeling data:
- Distribution has more trades than any other phase, and accumulation has the fewest.
- In a rise, new prices appear only at the top; in a fall, only at the bottom.
- In a rise, buying goes through — it moves the price. In a fall, selling goes through, and buying gets
absorbed. - In most cases, the average trade in accumulation is larger than in other phases. This doesn’t mean a large
player is buying there. Accumulation has few participants and little activity, so there are few trades and the
average one is larger. Distribution, on the other hand, draws everyone with any amount of money, plus arbitrage with
futures and other exchanges — a mass of small trades that simply even out the price. - Not every pause after a fall is accumulation. About 47% of pauses after a fall turned into accumulation, and
the other 53% were just a breather before the fall continued. That’s why what happens next names the phase: a rise
on buying after the pause means accumulation, new lows mean a pause within the downtrend.
Market Cycle Phases on Different Timeframes
The logic of the phases is the same on any timeframe — a minute, half an hour, an hour, a day. But one coin has
different phases on different timeframes. If the daily chart is in phase 3 right now, then on m5 you can find phase 1,
phase 2 and phase 3 inside it. So first decide which phase your strategy works with: the global one or the local one.
The coin’s liquidity decides which timeframe to use. If there is enough liquidity — the bars are dense, there are
no gaps between them, and the price doesn’t zigzag but forms smooth moves — you can see the phase even on the
one-minute timeframe. If liquidity is patchy, go up a timeframe until the picture smooths out. On h4 and the daily
chart, liquidity comes together, so the phase is easy to see on almost any coin there. And on some coins liquidity
behaves so oddly that you can only make out the phase on the very highest timeframes.
Market Cycle Phases and the Big Bitcoin Cycle
Phases are often explained through Bitcoin’s multi-year cycle. It’s the same logic, just on the largest scale: years
of falling, accumulation, rising and distribution. But every coin has phases, on any timeframe — you don’t need to
wait four years to see a cycle.
FAQ
No. Sometimes the price turns up from the bottom without a long accumulation. Sometimes a rise turns straight into a
fall, or accumulation turns into distribution and back.
You can’t know in advance, and a phase has no minimum length. Accumulation can last for weeks and never turn into a
rise.
There was no long sideways range, but there was a deficit — it was created on the way down. Large participants
bought during the fall, and sellers sold out over that time, so almost none are left. If strong demand suddenly
appears at the very bottom and there are almost no sell orders above, demand outweighs supply — and the price shoots
up. The uptrend starts right away, simply because there is almost nobody left to sell.
Supply and demand have two outcomes: deficit and surplus, a rise and a fall. Between them is equilibrium, a sideways
range. But a sideways range after a fall and one after a rise are different: at the bottom it’s quiet and a deficit
builds up slowly; at the top there’s hype. That’s why there are four states.
Distribution comes after a rise and is noisy; accumulation comes after a fall and is quiet. See the table above for
details.
The coin’s liquidity decides. If liquidity allows, even the one-minute chart works. If the bars are ragged, with gaps
between them, and the price zigzags — go up a timeframe. On h4 and the daily chart, the phase is easy to see on
almost every coin.
Goal first, then approach and strategy. In any phase you can both buy and sell. Conservatively: if it’s rising, buy;
if it’s falling, sell.
Market Examples
Breakdowns of real charts are collected here — a new one every Saturday.
What’s Next
- Label the phases on any coin with the “Phase labeling” tool on the
cluster chart. - Take the free mini course — the “Market phases” level.
- Practice identifying the phase on historical data in the simulator.
- Read How to determine a deficit or surplus.
No need to invent complex schemes or hunt for the “grail”. Use the tools of the Resonance platform.
Sign up on exchanges via our links and get bonuses:
OKX | BingX | KuCoin.
Prop firm — trade with the company’s capital: Kraken.
Promo code TOPBLOG gives you 10% off any Resonance plan.
Recommended articles