Crypto Market Simulator: Why Historical Chart Analysis Can't Replace Trading Decision Practice
Discover how Resonance Trading Simulator helps you practice trading decisions using historical market data, analyze mistakes, and improve your skills without risking real capital.
Table of contents
- 01What Is Historical Crypto Market Replay?
- 02Why Does a Historical Chart Look Easier?
- 03When Knowing the Outcome Changes How We See the Past
- 04Why Do You Need a Simulator for This?
- 05Why Not Just Scroll Back on a Chart?
- 06How Does Bar-by-Bar Market Replay Work?
- 07Why Do Random Historical Scenarios Matter?
- 08What Does Historical Replay Actually Train?
- 09Historical Replay and Practice on the Live Market Are Different
- 10Historical Replay Is Not Automated Backtesting
- 11How Historical Replay Works in Resonance Trading Simulator
- 12What Comes After the Practice?
- 13Frequently Asked Questions
- 14What Is Historical Crypto Market Replay?
- 15Why Use a Simulator Instead of Simply Reviewing Old Charts?
- 16Can I Choose the Coin for a Random Simulation in Resonance?
- 17Why Are the Coin Name, Date and Price Hidden?
- 18How Is Historical Replay Different From Automated Backtesting?
- 19Does a Good Result in the Simulator Prove That a Strategy Is Profitable?

On a completed historical chart, many trading decisions look simple — even obvious.
You can already see what happened to price. You can see how the market balance changed, whether a deficit or surplus persisted, and how buyers and sellers behaved. Most importantly, you already know how the situation ended.
When you have to make an actual trading decision, you do not have that advantage.
All you have is the market as it looks right now — and one question:
What do I do now?
Historical market replay brings that uncertainty back. Future price action is hidden, new data appears gradually, and you have to make a decision before you know the outcome.
That is why a simulator built on historical data is not simply another way to look at past charts. Its purpose is to turn completed market history into a sequence of decisions made without knowing what happens next.
What Is Historical Crypto Market Replay?
Historical market replay lets you practise on real past market data while keeping future price action hidden.
You see the current market situation, analyse it and make a decision. Only then is new data revealed.
After that, you have to assess the market again.
The process is simple:
current market state → analysis → decision → new data → reassessment
The market move itself happened in the past.
But you do not know what comes next.
That is what separates historical replay from simply reviewing old charts.
Why Does a Historical Chart Look Easier?
Consider an example.
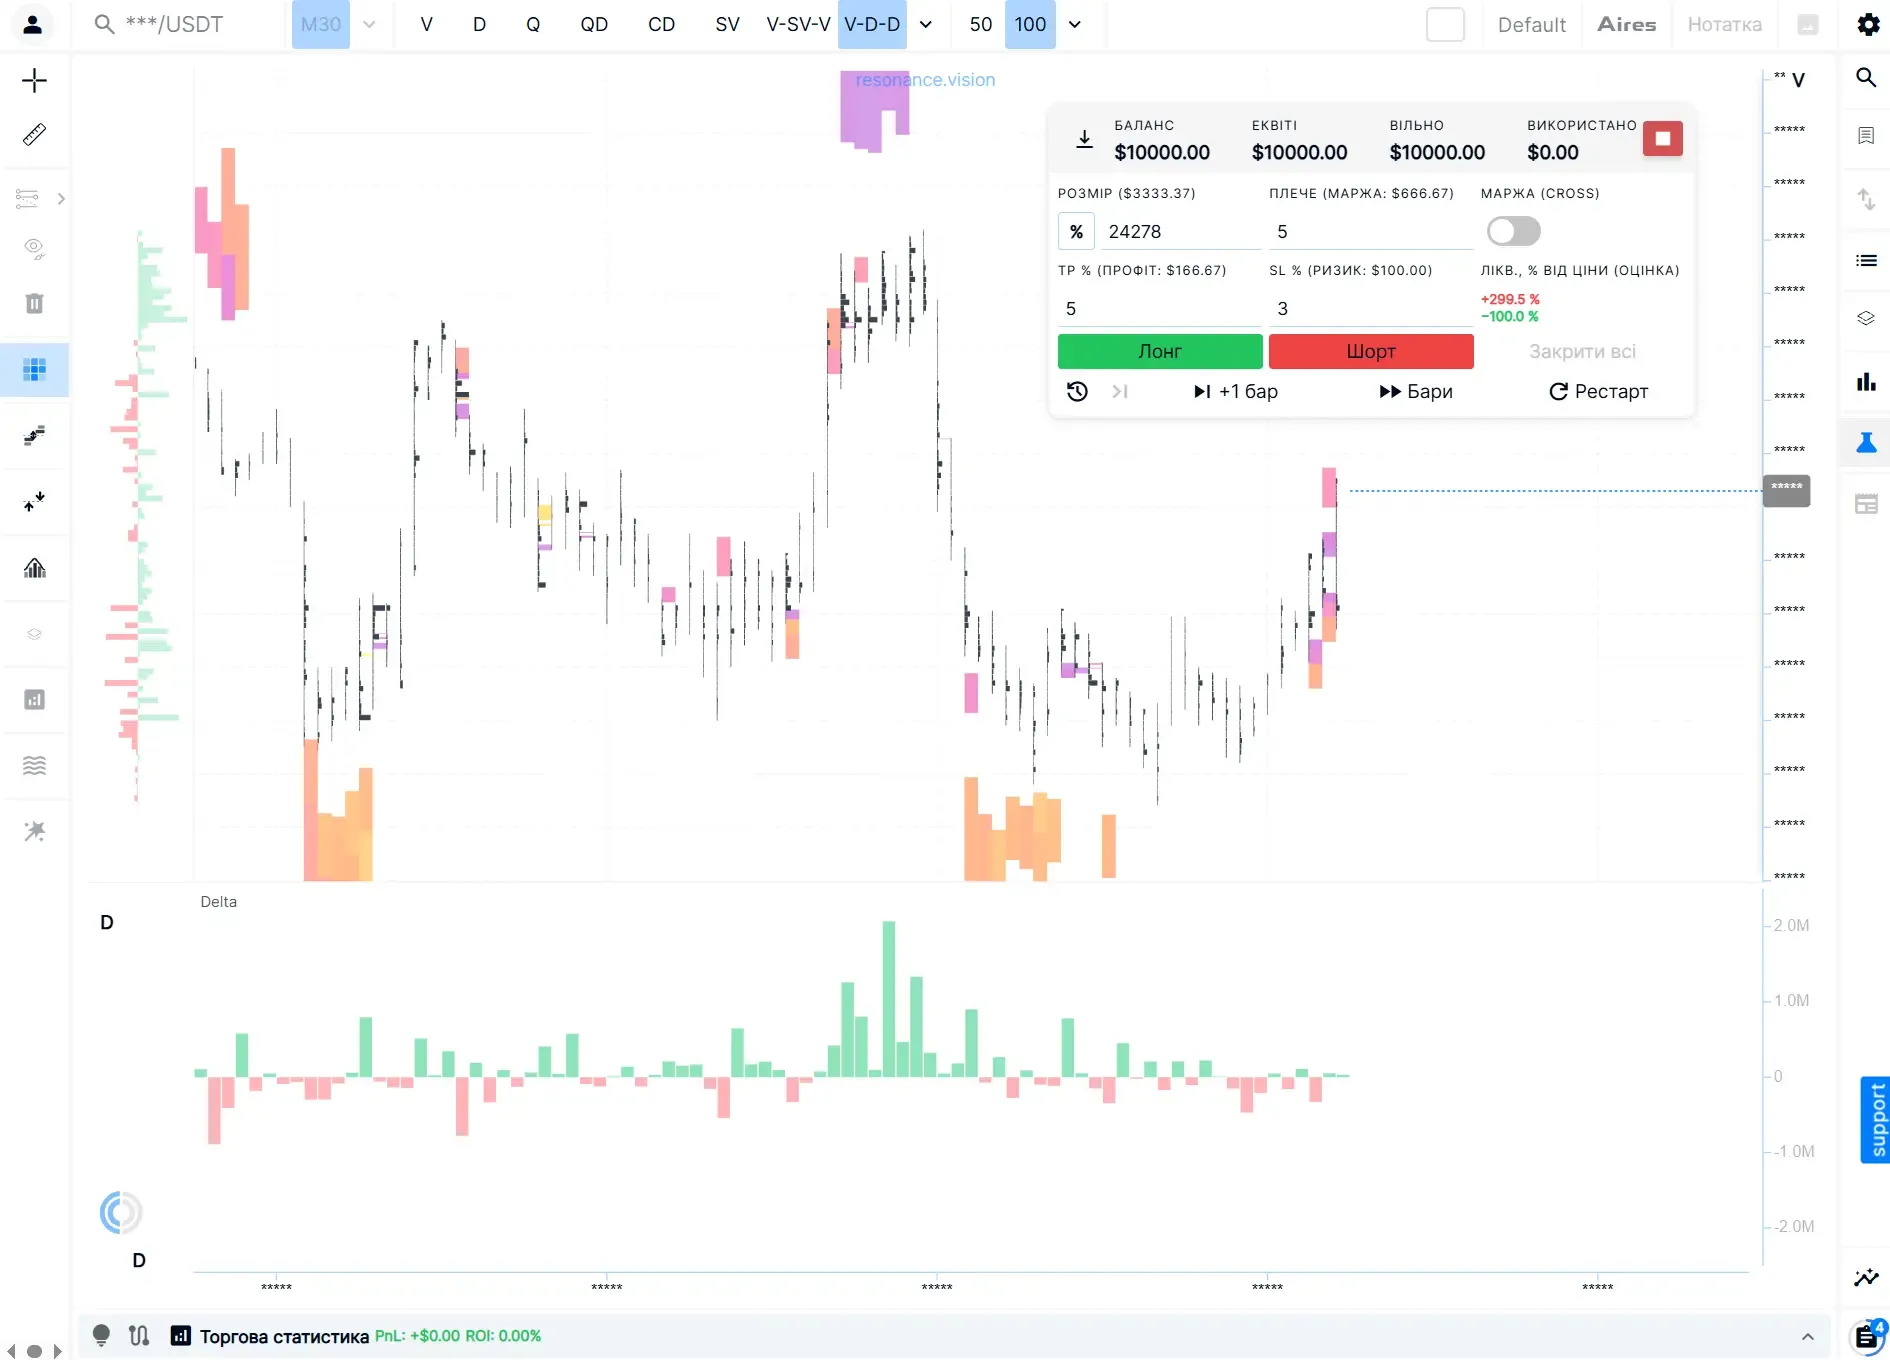
The chart shows signs of a deficit, followed by a possible move higher.
Selling is being absorbed. There is visible limit support. But at this point, you still do not know whether those conditions will persist.
A few bars later, the balance may change. The absorption of selling may strengthen — or disappear.
You may already have enough information to make a decision.
Or the better choice may be to do nothing yet.
On a completed historical chart, most of those questions disappear because the answer is already in front of you.
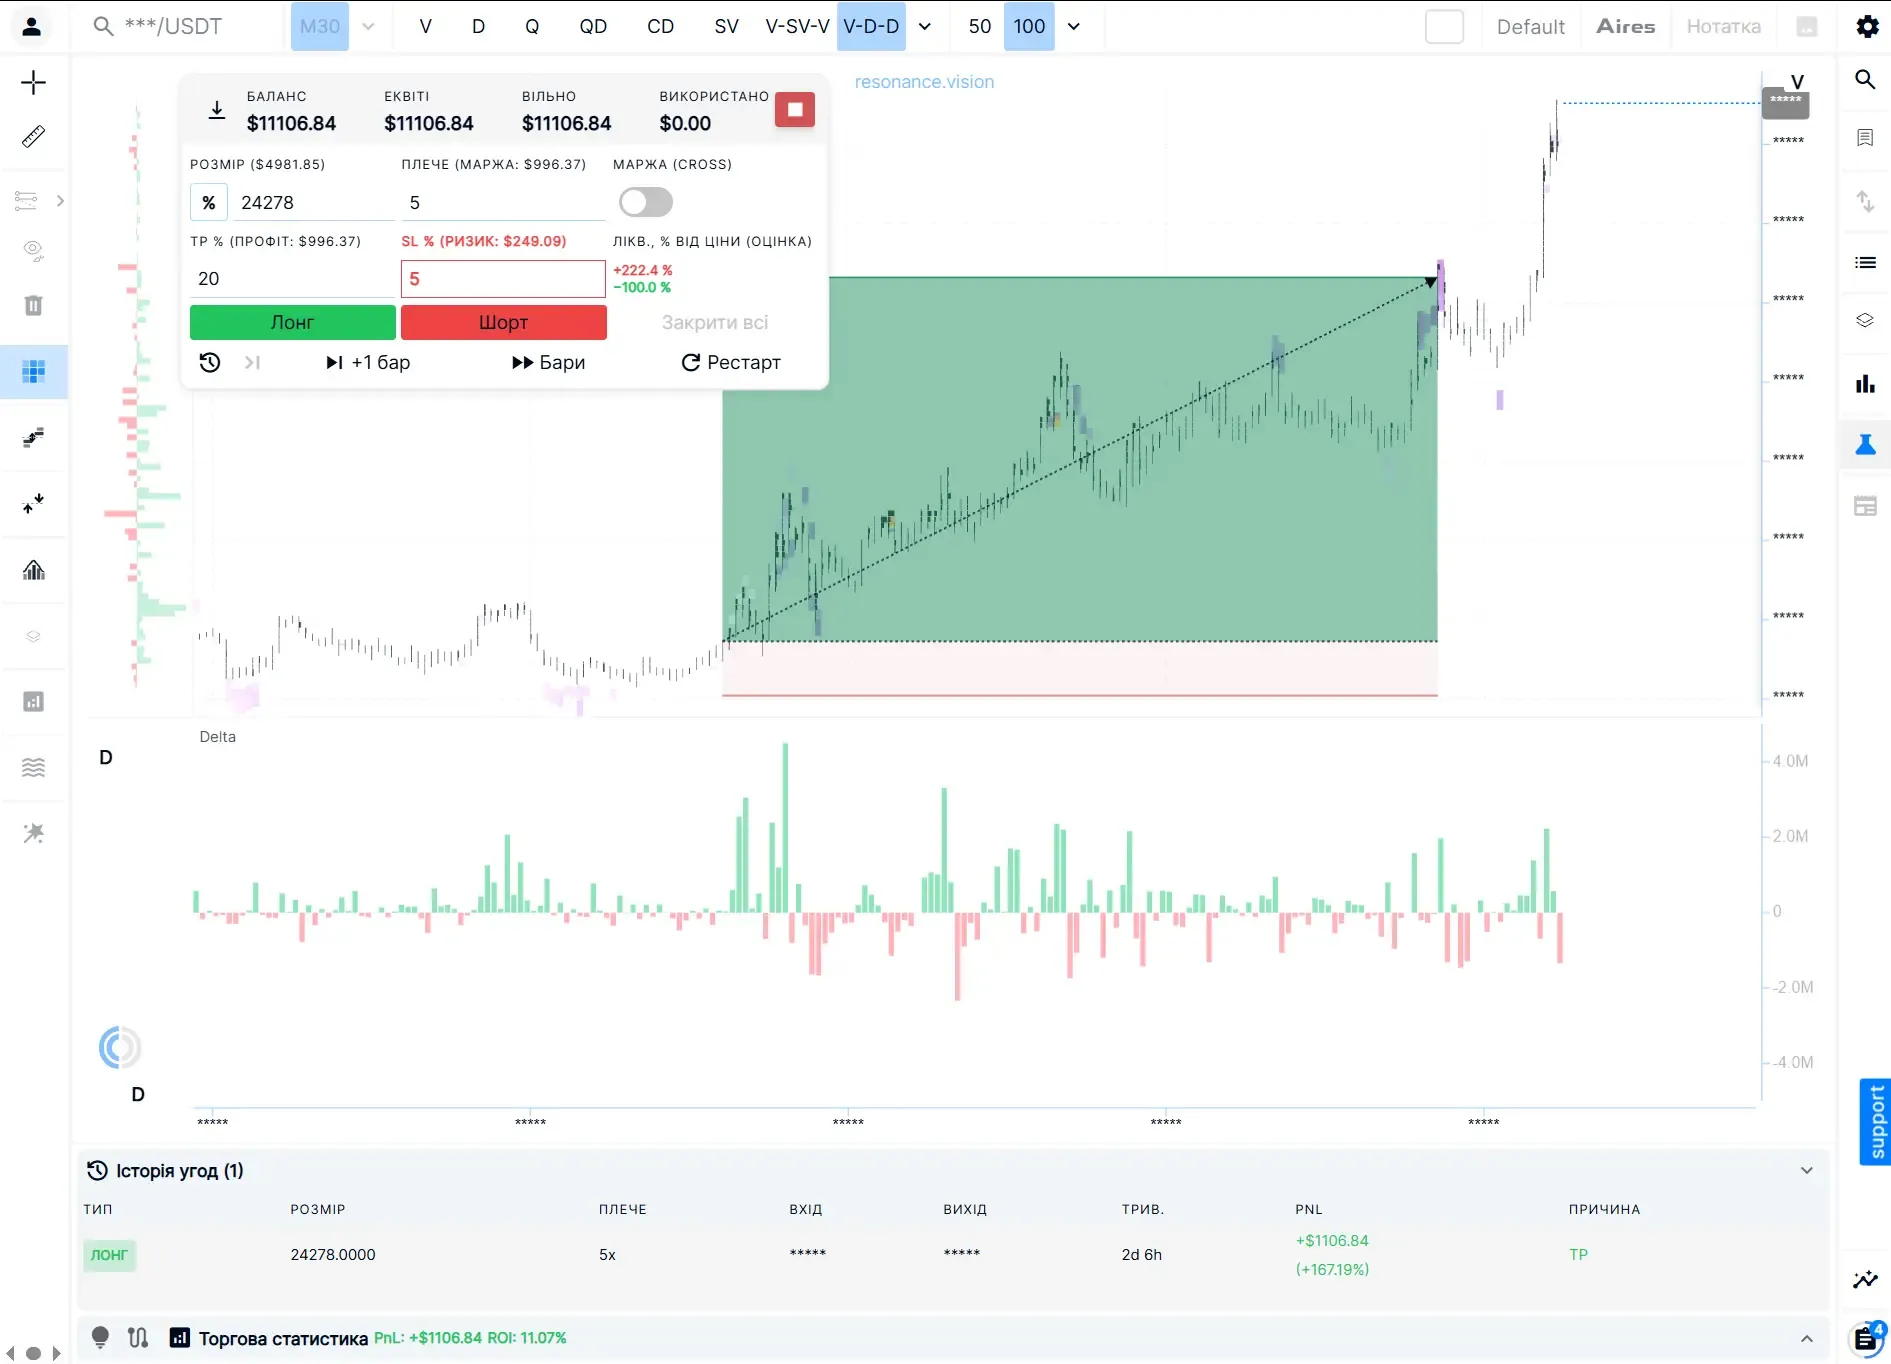
That is why explaining a past market situation is much easier than making a decision while it is still unfolding.
Once the entire move is visible, it is easy to build a clean story:
there was a deficit → selling was absorbed → price moved higher.
But remove everything that happened after the decision point.
Would you still have opened a long position?
The picture is no longer quite so obvious.
When Knowing the Outcome Changes How We See the Past
In psychology, this is known as hindsight bias.
The idea is simple: once we know the outcome, it often feels more predictable than it really was beforehand.
Trading makes this especially easy to see.
If a deficit is followed by a strong move higher, the earlier signs can suddenly look highly convincing.
If a surplus is followed by a decline, the preceding market behaviour can also be arranged into a neat, logical sequence.
But that is the market viewed after the fact.
At the moment of the decision, you did not know:
- which signal would ultimately matter;
- whether the current market state would persist;
- whether the balance would shift;
- what the next few bars would reveal.
A completed historical chart is excellent for answering:
“What happened here?”
But it is much less useful for practising another question:
“What would I do right now if I could not see what happens next?”
That is the problem historical replay is designed to solve.
Why Do You Need a Simulator for This?
Future data is difficult to simply “ignore.”
If you can already see that the market rallied sharply, that knowledge affects how you interpret everything that happened before the move — even if you try to focus only on the earlier part of the chart.
A simulator solves this mechanically: future information is simply unavailable.
You only have the market as it looks now.
For example, you may see signs of deficit or surplus, assess whether buying or selling is being absorbed, and look at resting buy or sell liquidity — if those signals are part of your trading framework and available in the analytical tools you are using.
What you do not know is what will happen a few steps later.
Instead of explaining the past:
“This is why the market moved higher.”
you have to answer a much more practical question:
“Do I have enough information to make a decision now?”
That is no longer just historical analysis.
It is decision practice under conditions that are closer to real trading.
Why Not Just Scroll Back on a Chart?
At first, a separate simulator may seem unnecessary.
You could open the historical chart of a coin you know, scroll back and move forward gradually.
But several problems appear quickly:
- you may accidentally see future price action;
- you may recognise a familiar part of market history;
- you may remember what happened to that particular coin during that period.
Even one of those clues changes the conditions under which you make the decision.
Controlled replay therefore needs to do more than hide the next few candles.
Its real job is to preserve one key condition:
when you make the decision, you do not know what happens next.
In a random simulation in Simulator, you also do not choose the coin you want to practise on.
The coin is selected at random.
Its name, date and absolute price level are hidden.
So instead of relying on your memory of a specific asset or historical period, you have to work with the market situation in front of you.

How Does Bar-by-Bar Market Replay Work?
Look at the current chart.
A deficit is playing out: strong market buying is pushing price higher.
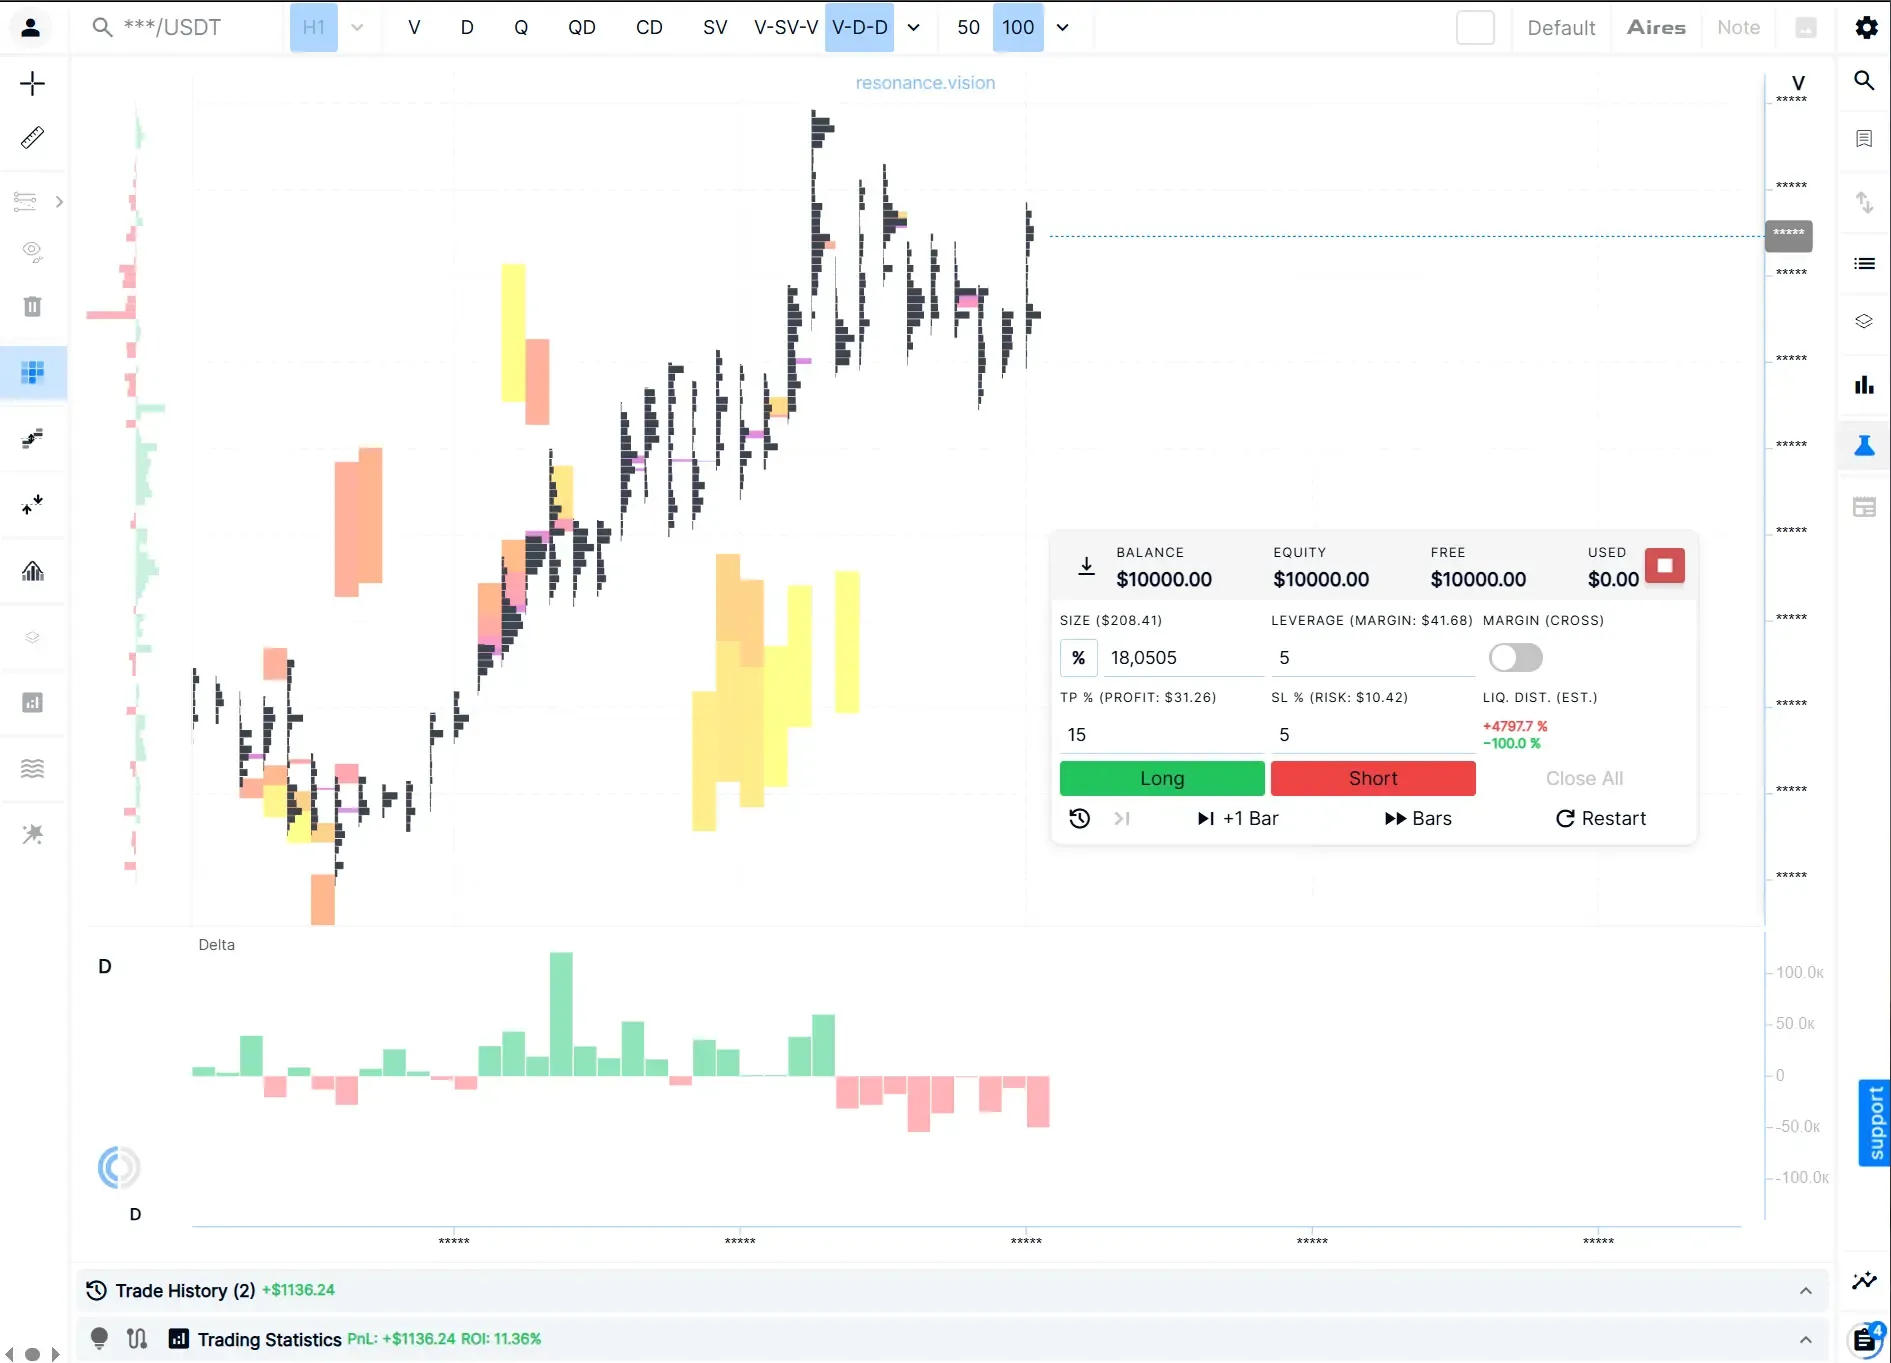
Market selling is being absorbed. The situation may suggest that the upward move could continue.
What do you do?
The chart itself does not give you a ready-made answer.
You assess the other information available to you — for example, resting limit orders, market-order pressure or the current market phase — and decide not to act yet.
You wait.
Then new data appears.
Significant market selling enters and begins to push price lower effectively.
The market situation has changed.
New market buying is no longer strong enough to push price to a fresh high. The balance of pressure has shifted.
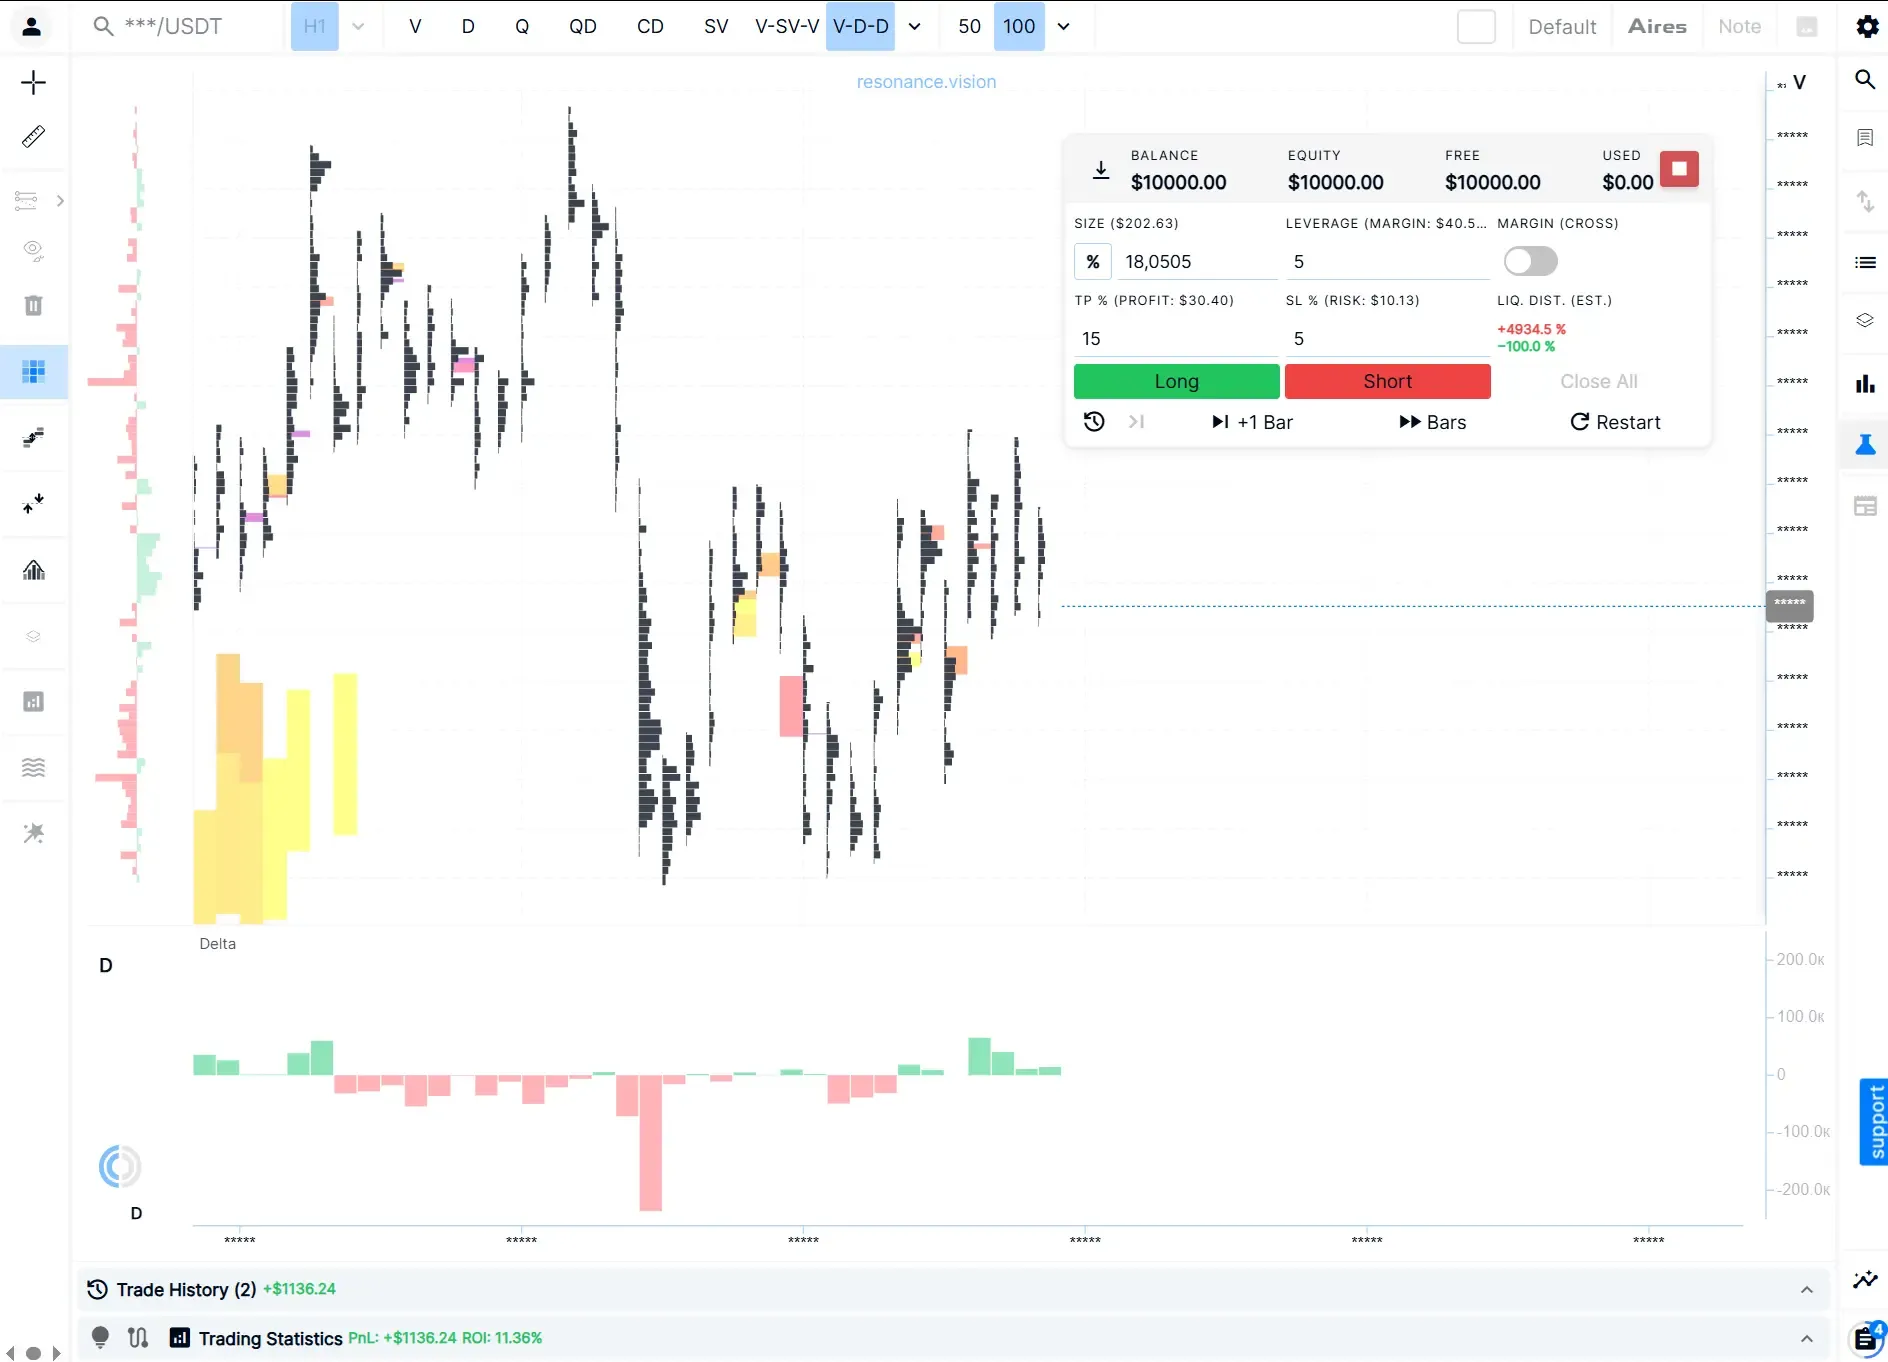
Is that enough to act?
You have to decide now — before the next piece of information appears.
From here, several things could happen.
Selling could continue to be absorbed, or that absorption could weaken.
The balance could shift again.
Markets change constantly. That is normal.
But the decision still has to be made in the moment:
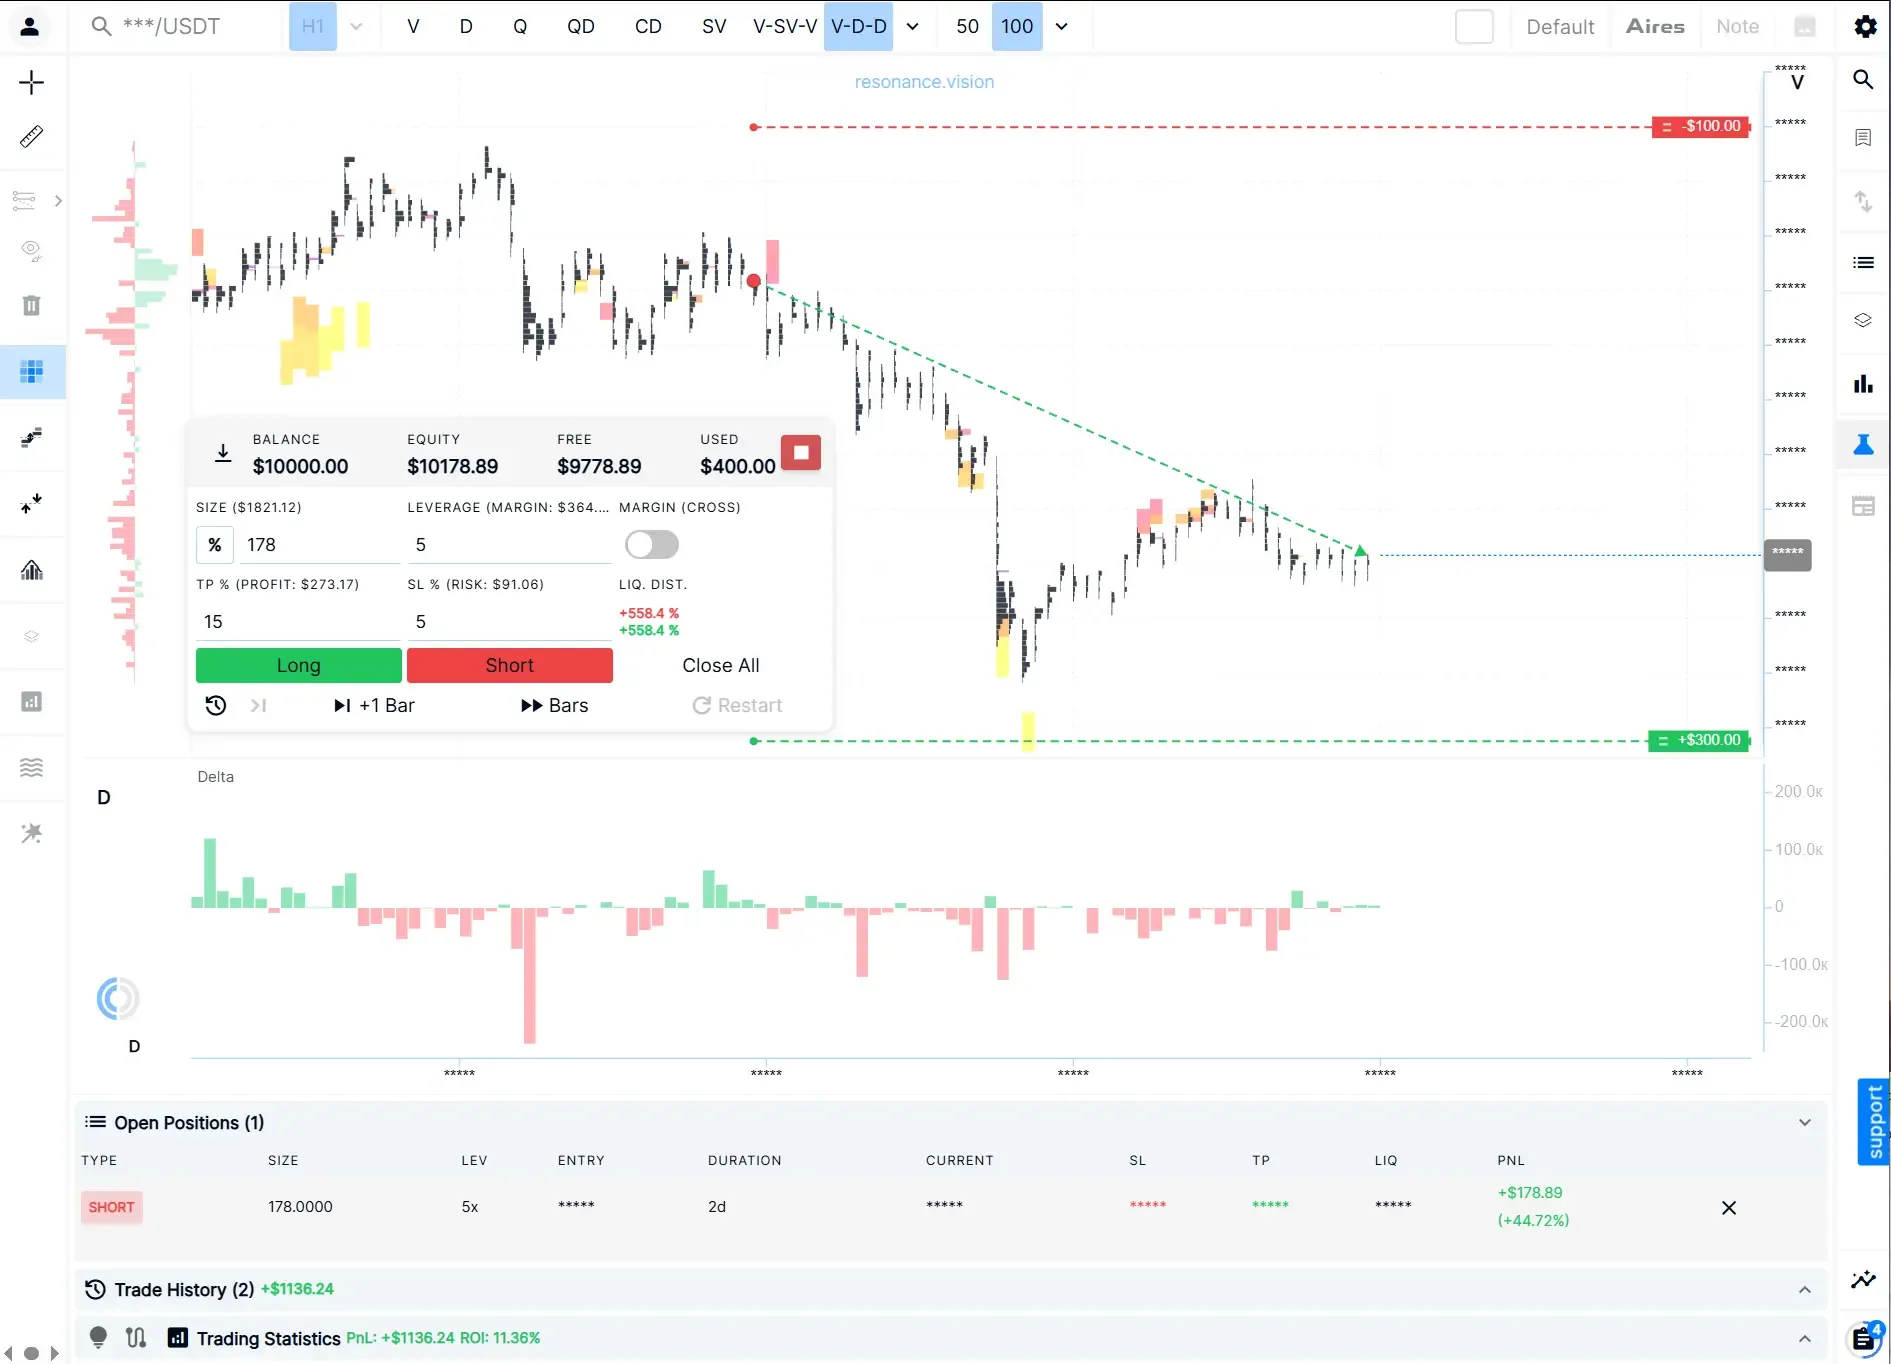
Do you wait or open a position?
If you trade, do you go long or short?
Do you have enough evidence?
Historical replay is therefore not a game of “guess the direction.”
It is a repeated process of analysis and decision-making.
Each new piece of information can confirm your previous view — or force you to revise it.
That sequence disappears when the entire historical chart is already visible.
Why Do Random Historical Scenarios Matter?
There is another problem with practising on historical charts: we naturally gravitate toward good-looking examples.
Suppose you want to practise identifying potential reversals.
If you search through completed charts yourself, the situations that attract your attention first are usually the ones followed by a clear move.
They are easier to notice.
They are easier to explain.
And they are more satisfying to practise on.
But real markets are not made up only of clean, obvious situations.
In one case, signs of deficit or surplus may persist.
In another, they may quickly fade.
The absorption of selling or buying may strengthen — or fail to develop.
Different pieces of information may contradict each other.
And sometimes the best decision is simply not to open a position.
A random scenario in Simulator does not remove every possible form of bias.
But it reduces your ability to deliberately select only those examples where the answer already looks neat and obvious.
That matters for practice.
What Does Historical Replay Actually Train?
The main value of this type of practice is not the number of trading situations you see.
What matters more is when you have to make the decision.
You may see signs of a deficit but still not know whether it is fully established or only beginning to form.
You may see selling being absorbed but have no idea whether that behaviour will continue.
You may see signs of surplus but still need to assess them alongside the rest of the market data.
You may see buying being absorbed, while future price action gives you no clue yet about how important that signal will turn out to be.
So instead of asking:
“Which signal worked here?”
you have to ask:
“What are the data telling me now, and is that enough to make a trading decision?”
That is the part of trading practice that is difficult to reproduce on a completed historical chart.
For more on opening positions, defining risk, setting loss limits and profit targets, and managing a trade, see Crypto Trading Simulator: How to Practice Trading Without Risking Real Capital.
Historical Replay and Practice on the Live Market Are Different
Both can be used to practise without putting real capital at risk.
But the conditions are different.
When practising on a virtual account in real time, you have to wait for relevant market conditions to develop naturally.
With historical replay in Resonance, you can work through different past market situations one after another instead of waiting hours or days for a new opportunity to appear.
The future outcome of each scenario remains hidden.
That makes historical replay particularly useful when the goal is to repeat the decision-making process across many different market situations without stretching that practice over a long period of time.
Historical Replay Is Not Automated Backtesting
These approaches answer different questions.
In automated backtesting, the rules are defined in advance and an algorithm applies them to historical data.
In a simulator, the decisions are made by a person.
You can wait.
You can skip a situation.
You can change your assessment when new information appears.
You can even react differently to two very similar market setups.
That is why replay can reveal not only what happened in the market, but also how you make decisions.
But a good result in a simulation does not prove that a strategy will be profitable in the future.
Historical data is still historical data.
It gives you material for practice and analysis — not a forecast of future performance.
How Historical Replay Works in Resonance Trading Simulator
Resonance Trading Simulator uses real historical crypto market data.
In a random simulation, you do not choose the coin or the historical period you want to practise on.
The coin is selected at random.
Its name, date and price are hidden.
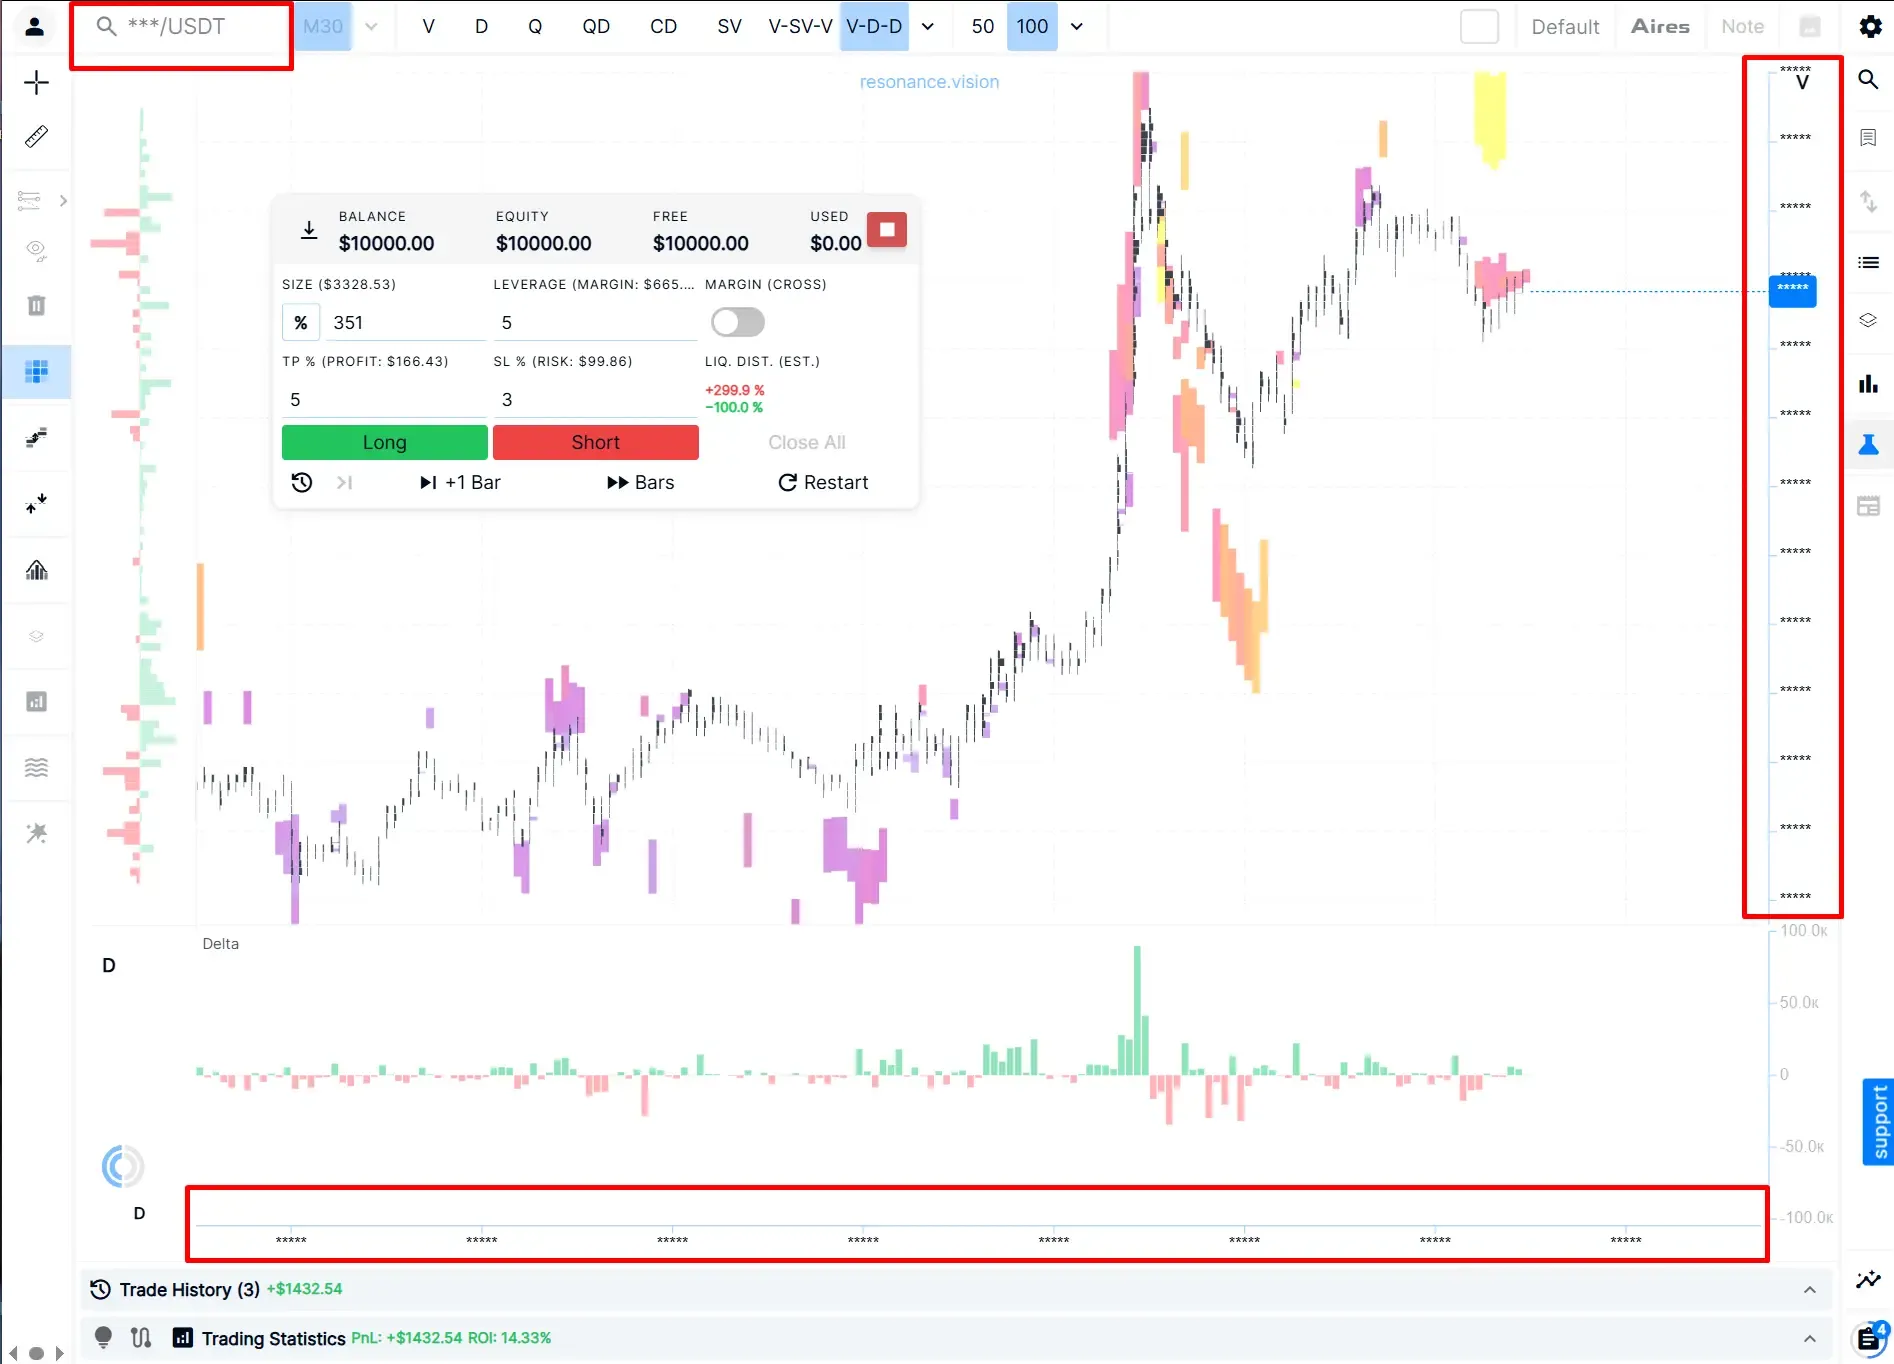
Future market data is hidden as well.
That means you have to work with the market situation in front of you rather than with prior knowledge of the asset or historical period.
From there, the data is revealed gradually, bar by bar.
First, you analyse the information available.
Then you make a decision.
Only after that do you see what comes next.
Depending on the simulation mode and the tools available to you, you may also have additional context about market structure and market state.
The available toolset varies by mode and plan, so those tools are not part of every random simulation.
The core mechanic, however, stays the same:
current market state → decision → new information → reassessment
That is what Simulator is for.
Not to find the “right” trade on a chart where the outcome is already visible.
But to make decisions before you know how they turn out.
What Comes After the Practice?
One scenario can help you review one particular decision.
After a series of simulations, a different question becomes more important:
Are there patterns in the way you make decisions?
Maybe you read changes in market conditions correctly but tend to act too early.
Maybe you assess similar situations differently.
Maybe after several poor decisions, you begin to drift away from your own rules.
That is the next stage: trading performance analysis.
Historical replay answers the question that comes before it:
What will I do when I still do not know the outcome?
That is where trading decision practice begins.
Practice trading decisions on real historical data in Resonance Trading Simulator.
Frequently Asked Questions
What Is Historical Crypto Market Replay?
Historical market replay is practice on real past market data where future price action is hidden and revealed gradually. You have to make decisions before you know what happened next.
Why Use a Simulator Instead of Simply Reviewing Old Charts?
On a completed historical chart, the outcome is already visible, and that affects how you interpret everything that came before it. A simulator removes that future information and lets you work only with what would have been known at the current point in time.
Can I Choose the Coin for a Random Simulation in Resonance?
No. The coin is selected at random. Its name, date and price are hidden so that you do not receive additional clues about the historical scenario.
Why Are the Coin Name, Date and Price Hidden?
Those details can help you recognise an asset or a specific period in market history. If the goal is to practise making decisions without knowing the outcome, removing those clues helps preserve the uncertainty of the scenario.
How Is Historical Replay Different From Automated Backtesting?
In automated backtesting, predefined rules are applied to historical data by a program or algorithm. In historical replay, new data is revealed gradually and the decisions are made by the user.
Does a Good Result in the Simulator Prove That a Strategy Is Profitable?
No. A simulation shows how your decisions performed across a particular historical sample. It does not predict future market conditions or guarantee that the same result will be repeated.
Theory builds understanding. Practice builds trading skills.
With Trading Simulator by Resonance, you can practice trading decisions using historical market data, test your strategies, analyze mistakes, and gain experience without risking real capital.
🚀 Try Trading Simulator and turn market knowledge into practical experience.
🎁 Use promo code TOPBLOG to get 10% off any Resonance subscription plan.
📢 Follow new articles, market insights, and practical trading content in our Telegram channel.
🔗 Register with our partner exchanges:
Recommended articles