Order Book in Trading: How to Read and Use the Depth of Market

How do limit orders work? What is their impact on the market? We explain the logic behind the order book and the mechanics of price movement in simple terms. We also explore how to effectively analyse limit order dynamics using the Resonance platform’s tools.
Table of contents

Introduction
The market is like a massive online auction where millions of people buy and sell assets every second. However, prices aren’t set by a single entity—they’re shaped by the interaction of all participants. At the heart of this process lies the order book.
This article explains in simple terms how limit orders function in crypto , why they don’t always reflect real demand, and how to properly read the order book. We’ll also see how tools like Depth Density (depth of market) and BAS from the Resonance platform help analyse the order book on exchanges.
Basics: Limit Orders and the Order Book
What is a Limit Order?
A limit order is an intention to buy or sell an asset at a specific price. It’s not a completed transaction. A limit order can either be executed by a market order or cancelled.
For example, you tell the market: “I want to buy Bitcoin, but only if the price drops to $90,000.” If the market reaches that price, your limit order will be executed, and you’ll own BTC. If not, the order sits and waits.
The same applies to selling: “I’ll sell BTC, but only at $120,000.” This is your intention to sell. However, you can change your mind, right?
So, a limit order is neither a purchase nor a sale — it’s just an intention. This is crucial to understand. The order book is made up of these “intentions”.
What is an Order Book?
The order book is a table displaying all active limit orders for buying and selling cryptocurrency. It’s divided into two parts:
- Asks: Orders to sell. These are offers from participants who want to sell an asset at a specific price, usually shown in red.
- Bids: Orders to buy. These are offers from participants who want to buy an asset at a specific price, typically shown in green.
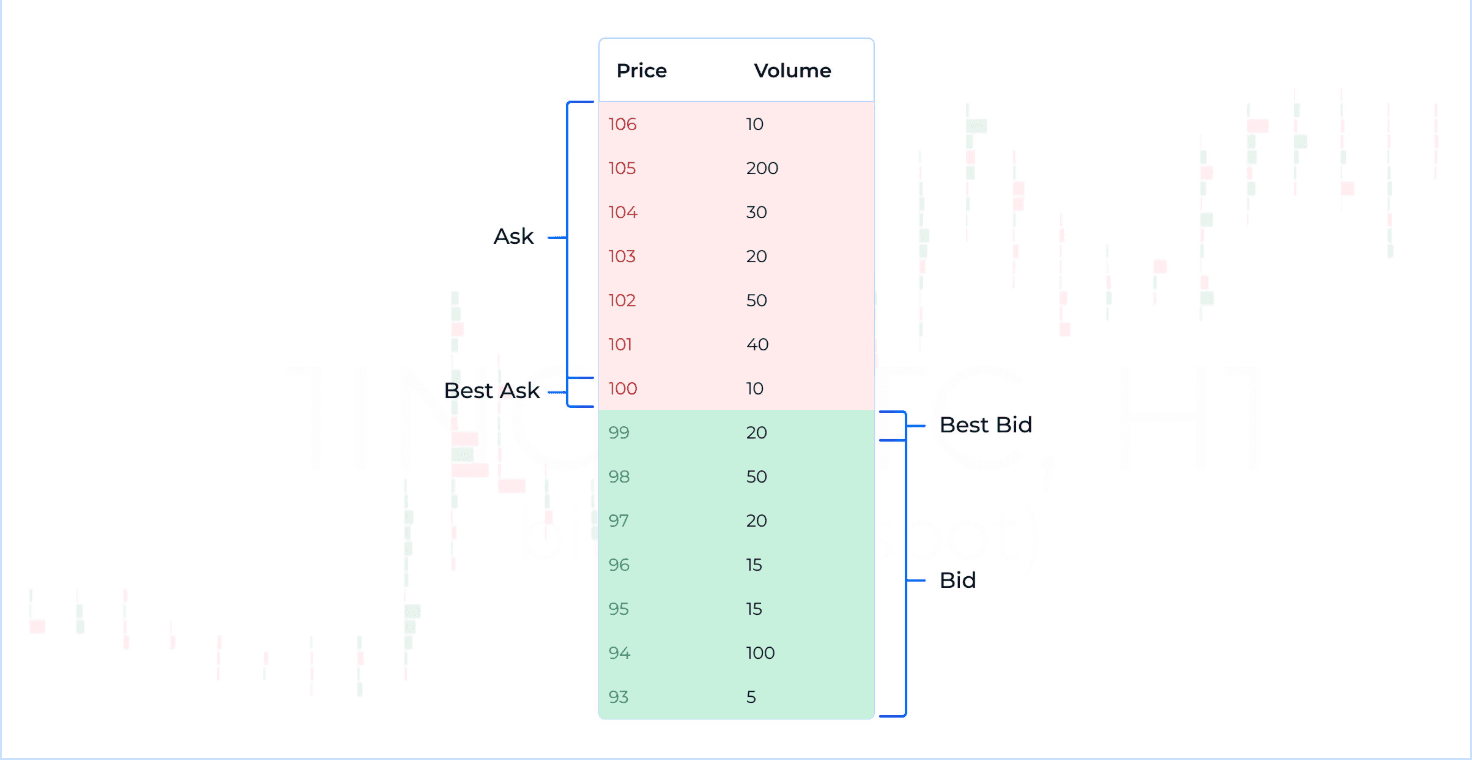
The key parameters of the order book are price and volume:
- Best Bid / Best Ask: The best (closest) prices for buying and selling.
- Spread: The difference between the Best Bid and Best Ask.
Every participant places buy or sell orders, forming the The order book is a table displaying all active limit orders for buying and selling cryptocurrency. When a market transaction occurs, a market order executes a limit order, altering the balance of the order book.
Key Point: Price movement isn’t driven by limit orders but by executed trades — the real-time state of supply and demand. When someone buys at the market price, they “consume” sellers’ limit orders, pushing the price up. When participants sell at the market price, they execute buyers’ limit orders (bids), causing the price to drop.
And since the limit is only a promise, cryptocurrency order book trading is not a highly effective way of trading.
In essence, limit orders are like queues in a shop. They show who’s waiting, but they don’t explain why the price suddenly rises. Price increases result from rising demand, with market participants actively buying.
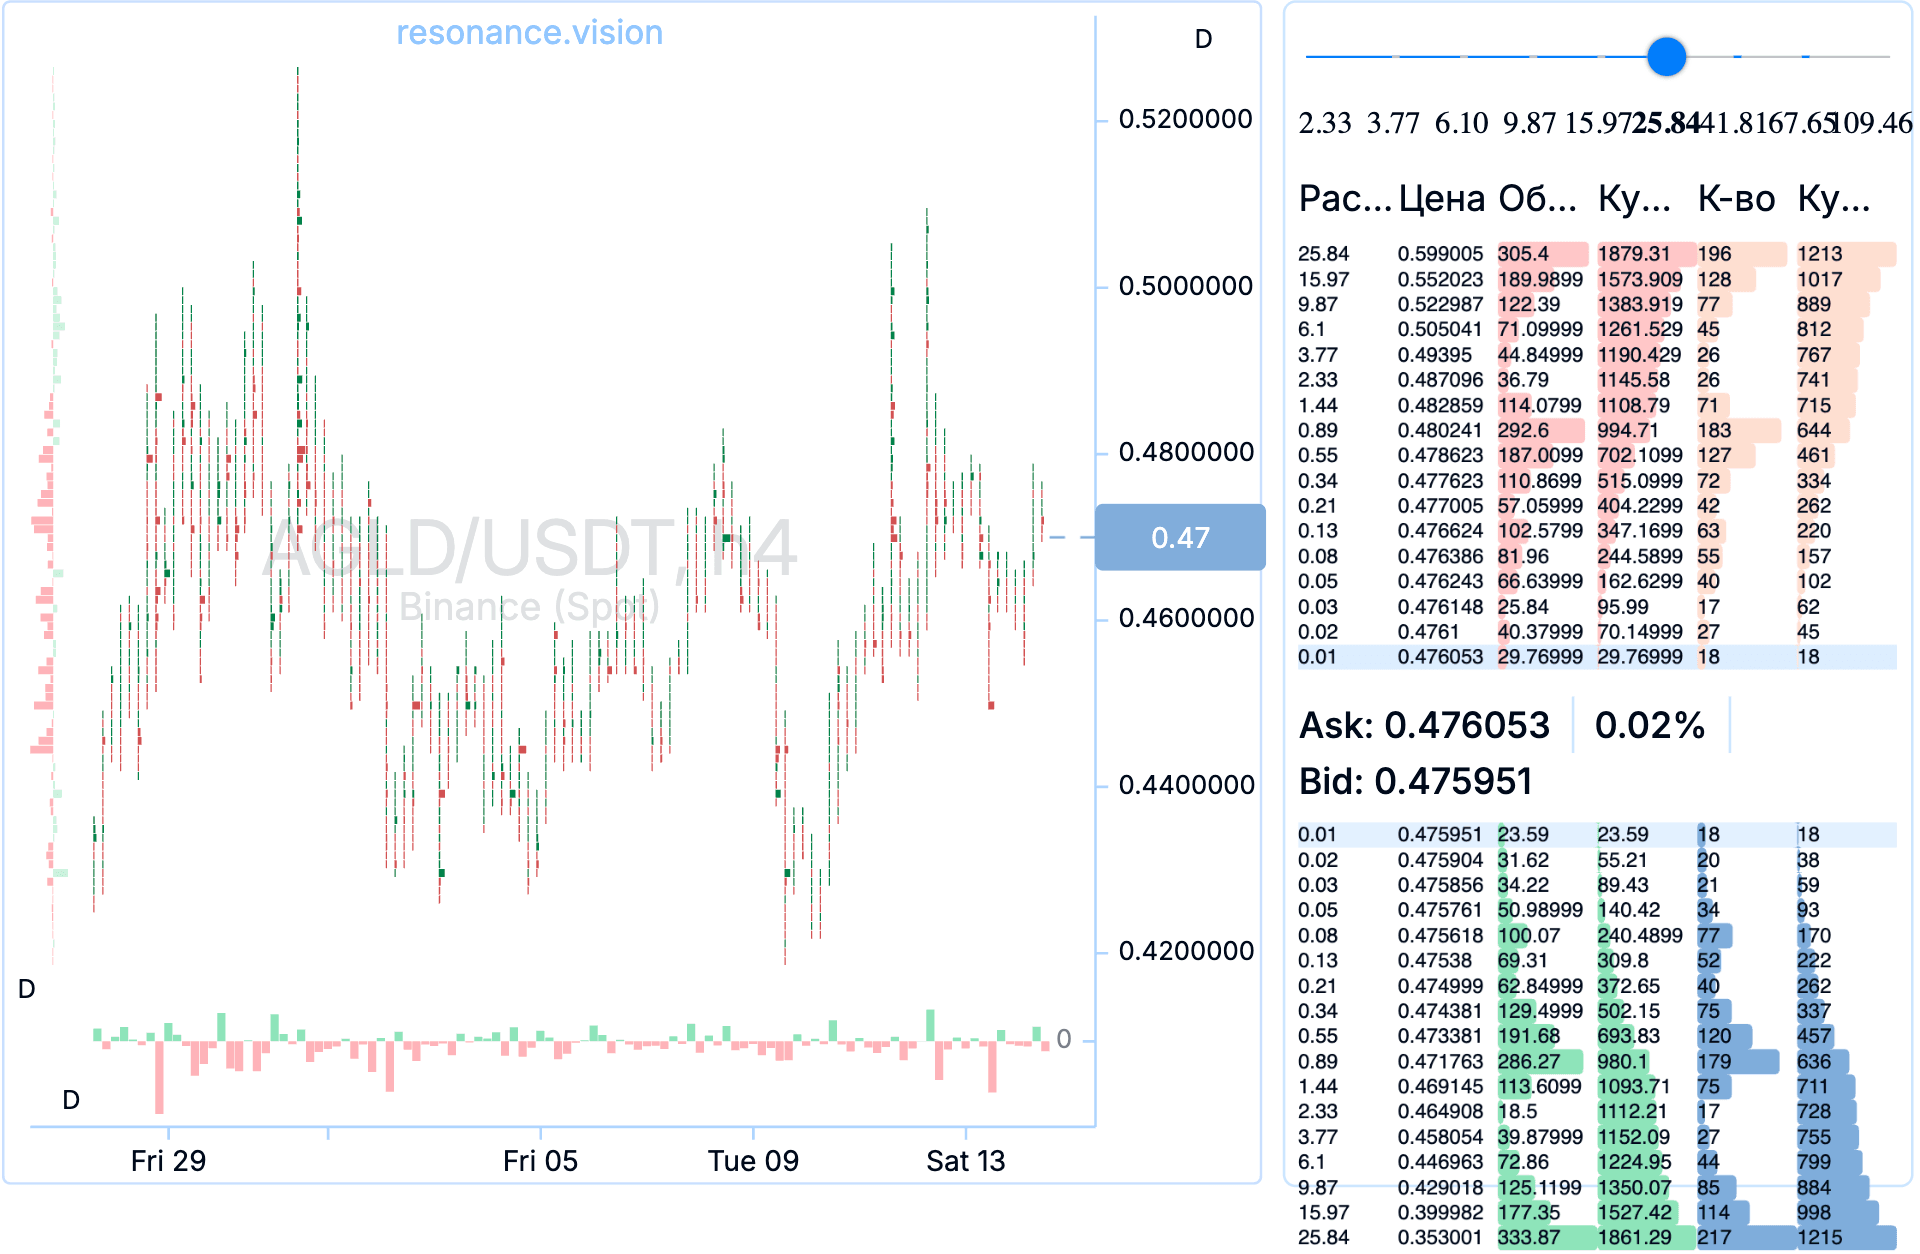
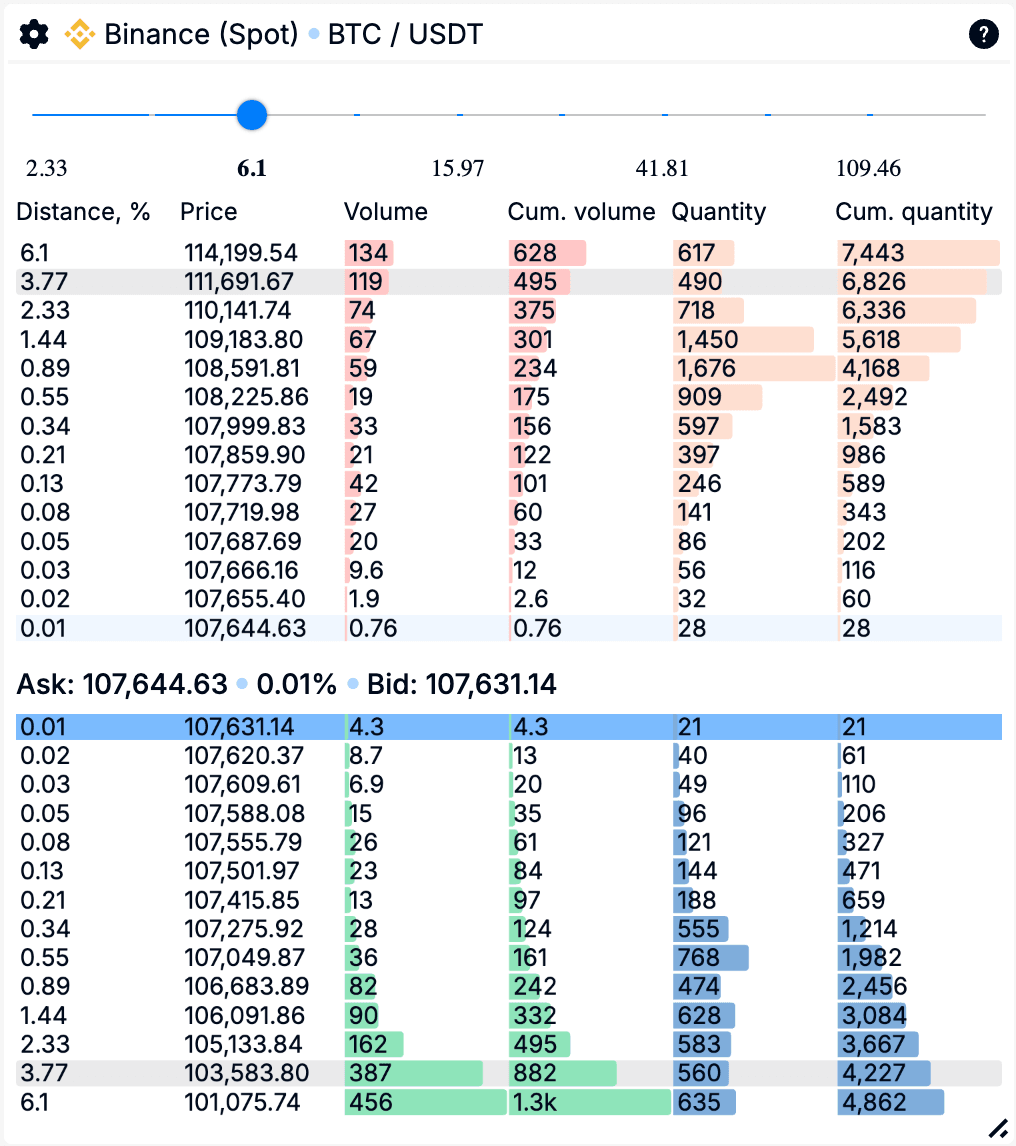
Typically, an exchange’s order book looks like this:
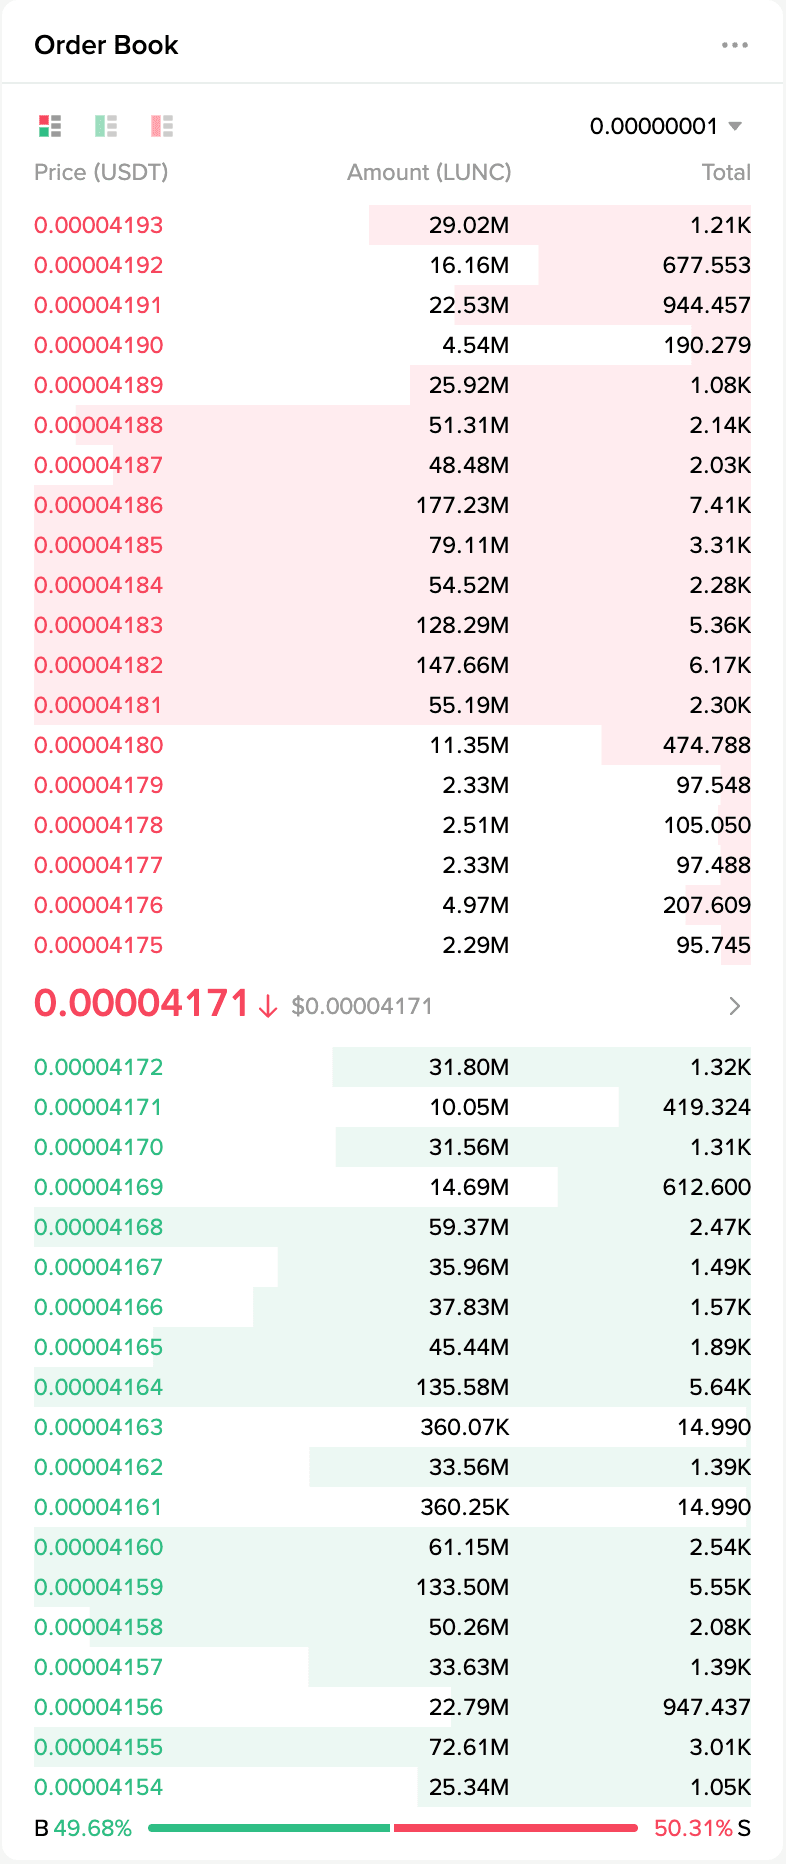
Its downside is the difficulty in reading and analysing information due to the high activity of market participants. What we see on an exchange is just the tip of the iceberg—only a small number of orders near the current price are displayed. It’s convenient for executing trades but not ideal for analysis.
On the Resonance platform, the market depth tool takes a different approach. It groups crypto orders into percentage ranges, such as:
- 0% to 0.5% from the current price,
- 0.5% to 1%,
- 1% to 2%, and so on.
This allows you to see how many real orders are placed at different distances from the current price.
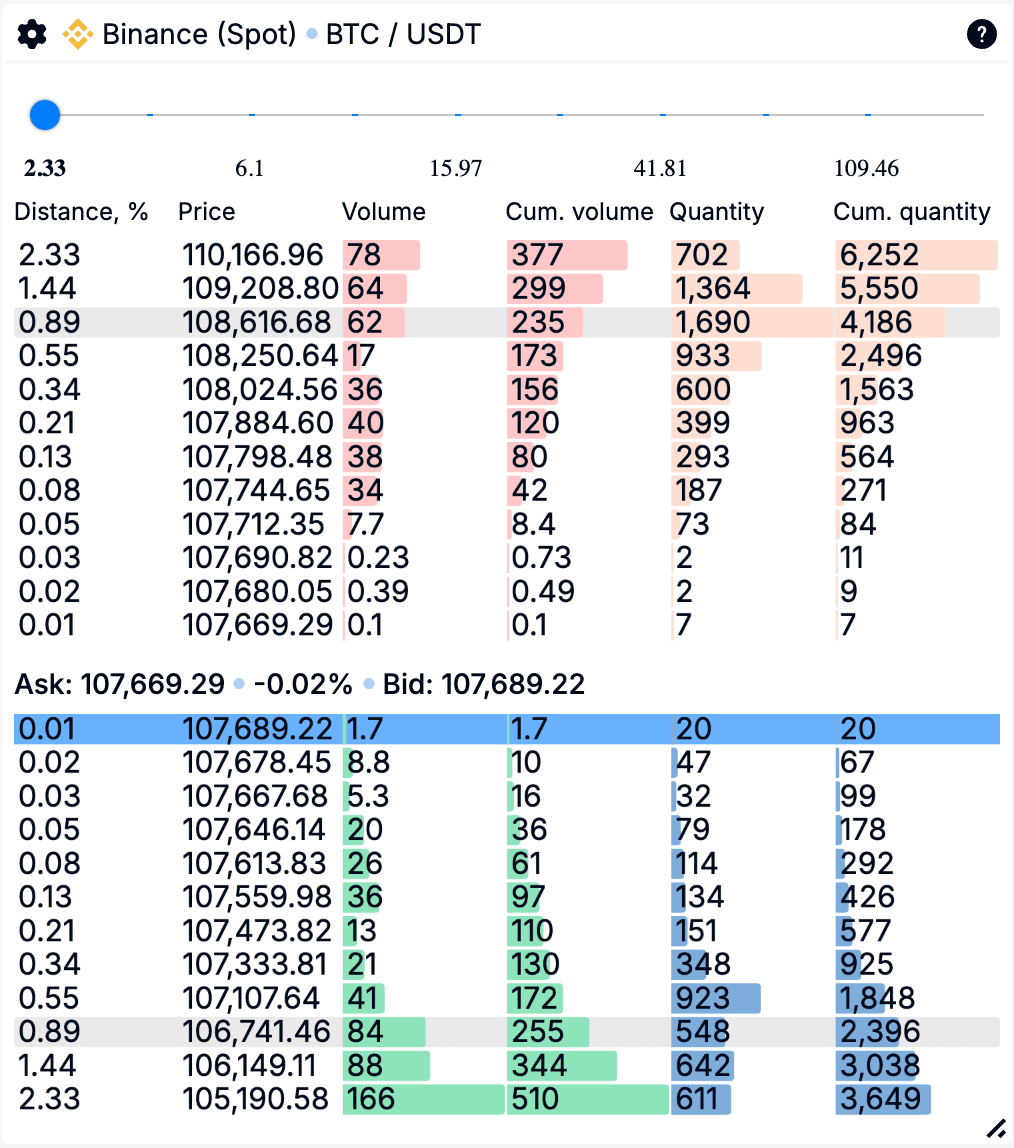
Thus, Depth Density (depth of market) is an aggregated structure of limit orders in percentage ranges, used for analysis rather than execution, helping to assess an asset’s liquidity. This tool reveals how deep the market is and how much volume is needed to move the price.
Analysing the Order Book in Crypto
Now, the interesting part. The market has several key states that can be easily identified through the order book:
1. Balance:
- The number of buy and sell orders is roughly equal. Volumes are evenly distributed, the price moves within a narrow range, and the asset appears “calm.”
- There are no significant accumulations in clusters, and the price stays within a range.
This suggests nothing significant is happening. It’s not worth spending time analysing assets in balance. If the price is simply fluctuating without accumulation, the asset is likely being “driven by algorithms.”
2. Deficit (indicating potential growth):
Prices rise when a deficit forms—a lack of supply. This is visible through:
- Large sell-offs, but the price doesn’t drop.
- The order book is dominated by bids (limit buy orders).
This is when strong participants are buying up the market, leading to an upward move. We see market sales not lowering the price (no new lows). In Depth Density (market depth), there are more buy limit orders — a clear sign of emerging demand, suggesting a potential entry point for a long position.
3. Support:
After an initial wave of growth, the price pauses, and limit buy orders appear, preventing it from falling. This is a support zone. If sales don’t push the price down, meaning the deficit persists, you can hold your position or consider adding to your long position.
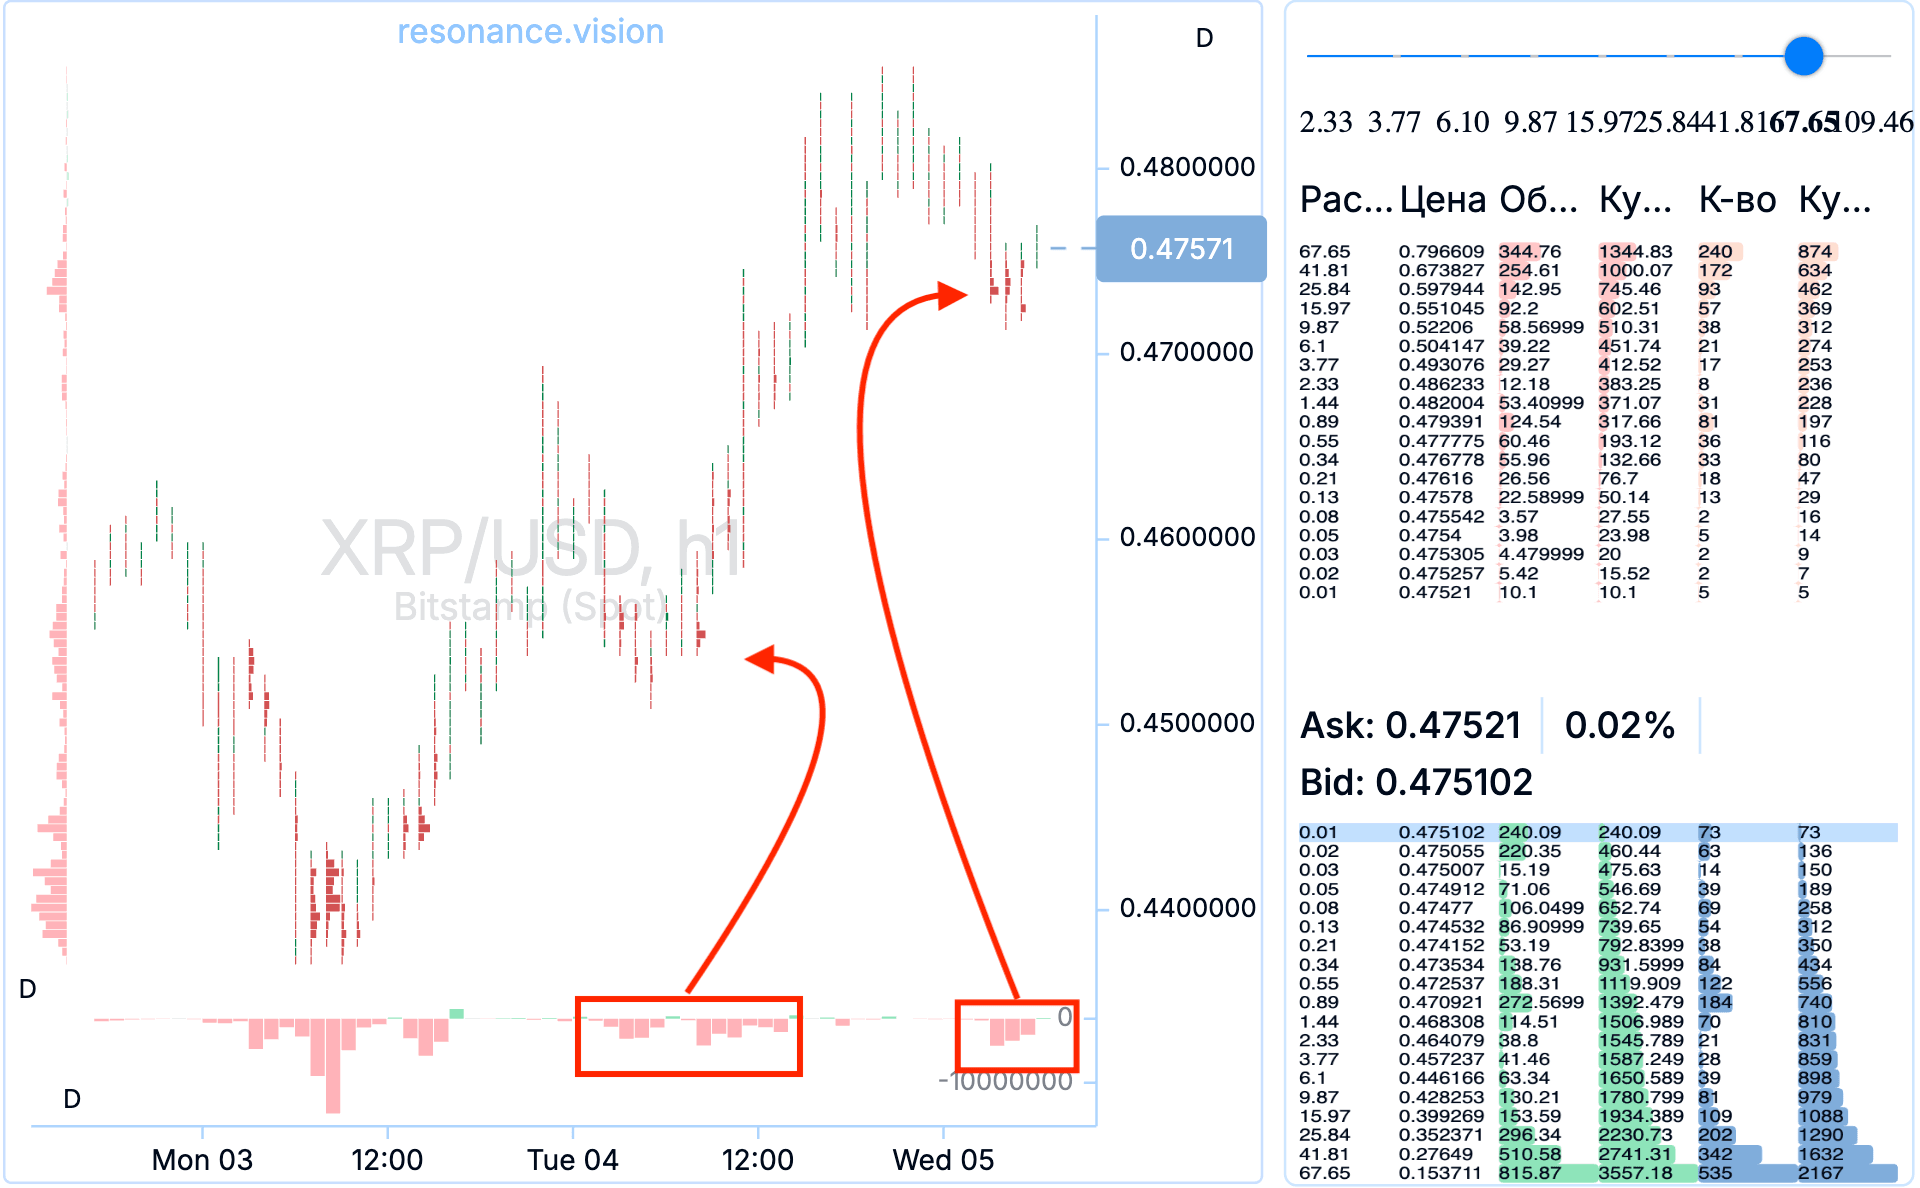
For example, we see the price rising, followed by limit buy orders during pullbacks. Market sell volumes are absorbed, confirming the deficit. You can add to your position after accumulation forms, while raising your stop-loss.
4. Surplus (or its formation):
At market highs, many limit buy orders often appear. This is typically a signal for funds that there’s enough buy volume in the order book to lock in profits by selling to new buyers. For us, this is also a chance to take partial profits, as a pullback may follow.
Limit Orders vs. Clusters: What Matters Most?
Many traders make the common mistake of focusing solely on limit orders. But limits are just intentions to buy or sell. The real action lies in executed trades, visible on a cluster chart. Clusters show where actual buying and selling occurred.
Limit orders help confirm high demand (or supply), which should first be identified on the cluster chart. The rule is simple: start with clusters, then look at limits.

Tools for Analysing the Order Book Online
Depth Density (depth of market):
You’re already familiar with this tool. Depth Density (market depth) shows how many limit orders are placed in different percentage ranges from the current price. Unlike an exchange’s order book, which shows only a few dozen levels, Resonance’s depth of market provides a full picture of liquidity distribution. This helps understand how “deep” the market is and how much volume is needed to move the price up or down.
Depth Density (market depth) isn’t just a table — it’s an analytical indicator of potential price movement. If nearby levels are nearly empty, the market is thin, and a small volume can cause sharp price changes. If large orders are densely packed, it’s a “wall” that’s hard to break through.
BAS (Bid-Ask Sum):
BAS is Resonance’s primary tool for assessing limit order dynamics. It offers multiple ways to visualise the past and current state of the order book:
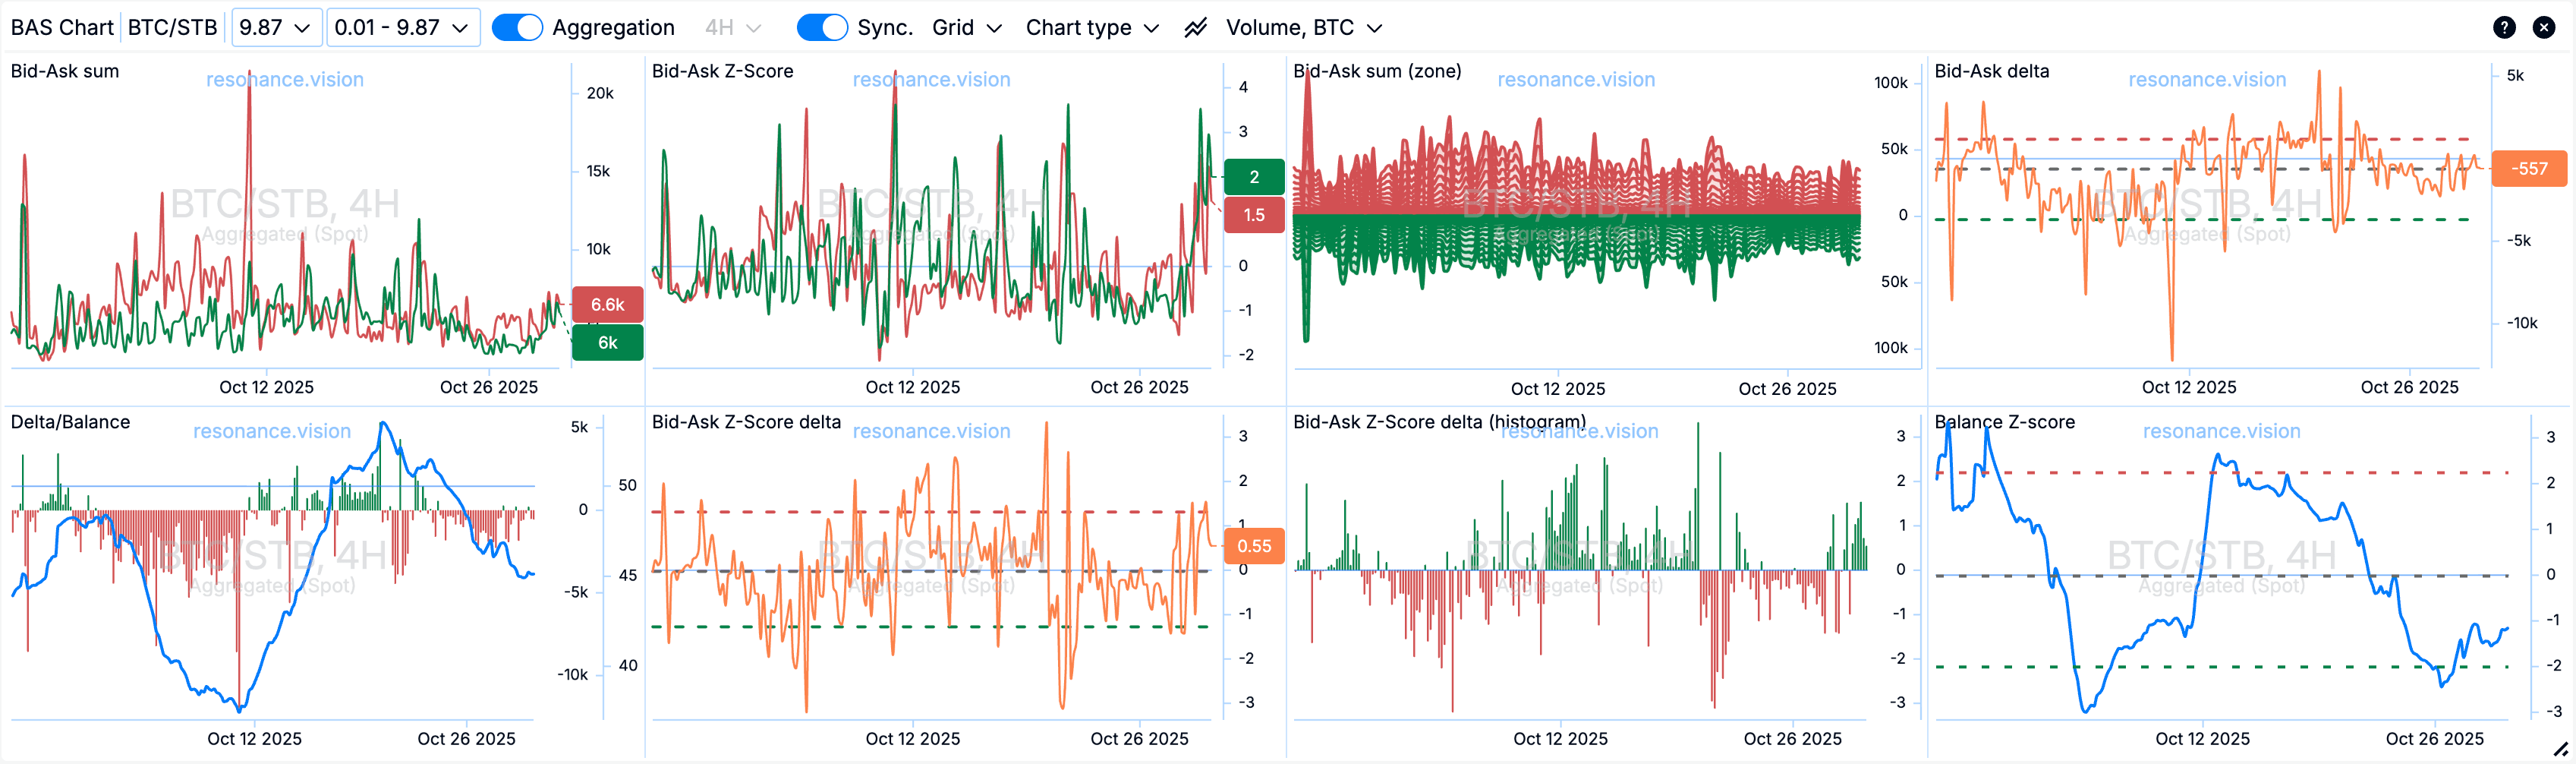
- Bid-Ask Sum: The cumulative volume of orders on both sides (buy and sell). It shows how this changes over time.
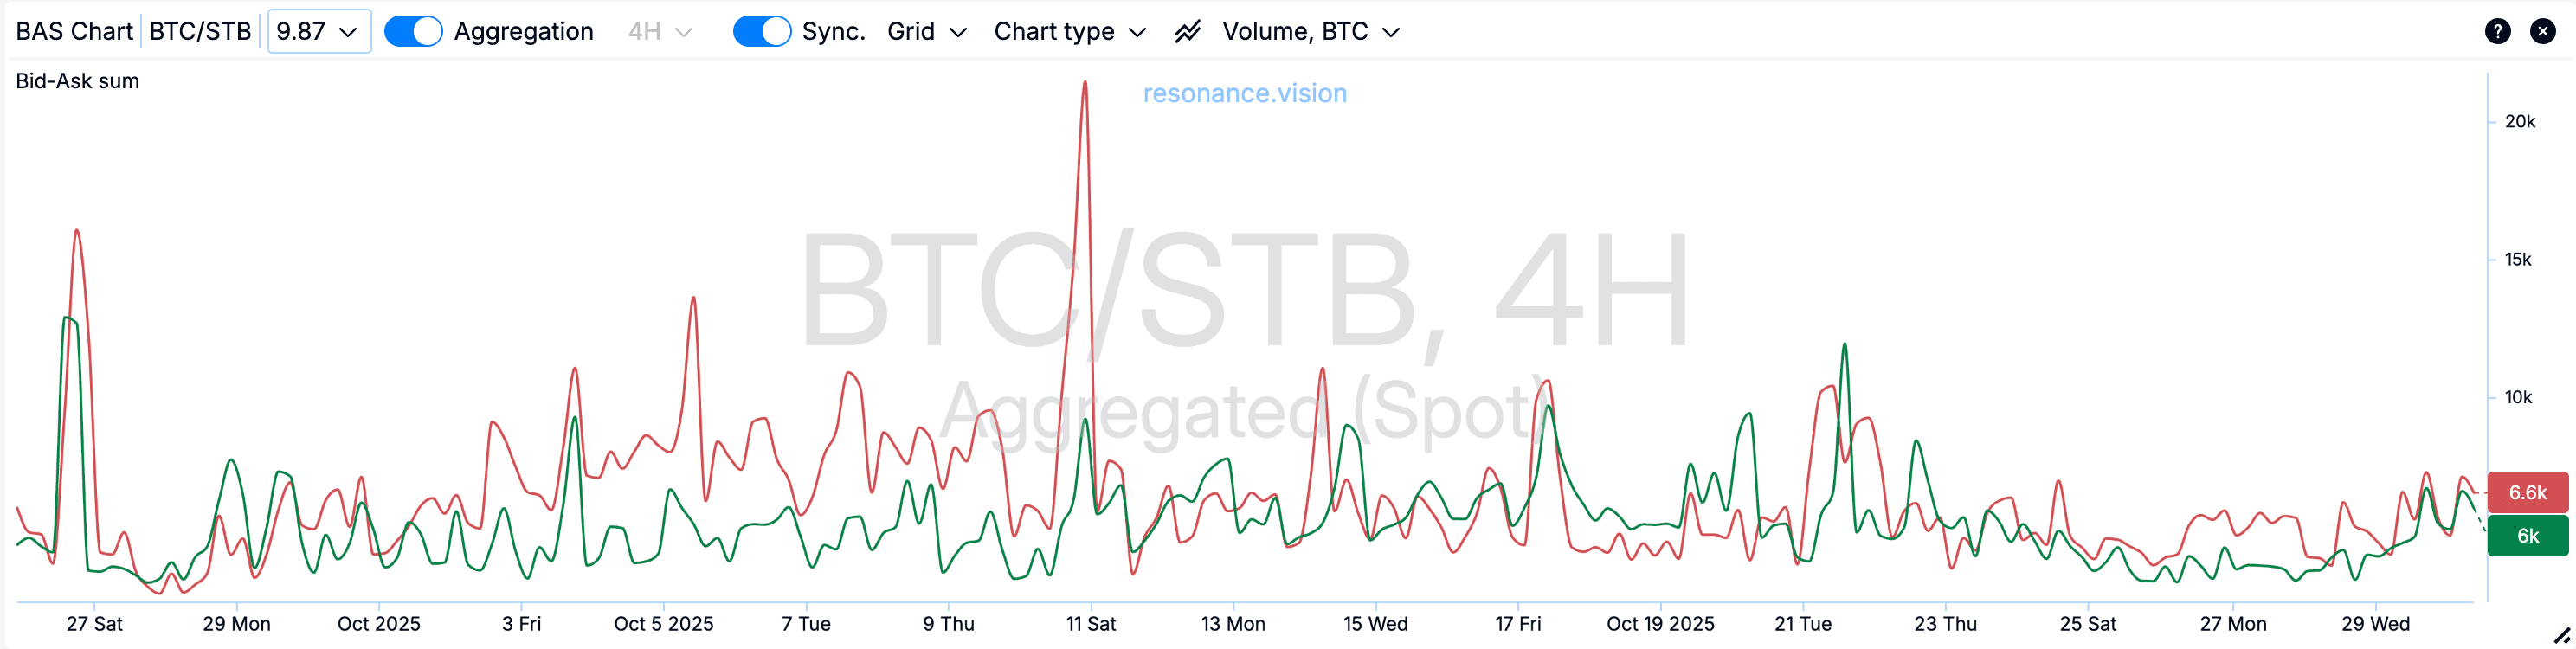
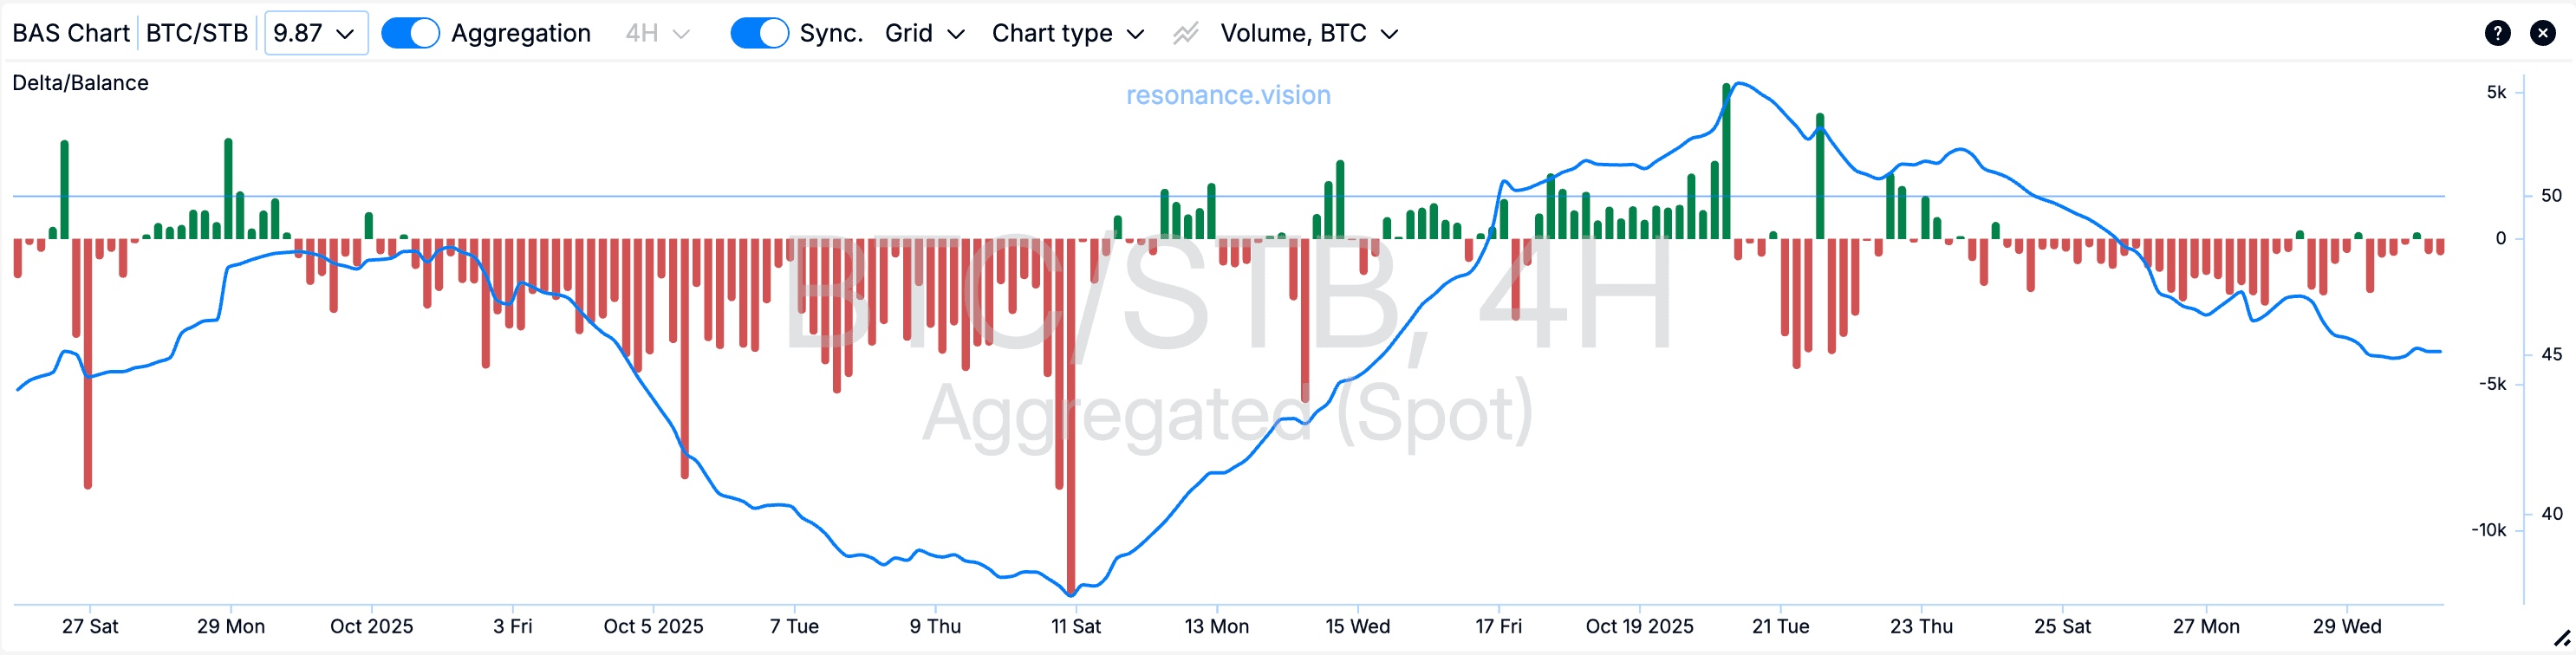
- Delta: The difference and balance between bid and ask volumes, indicating whether the order book is tilted toward demand or supply.
- Z-score: A measure of abnormality. A sharp rise in Z-score signals unusual activity.
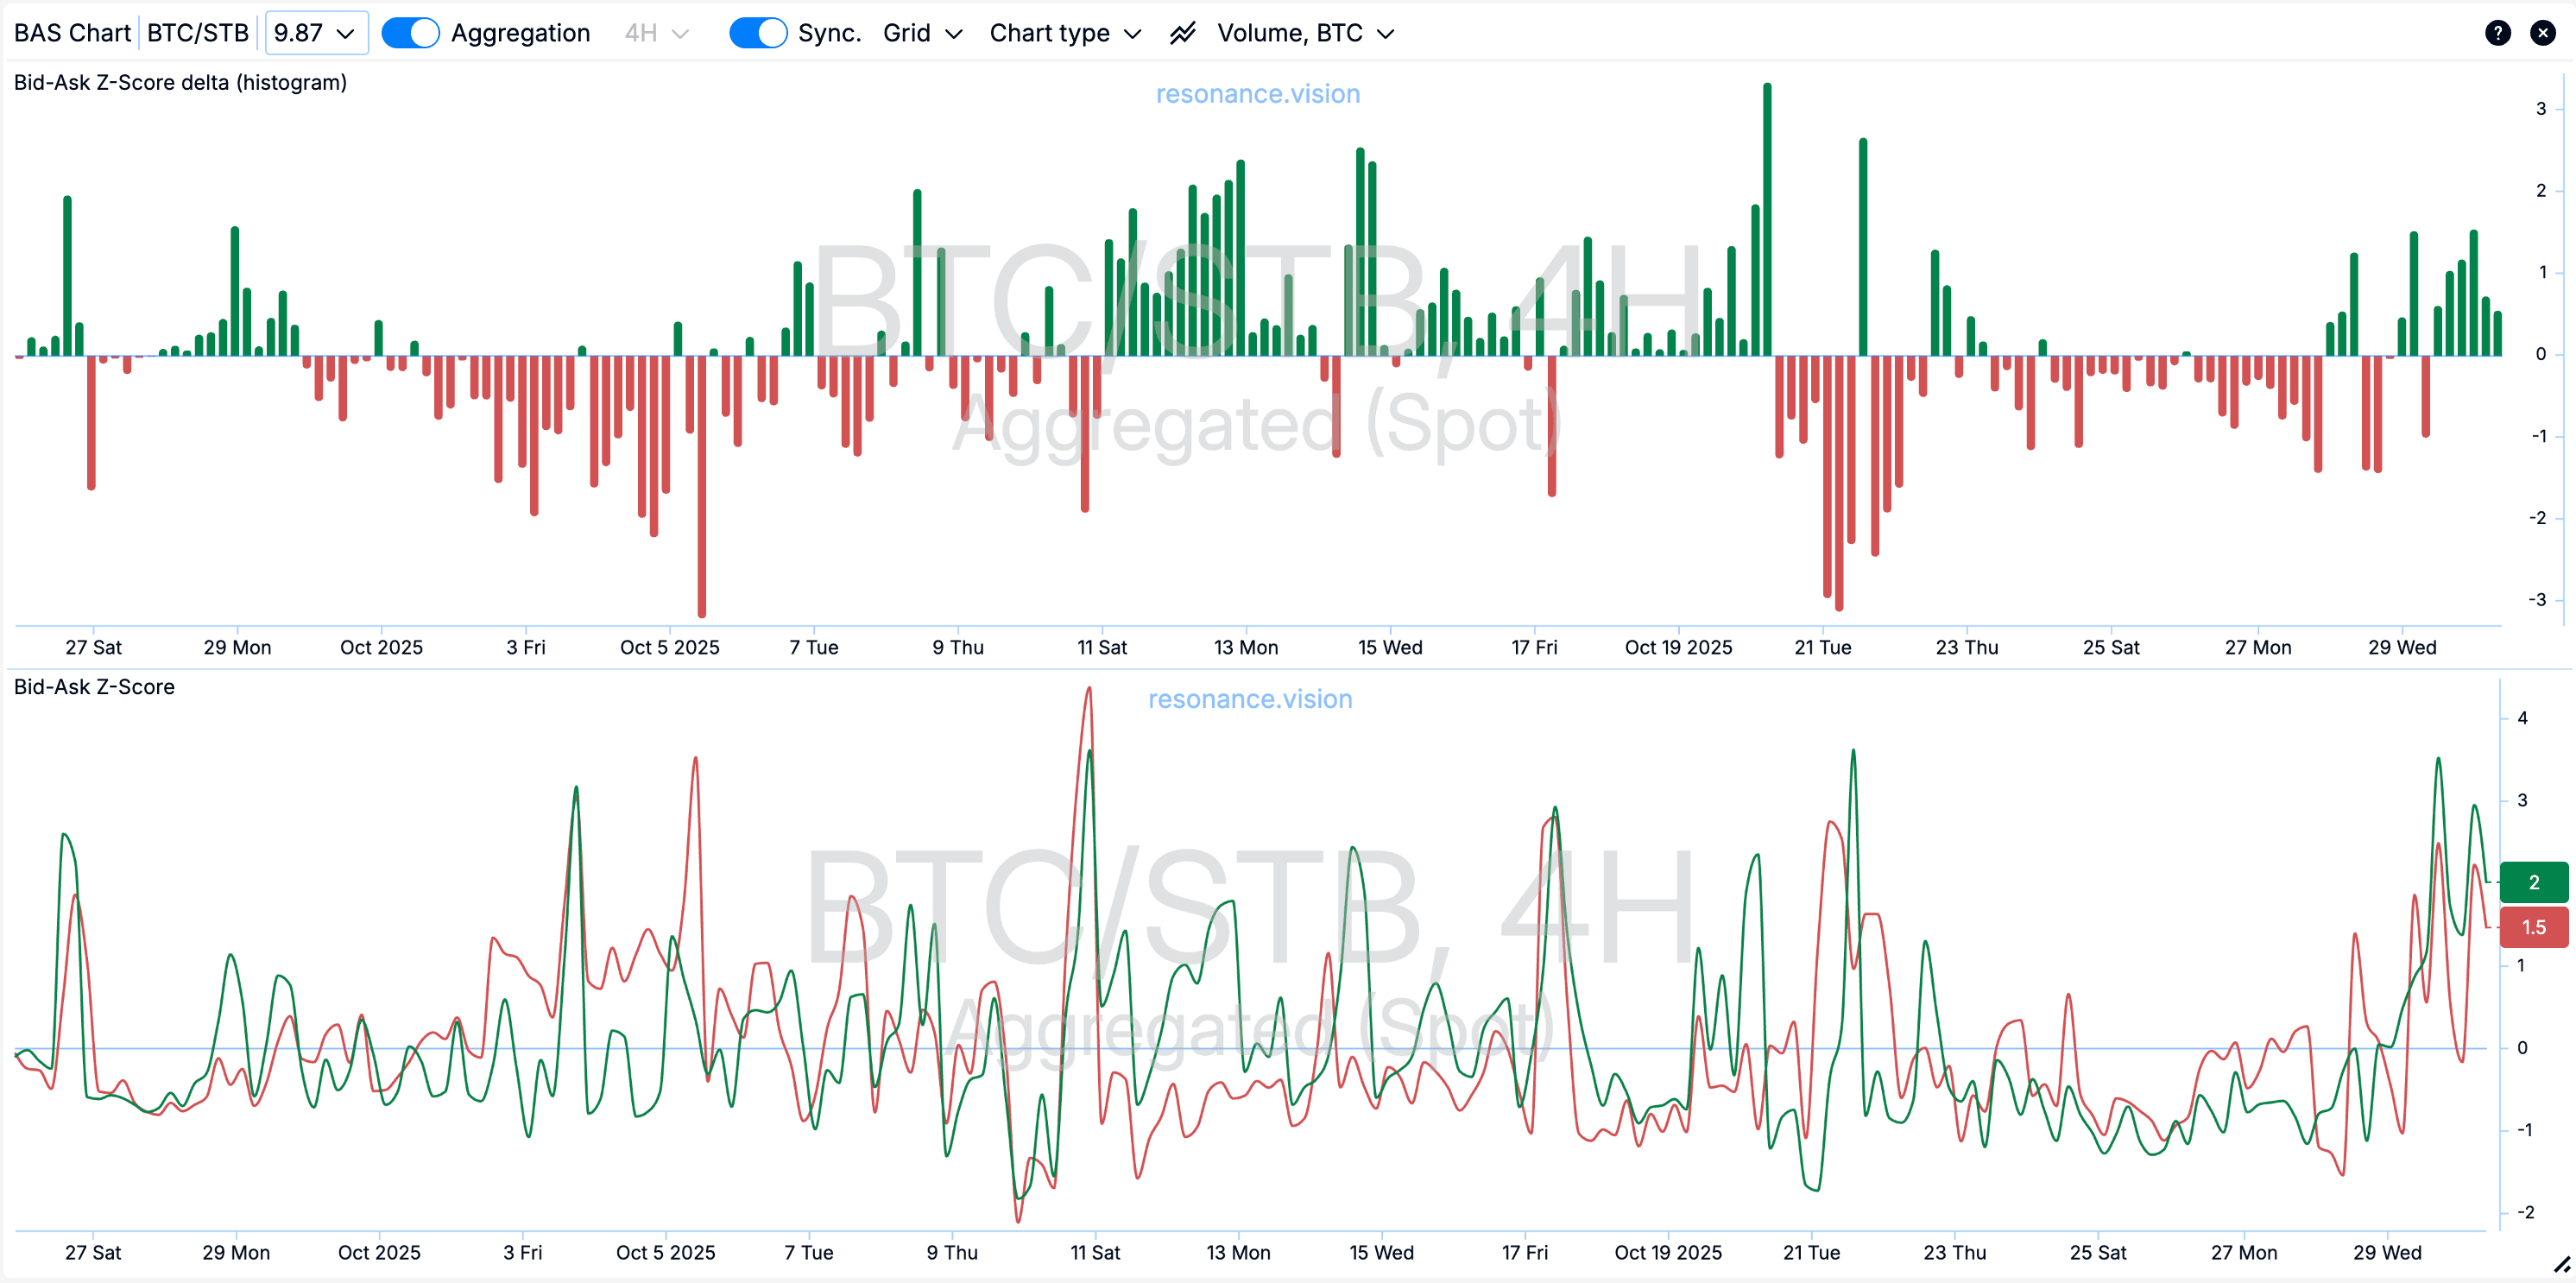
How to Read the BAS Chart:
- Rising Bid Z-score: Passive demand (limit support) is emerging.
- Rising Ask Z-score: Sellers are becoming active (supply is increasing).
- Low values for both: The market is in balance.
Hippo (Heatmap):
Hippo is an additional visual tool that creates a heatmap of limit order concentration. Each “spot” on the map highlights areas where the number or volume of orders spikes. This could be a zone of buyer accumulation or where large players place sell orders.
Hippo helps visualise the dynamics of limit order activity directly on the cluster chart. For example, both BAS and Hippo showed an abnormal increase in buy orders (highlighted in blue rectangles). The price didn’t update lows, and sales didn’t push it down—a sign of a local deficit state, leading to price growth. As we see, the price indeed rose afterward.
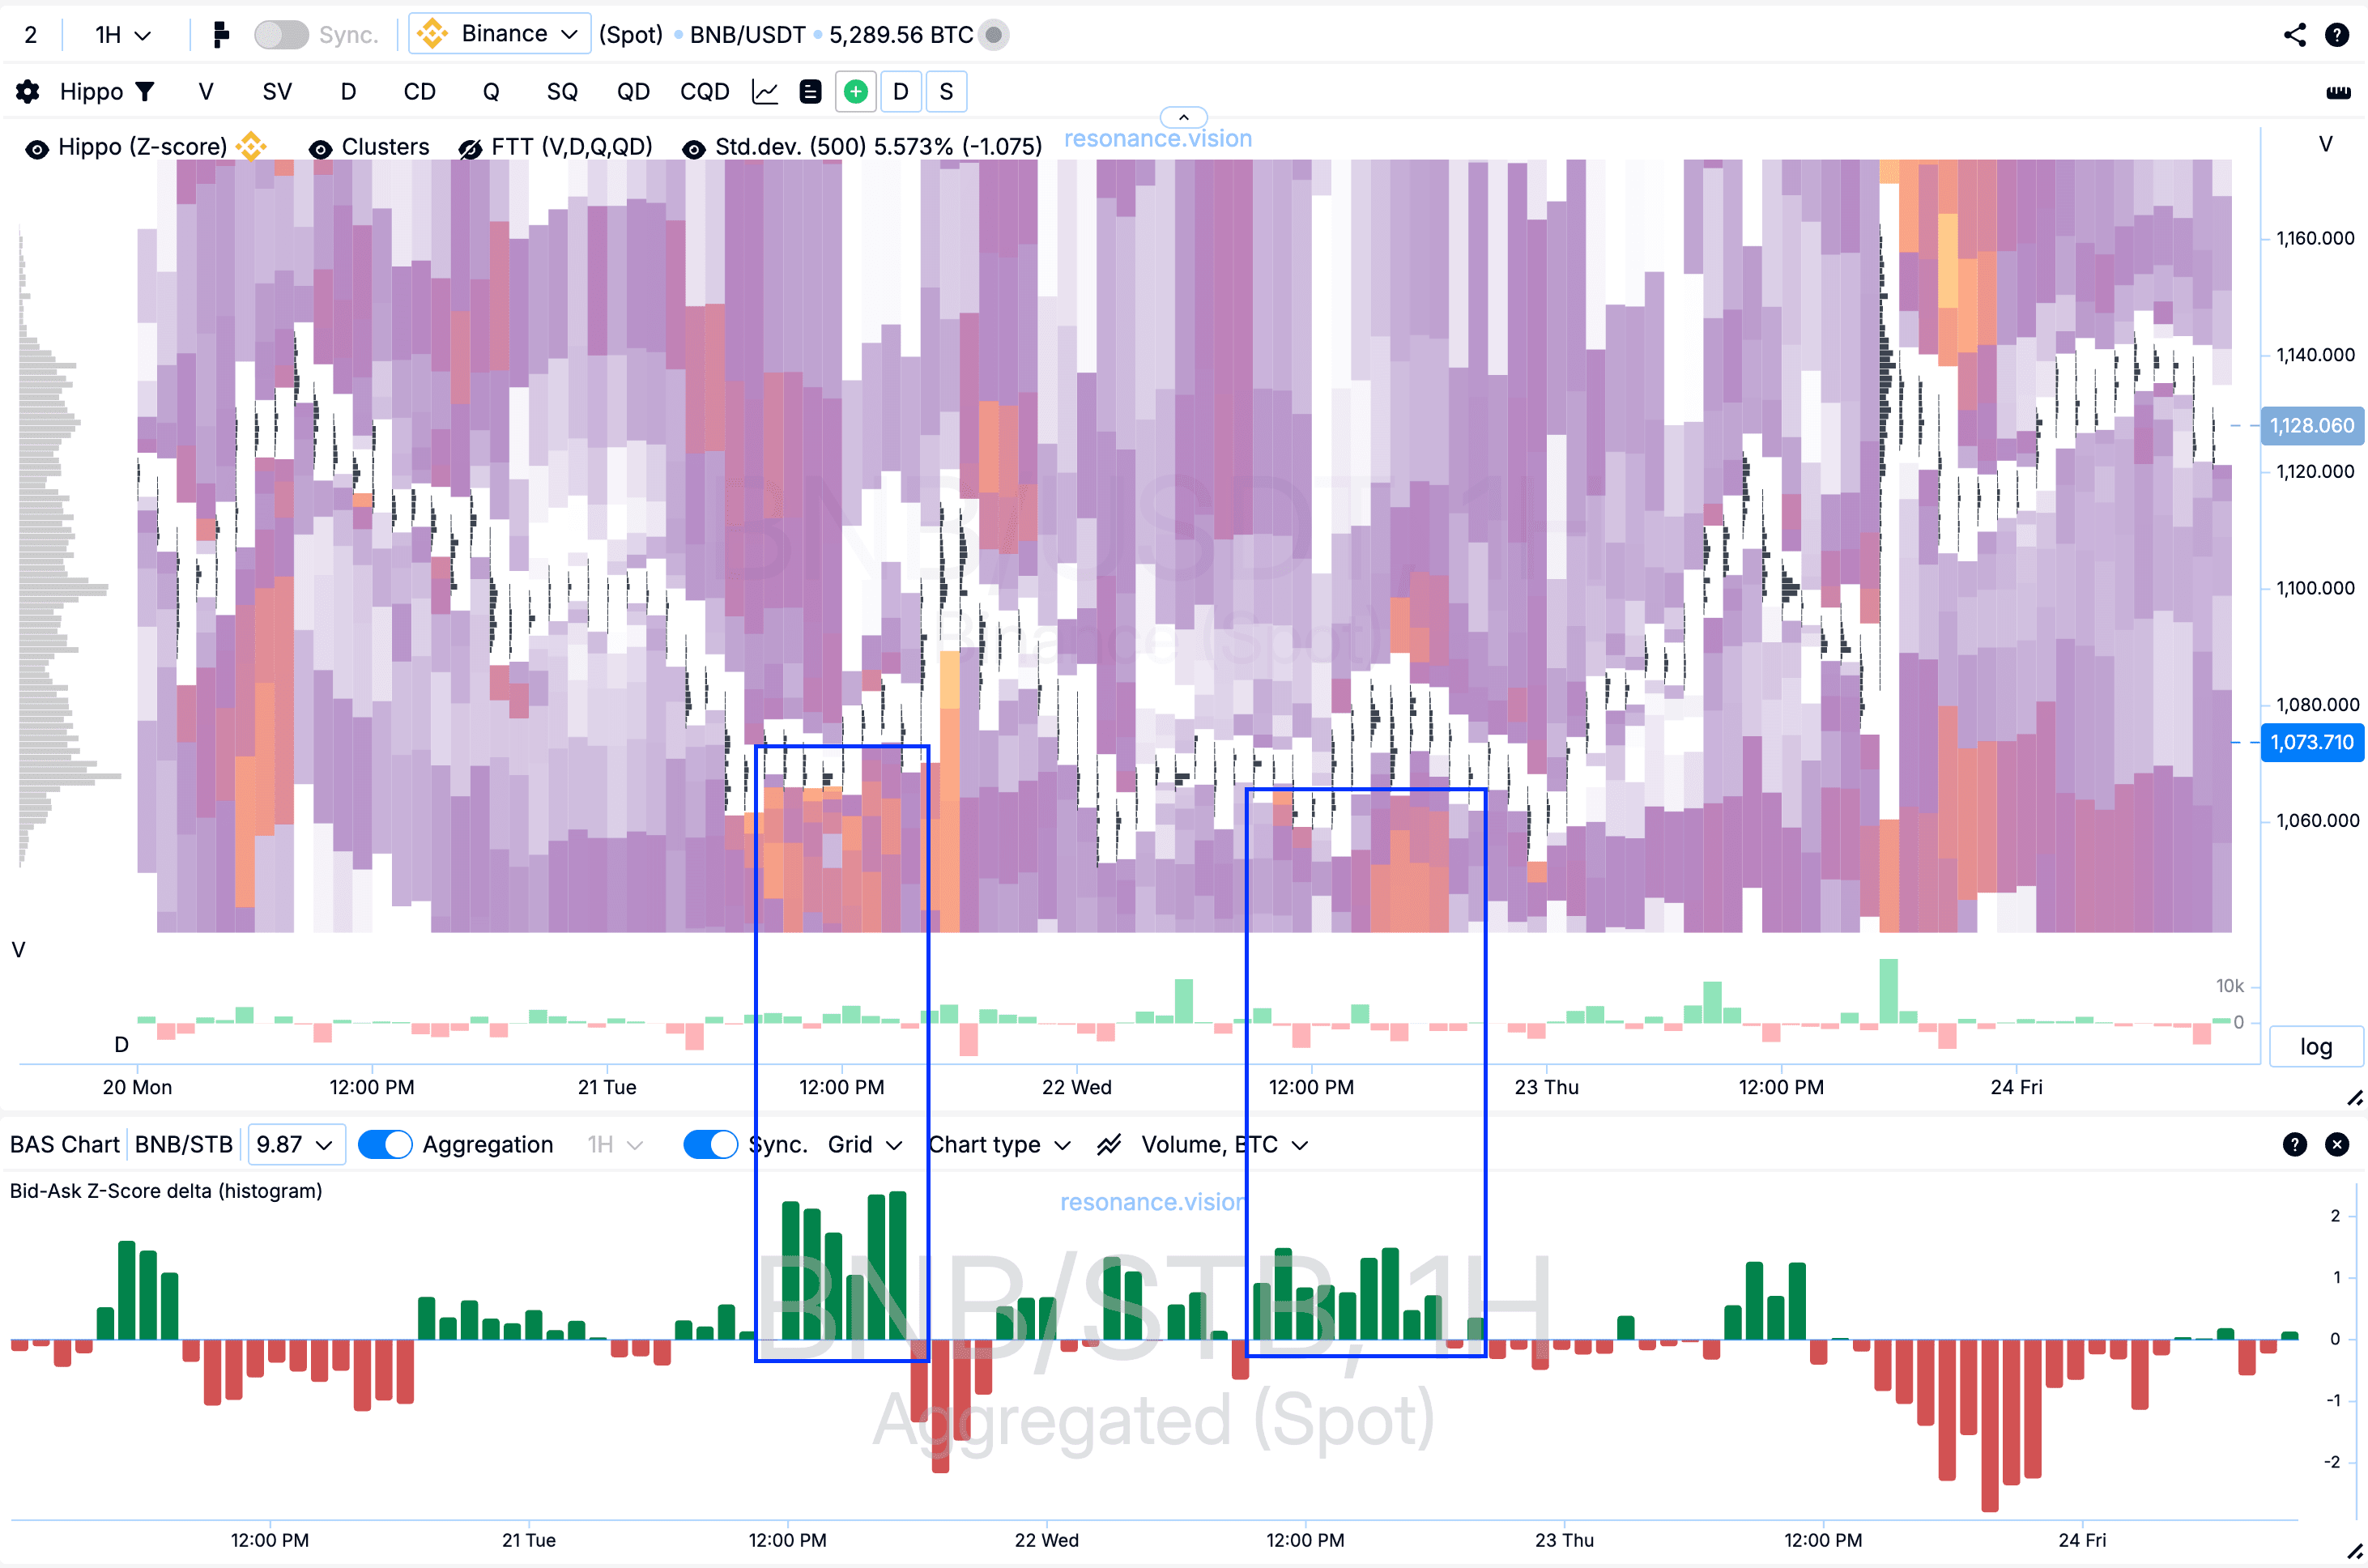
The heatmap highlights zones of limit order concentration in real-time, helping to confirm signals from BAS. Learn more about this tool in the article “Hippo: A Trading Strategy with Limits.”
How to Build Your Own Trading System
To trade effectively, you need to understand the basic principles of order execution and distinguish intentions from actions. Here are some tips:
- Master market mechanics at the “Resonance University”— it explains how prices form, why limit orders don’t always work, and how to analyse limits effectively.
- Learn the basic strategy through Aires’ mini-course — it provides the foundation for understanding the relationship between volumes, limits, and clusters.
- Only then move to analysing cryptocurrency limit orders with BAS, Depth Density (market depth) and Hippo—they make sense only when you grasp the basic logic of supply and demand.
In other words, start with core market principles before diving into analysis and trading. Without a solid foundation, you can’t build a strong strategy.
Conclusions
Limit orders aren’t a trader’s “holy grail” but a tool for observation and additional analysis. They show intentions, not completed trades. Order book trading is inefficient without the ability to assess real executed trades on a cluster chart.
Successful traders analyse supply and demand. Understanding the fundamental principles of market mechanics makes it much easier to analyse price dynamics in crypto.
When analysing:
- Start with the cluster chart—it shows executed trades.
- Then move to limit order analysis to see changes in passive demand and supply in real-time.
- Use Depth Density (market depth) to assess how densely orders are distributed and how much volume is needed to move the price.
- Apply BAS to determine the balance between demand and supply in the order book.
- Support your analysis with the Hippo heatmap to visually identify zones of interest for large players.
These tools, available online on the Resonance platform, allow you to see the market not as random price movements but as a system with logic, structure, and patterns.
Also, **read the article “What Are BID, ASK, and SPREAD in Trading?**” It explains in simple terms how the crypto order book works and the principles of limit order execution.
Follow new insights in our telegram channel.
No need to invent complex schemes and look for the "grail". Use the Resonance platform tools.
Register via the link — get a bonus and start earning:
OKX | BingX | KuCoin.
Promo code TOPBLOG gives you a 10% discount on any Resonance tariff plan.
Recommended articles


