Стратегия торговли по тренду: Как следовать за сильным движением

В этой статье мы разбираем, что такое тренд и как он формируется, объясняем роль объёмов и “умных денег”, а также показываем, как спрос и предложение работают на рынке. Мы поговорим об инструментах определения тренда, о практических подходах к входу и выходу из сделок и о том, без чего не работает ни одна стратегия. Материал подойдёт тем, кто хочет понять механику рынка и научиться использовать стратегию следования за трендом в долгосрочной и внутри дневной торговле.
Содержание

Введение
Есть известная фраза: trend is your friend. И хотя в реальном времени это звучит как шутка, суть в ней верная. Торговля по тренду — это один из самых популярных подходов, потому что позволяет следовать за сильным движением рынка и зарабатывать на импульсах.
На крипторынке это особенно актуально: волатильность здесь выше, чем на традиционных рынках, и умение работать по направлению движения цены часто решает многое. Поэтому торговля по тренду остаётся базовой школой для каждого трейдера, а стратегия следования за трендом дает фундамент для роста и новичкам, и профессионалам. В этой статье вы найдете советы и рекомендации по анализу и исполнению сделок согласно направленной стратегии от Резонанс.
Что такое тренд и его виды
Если спросить у трейдера, что такое тренд, большинство ответит: «направление цены». Формально это верно, но если копнуть глубже, становится интереснее.
Классика технического анализа (точнее теория трендов Чарльза Доу) выделяет три основных вида трендов:
- Восходящий — каждый новый минимум и максимум выше предыдущего.
- Нисходящий — всё зеркально: пики и впадины идут всё ниже.
- Боковой — когда рынок «мечется» туда-сюда, и ясного направления нет.
Именно так систематизировал движение рынка Чарльз Доу. Он первым описал, что глобальный тренд складывается из последовательности минимумов и максимумов.
Важно понимать: то, что мы называем трендом, существует только на истории. Когда мы смотрим на график постфактум, всё кажется очевидным — вот рост, вот падение. Но в реальном времени ситуация сложнее: тренд формируется постепенно, сделка за сделкой, объём за объёмом. Именно поэтому споры о том, “идти ли за трендом”, всегда сводятся к одному — кто и какими объемами этот тренд создает.
И ещё один нюанс: тренд зависит от выбранного таймфрейма. На дневном графике может быть уверенный восходящий рынок, а на минутном — резкие откаты и локальные падения. Получается, что для скальпера и долгосрочного инвестора картинка тренда будет абсолютно разной, и каждый будет прав в своей логике.
Отсюда и пошло понятие “тренд внутри тренда”. Сегодня это называют работой с разными таймфреймами: дневное движение может быть частью недельного восходящего рынка, но при этом коррекцией внутри дня.
Как формируется тренд на самом деле
Если честно, сама идея “тренд — это твой друг” звучит красиво, но в реальности у этого друга есть один подвох: он существует только на истории. Всё, что мы видим на графике, — это уже совершённые сделки. Настоящий тренд в моменте ещё формируется, и понять его можно только по тому, как ведут себя объёмы.
Когда цена снижается на фоне активных продаж — это логично, продавцы давят рынок. Но если в какой-то момент мы видим: продажи идут, а цена перестаёт падать — значит, кто-то активно выкупает это предложение и создаёт дефицит. То же самое работает и наоборот: идут крупные покупки, но цена не растёт — значит, предложение настолько сильное, что оно поглощает спрос.
Таким образом, тренд — это всегда отражение дисбаланса спроса и предложения. Объём торгов криптовалют, а именно дельта (разница между покупками и продажами по рынку) здесь ключевой показатель. Если усилия продавцов перестают приносить результат (снижение цены), значит, покупателей больше и они сильнее. И наоборот.
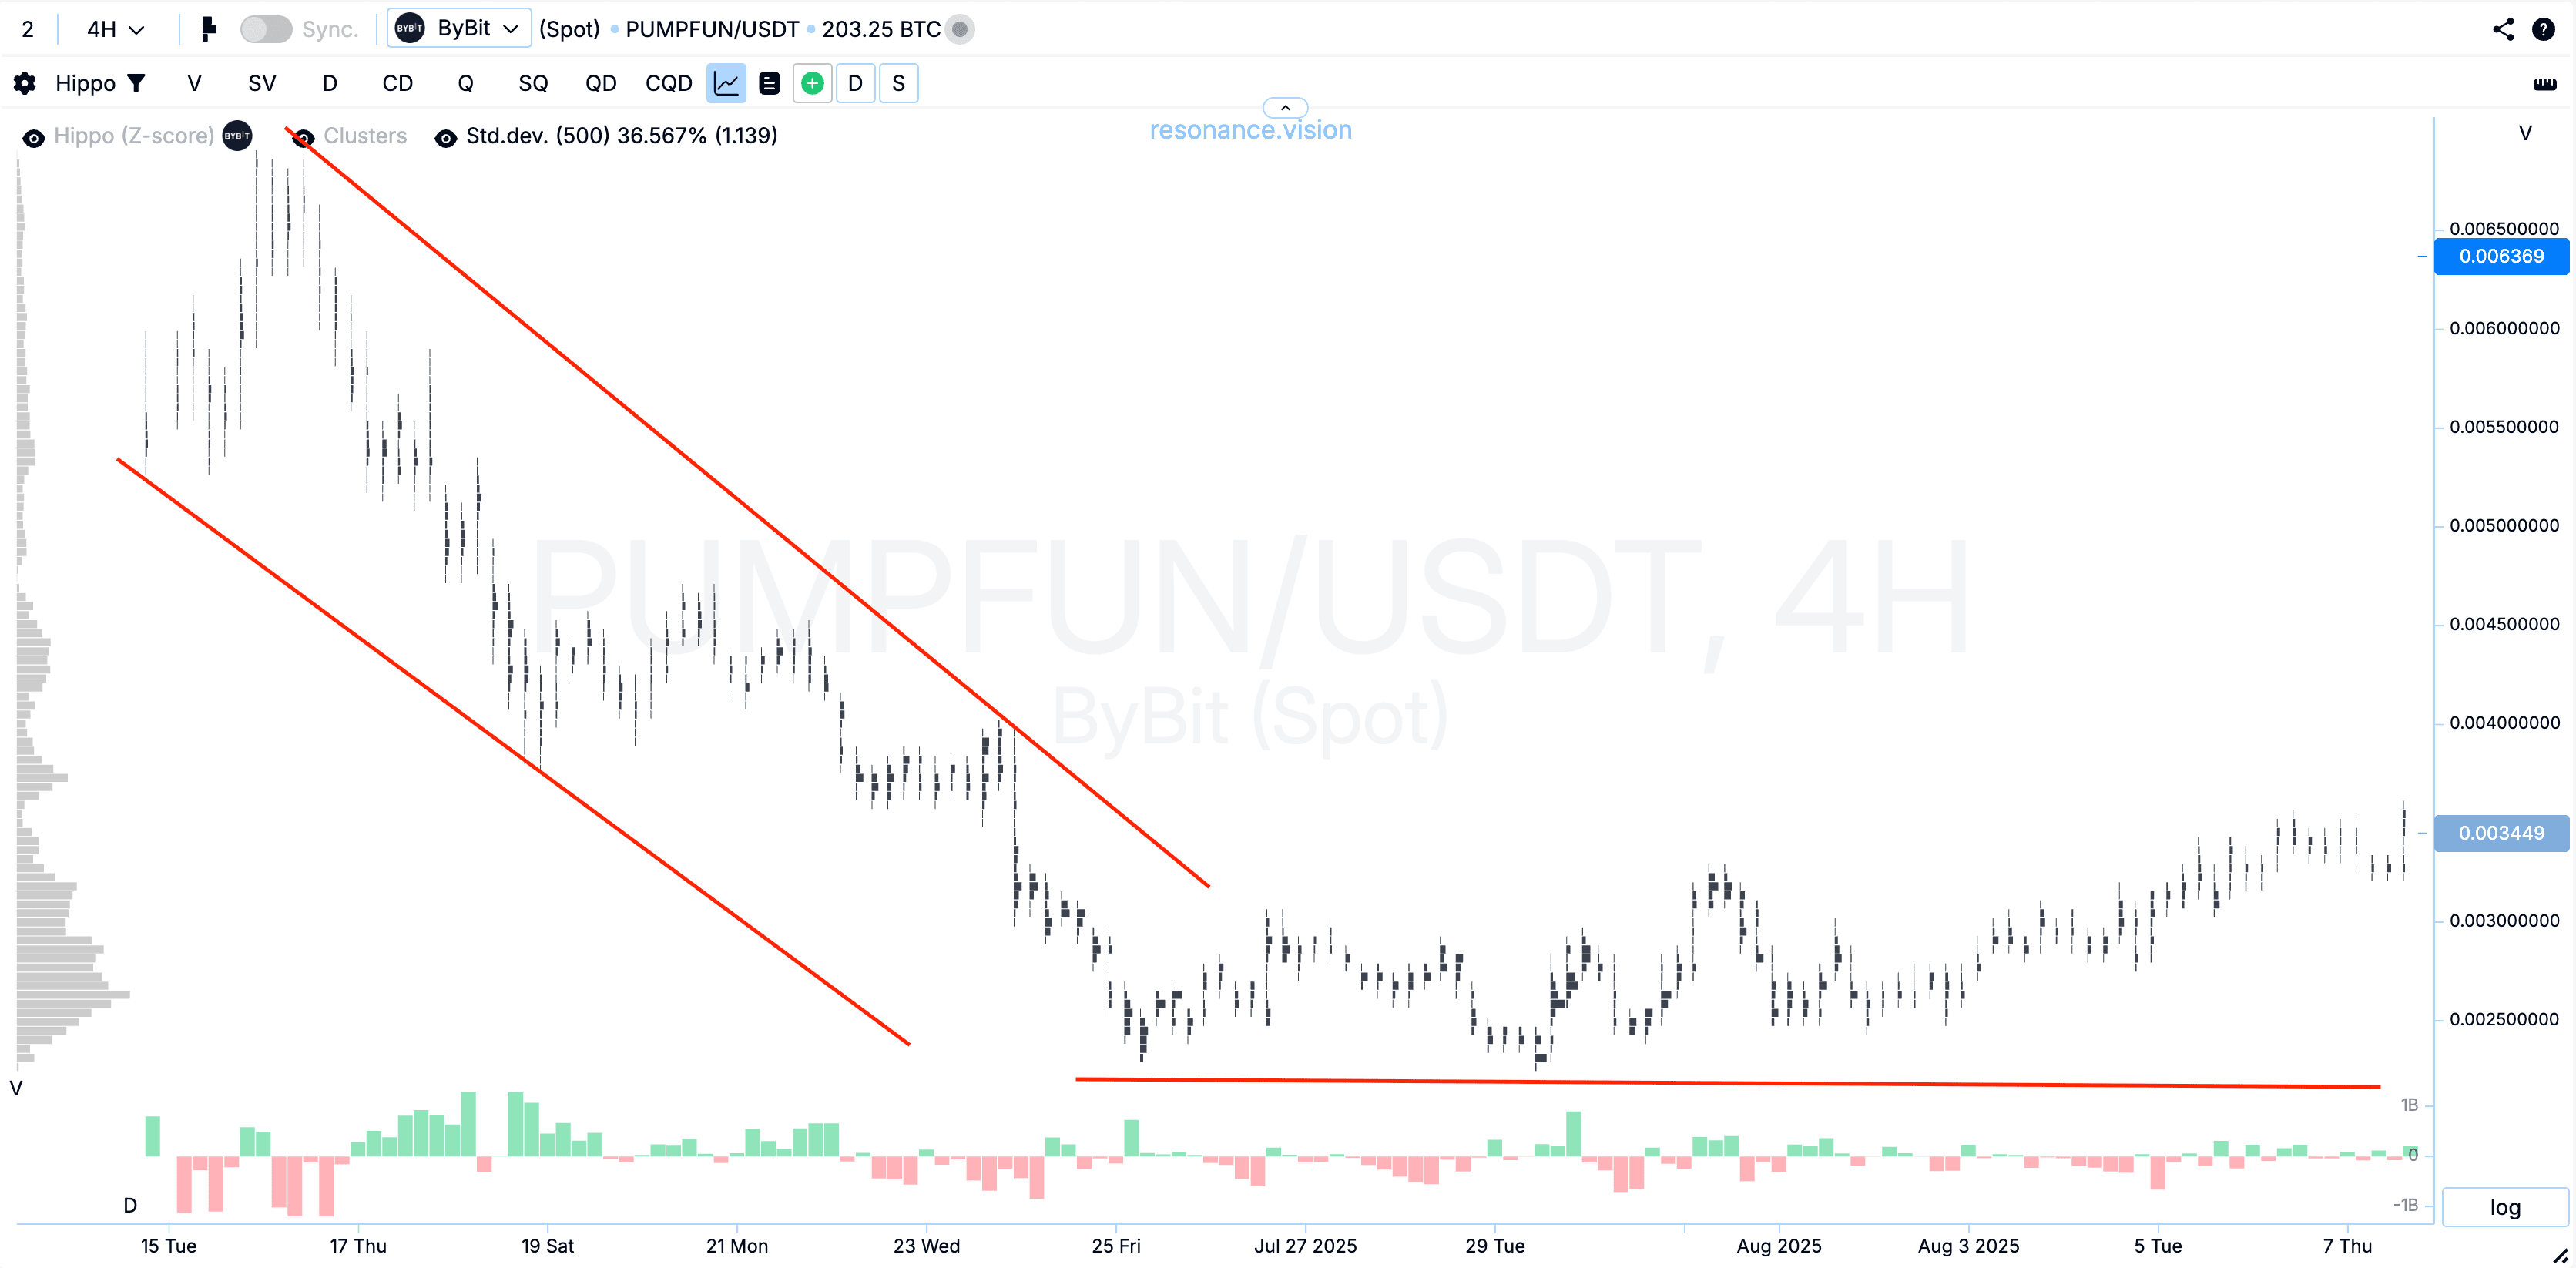
На практике именно такие моменты становятся сигналами смены тенденции. Допустим, у нас нисходящий рынок, каждый минимум ниже предыдущего. Но вдруг появляются большие продажи, а цена остаётся на месте или даже идёт выше. Это явный признак того, что рынок “перестраивается”, и продавцы больше не контролируют ситуацию.
По сути, тренд рождается не из линий на графике и не из красивых индикаторов, а из конкретных действий участников: покупок и продаж, которые меняют баланс сил. Дефицит толкает рынок вверх, профицит — вниз. И если смотреть не на свечной график, а на эффективность влияния объемов на цену, то направление становится очевидным намного раньше, чем вам расскажут на любых курсах по теханализу и смартмани.
Инструменты для определения тренда
Когда трейдеры пытаются понять направление рынка, чаще всего они начинают с самого простого — рисуют линии тренда или торгуют от уровней поддержки и сопротивления. Это действительно полезно, но только как визуальная опора.
Дальше в ход идут индикаторы. Самый распространённый набор:
- скользящие средние (простые, экспоненциальные, с разными периодами);
- MACD, который по сути тоже основан на усреднении цен;
- RSI, который показывает зоны «перекупленности» или «перепроданности»;
- полосы Боллинджера, которые лишь расширяют ту же идею среднего значения.
Но важно понимать: все эти инструменты работают по одному и тому же принципу — они берут цену и пересчитывают ее через разные формулы. Хоть простое среднее, хоть экспоненциальное — всё это просто усреднение. То есть индикаторы тренда не показывают нам ничего принципиально нового, они лишь сглаживают картину и запаздывают относительно реальности.
Например, пересечение скользящих средних часто подают как “сигнал к началу тренда”. Но на самом деле это всего лишь констатация того, что цена уже сместилась вверх или вниз. То же самое с RSI: он выглядит “умным”, но по факту лишь подтверждает, что рынок сильно вырос или сильно упал — то есть опять же, показывает уже свершившееся.
Именно поэтому профессиональные трейдеры не используют индикаторы теханализа. Тренд на графике можно подтвердить лишь объемами, кластерами и дельтой. Это даёт понять, где реально заходили крупные деньги и были ли их покупки/продажи эффективными. Поэтому, кластерный график, тепловая карта, дешборд - ваши маст хев инструменты для успешной торговли.
Вывод здесь простой: правильная оценка тренда всегда строится на том, кто и какими объемами формирует движение.
Роль “умных денег” и толпы
Существует популярный миф: рынок якобы полностью контролируют маркетмейкеры или фонды, которые специально “выбивают стопы” и устраивают манипуляции. На самом деле всё не так линейно.
Да, крупные игроки действительно могут двигать цену. Но крипторынок устроен так, что один участник не способен бесконечно “играть в кукловода”. Почему? Потому что здесь работает арбитраж и жёсткая конкуренция. Если цена на одной бирже завышена — её сразу выравнивают арбитражники на других.
Поэтому “умные деньги” действуют иначе: они работают системно, через большие длительные наборы и распределение капитала. Их цель — не “выбить твой стоп”, а заработать на фундаментальной разнице спроса и предложения.
Совсем другое дело — толпа. Именно поведение толпы создаёт те самые резкие движения, которые кажутся “манипуляциями”. Эмоции играют ключевую роль: страх толкает трейдеров массово закрывать позиции, жадность — врываться в рынок бездумно. И здесь уже неважно, что написано в учебниках. Фактически это живые деньги людей, которые реагируют на новости и свечи на экране.
Поэтому, если упрощать: умные деньги — это системная стратегия торговли, а толпа — это хаос и эмоции.

Дефицит и профицит как основа тренда
Чтобы понять, откуда берётся тренд, нужно вернуться к классическому закону спроса и предложения. Он звучит просто:
- если спрос растёт при ограниченном предложении — цена повышается;
- если предложение увеличивается при слабом спросе — цена падает.
Но на практике этот закон работает тоньше. Дело не только в том, сколько людей покупает или продаёт, а в том, насколько эффективны их действия.
Например, рынок может быть переполнен продажами. Казалось бы, цена обязана падать. Но в этот момент покупатели выставляют крупные заявки на покупку и они выкупают весь поток продаж, цена остаётся на месте. Это и есть проявление дефицита: продавцов много, но они не способны сдвинуть цену вниз. Наоборот, если появляются большие покупки, а цена почти не растёт, значит предложение поглощает спрос — это профицит.
Таким образом, дефицит и профицит — это динамичный процесс перераспределения объемов между покупателями и продавцами. Когда усилия одной стороны перестают давать результат, другая получает преимущество. Именно это и разворачивает рынок, а не сами по себе “уровни” или “фигуры”.
Именно поэтому зоны поддержки и сопротивления работают: они отражают места, где меняется баланс спроса и предложения. Поддержка — это уровень, на котором покупки поглощают продажи и создают дефицит. Сопротивление — точка, где предложение становится сильнее и формируется профицит.
Если упростить: тренд вверх — это череда небольших дефицитных состояний, тренд вниз — последовательность профицитов. А когда одна из сторон перестает быть эффективной, начинается разворот.
Торговля по тренду: вход и выход
В трейдинге нет универсальных советов: точки входа и выхода зависят от стратегии и таймфрейма. Но есть общая логика — торговать в сторону тех, кто реально контролирует рынок (покупателей или продавцов), и правильно управлять позицией.
Один из ключевых приемов — частичная фиксация прибыли. Никто не угадает точный пик тренда, поэтому часть позиции лучше закрывать по мере движения цены. Так трейдер уже фиксирует результат, а оставшийся объём продолжает работать в тренде.
Другой, не менее важный прием — донабор позиции. Когда тренд подтверждается и рынок дает повторный сигнал (например, через проторговку или откат), можно добрать объем позиции. Это позволяет увеличивать прибыль. Но при этом важно сохранять контроль над риском: добрал позицию - нужно перенести стоп-лосс.
Ниже приведены несколько практических подходов, которые чаще всего используют трейдеры.
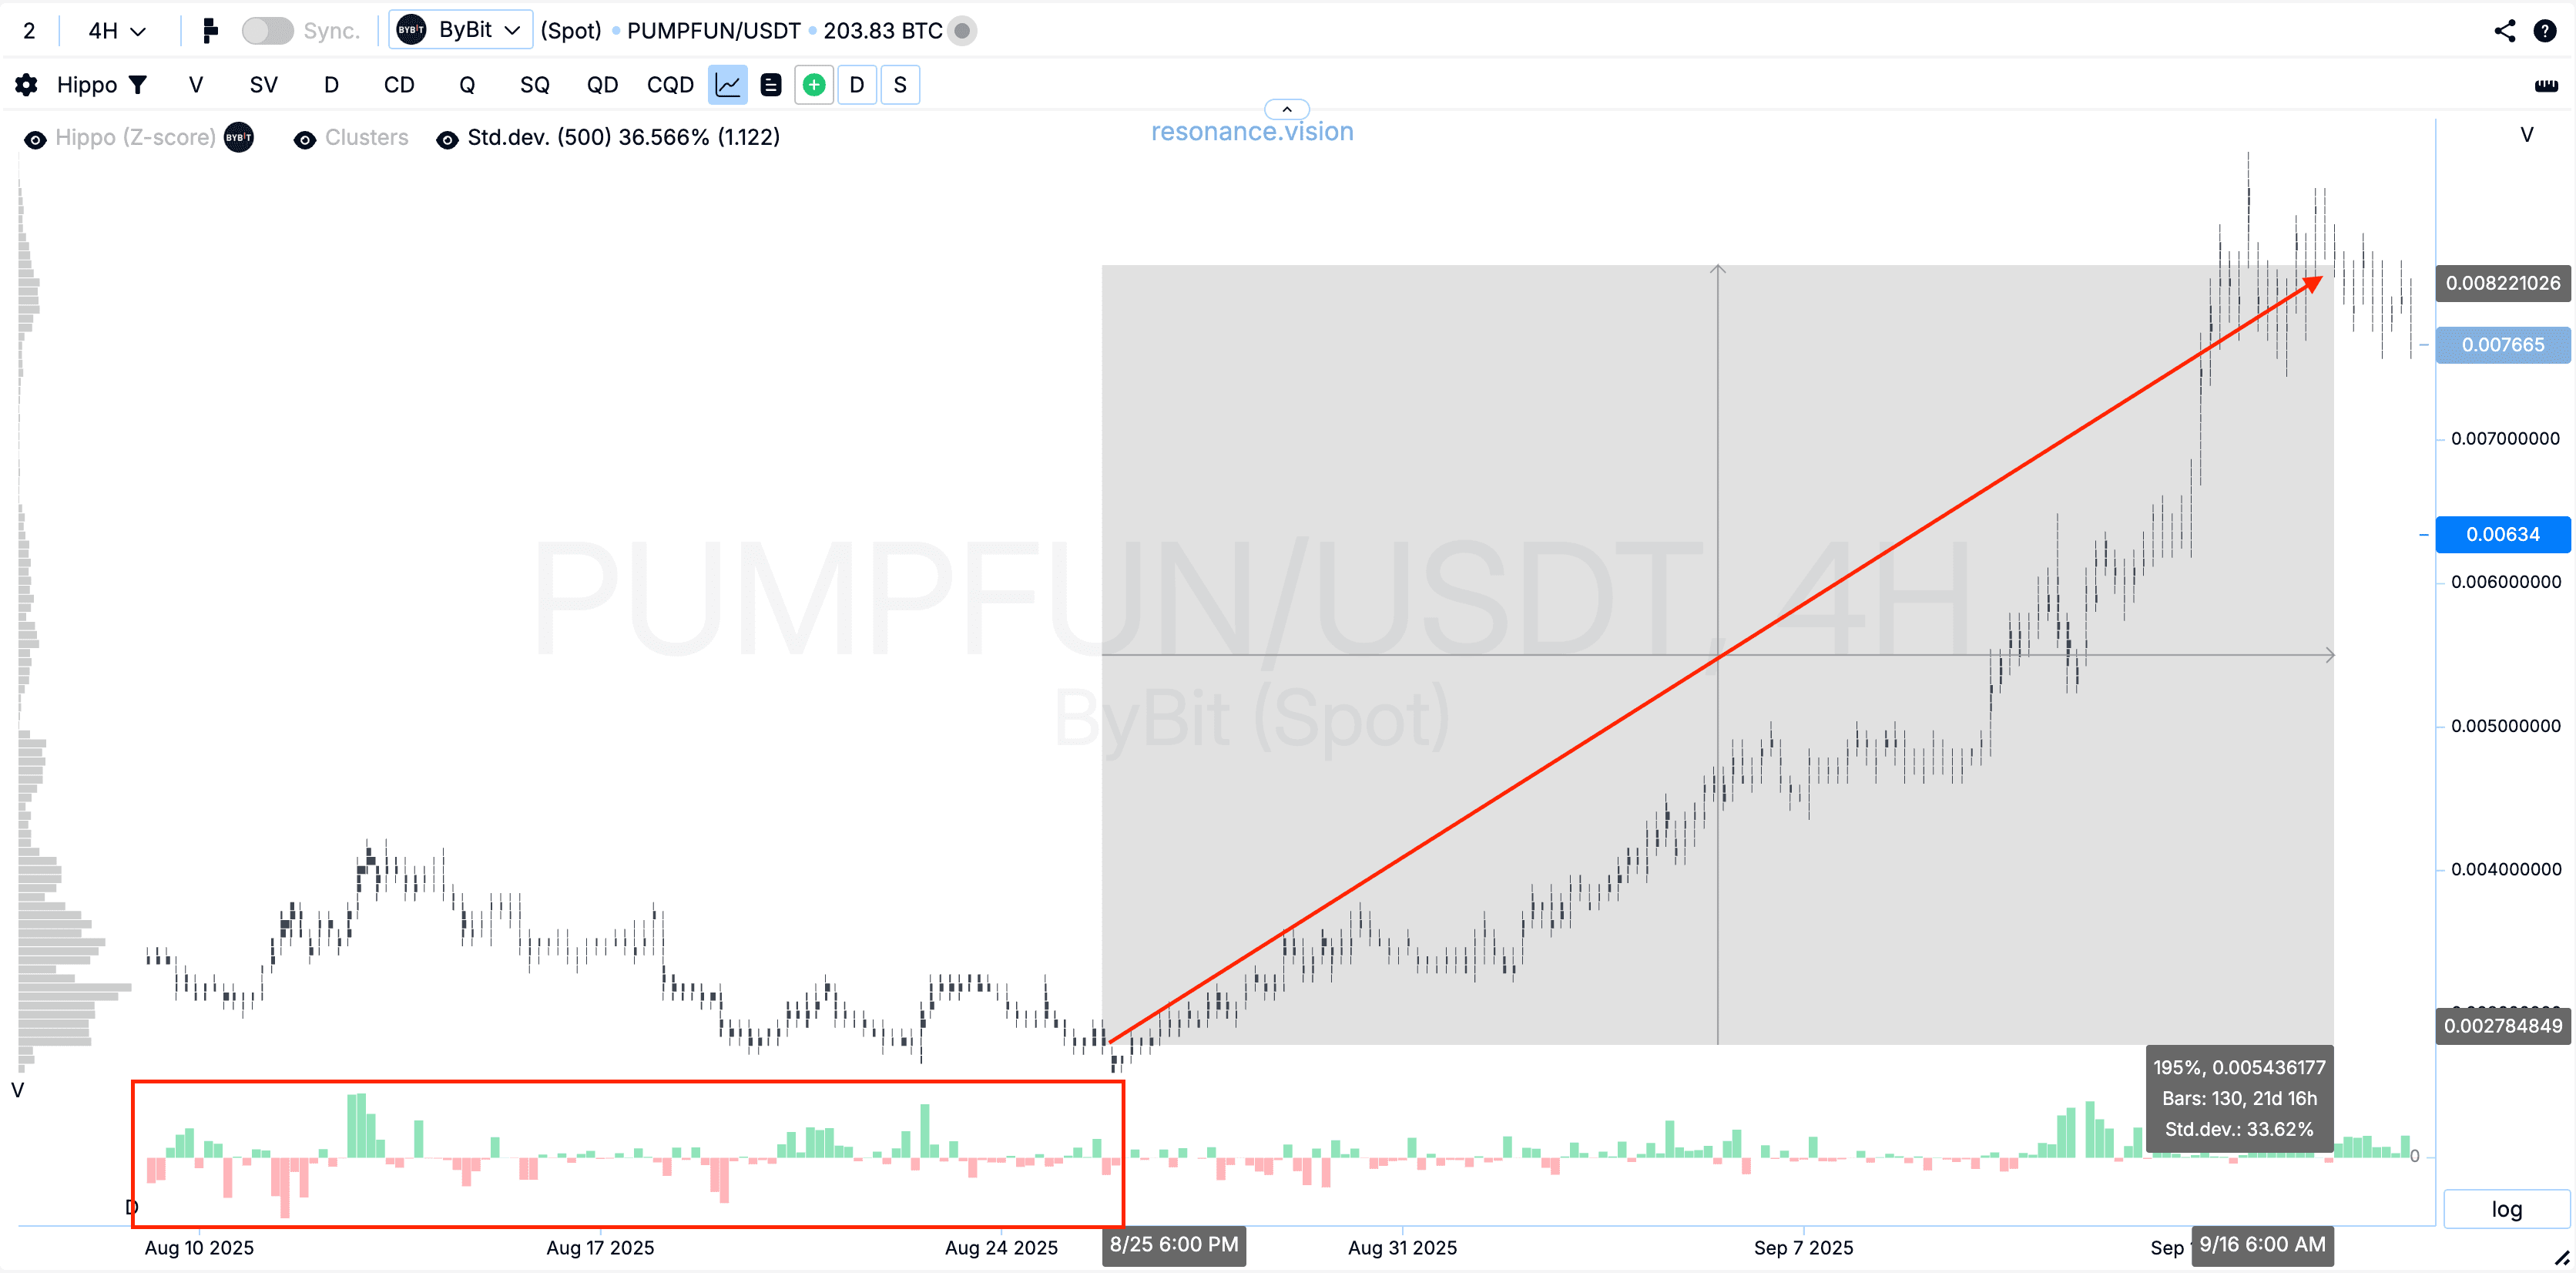
1. Купил и держи
Самая простая модель для долгосрочных инвесторов. Смысл в том, чтобы входить в рынок на стадии подтверждения формирования дефицита и просто удерживать позицию, пока сохраняется рост. Выход — при появлении признаков профицита или смены глобального направления.
2. DCA стратегия
Регулярные покупки небольшими частями, независимо от текущей цены. Такой подход позволяет усреднять точку входа и снижает влияние рыночной волатильности на вашу позицию. Работает хорошо, если уверены в долгосрочном тренде актива.
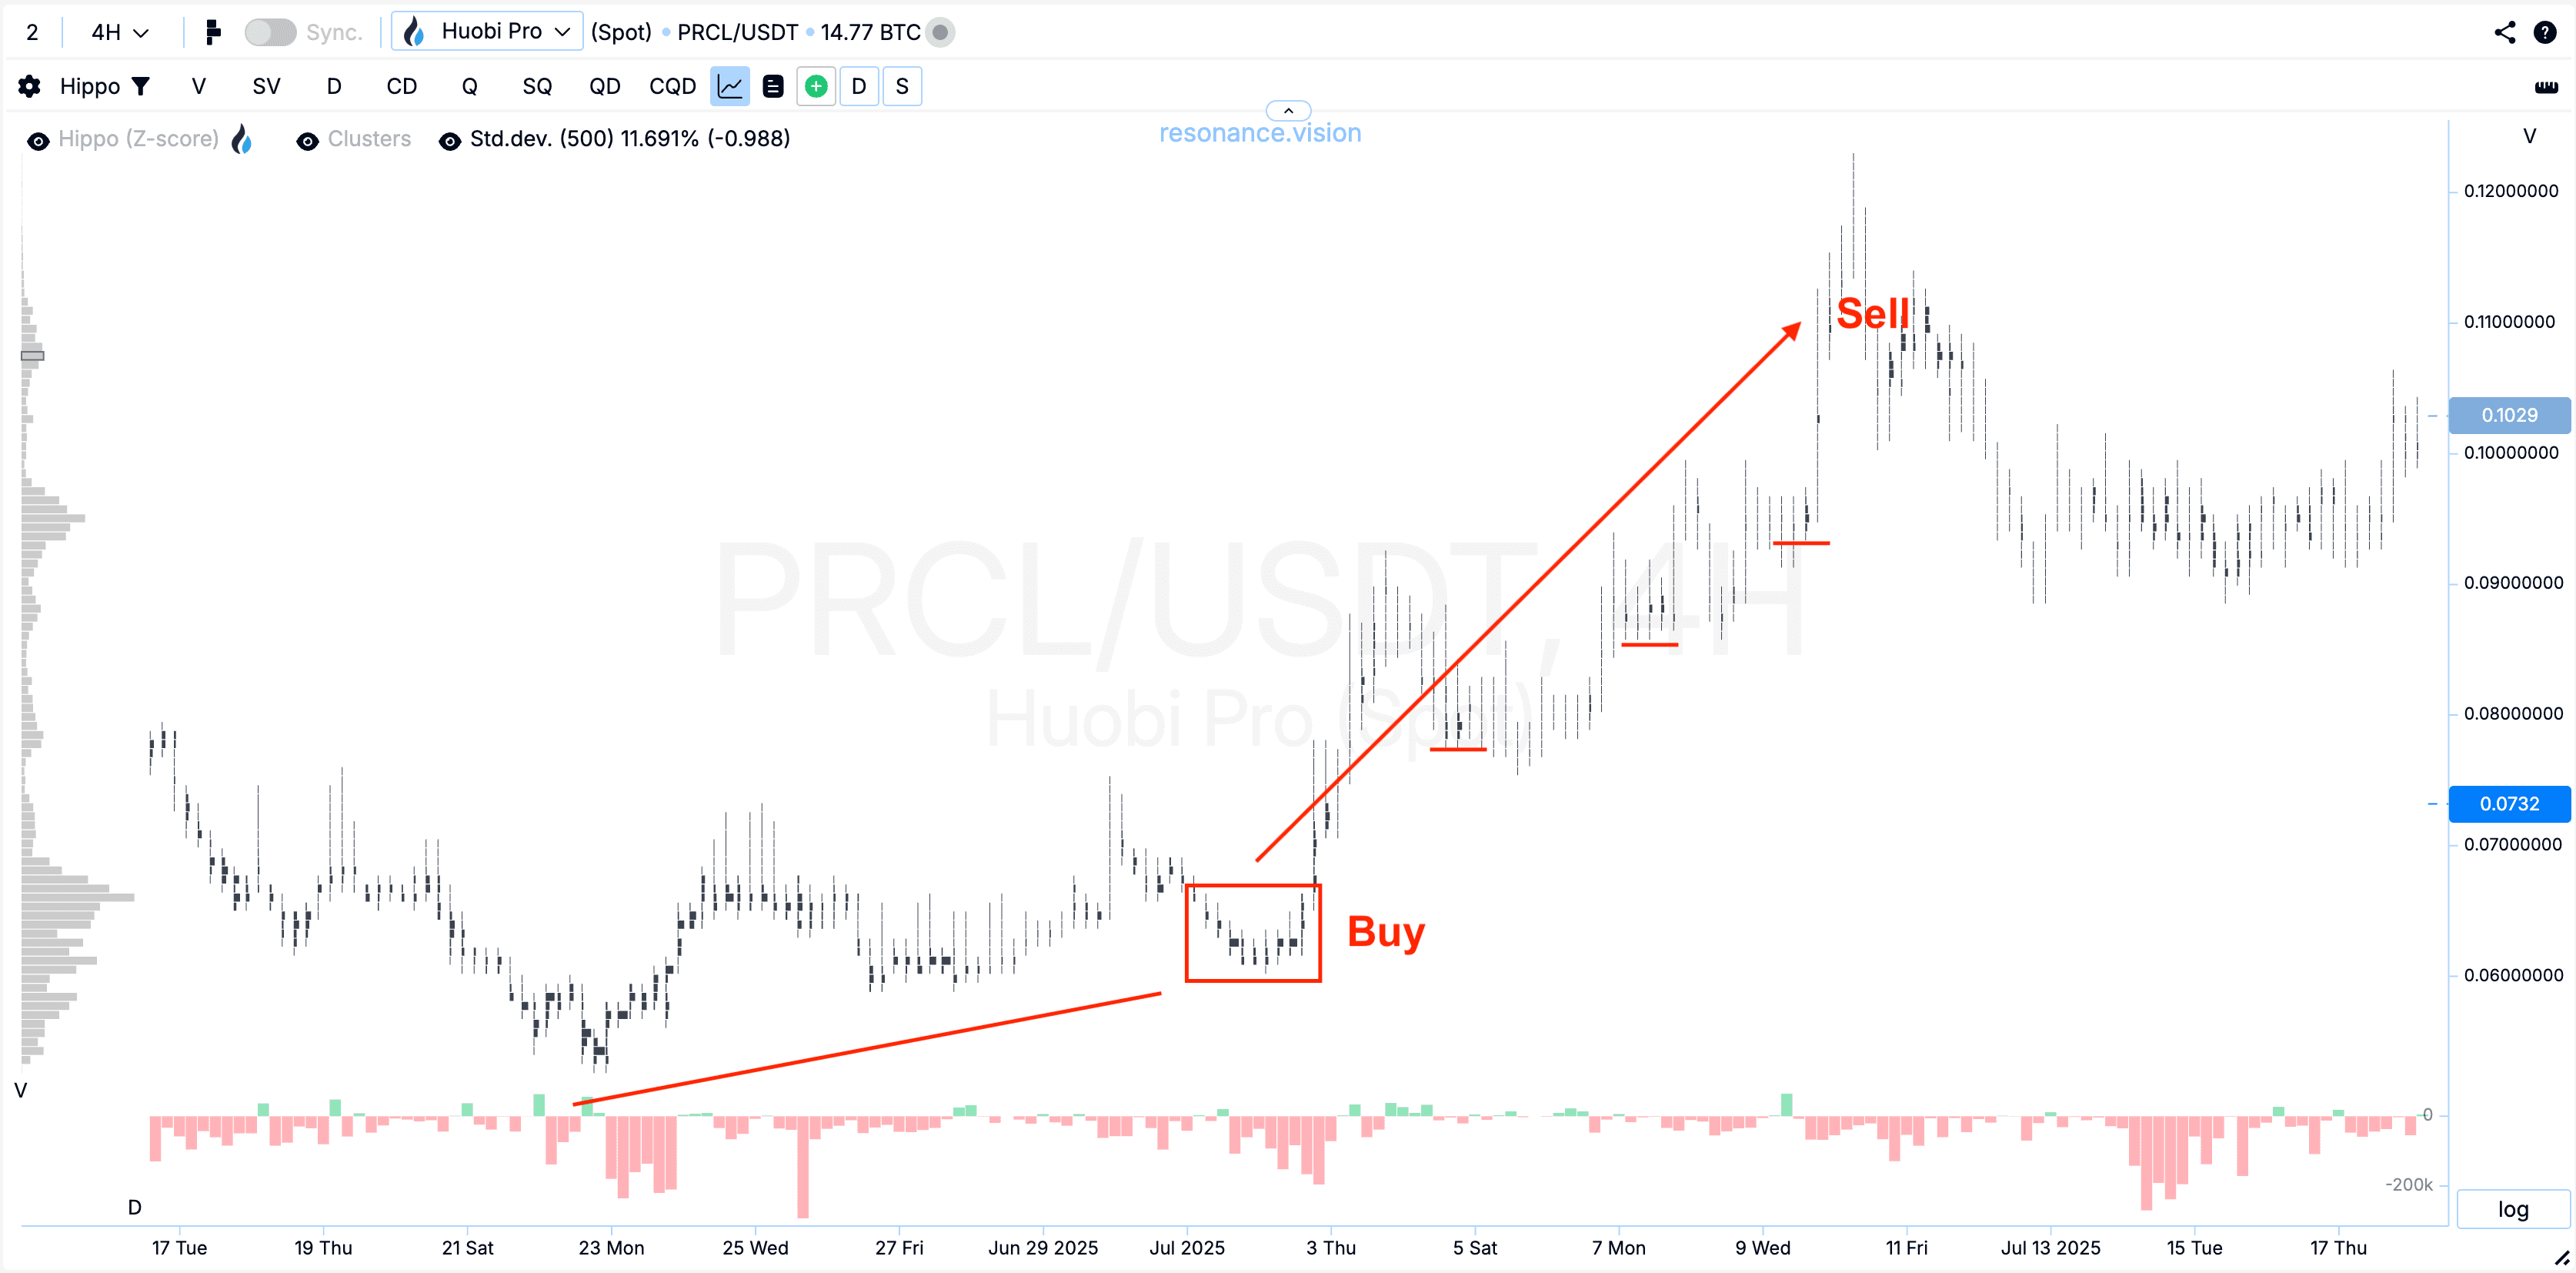
3. Активная торговля “от уровней”
Когда мы говорим “уровень”, важно понимать: это не линия, нарисованная на свечном графике. Это зона, где баланс спроса и предложения меняется.
Если на продажи перестают давить цену вниз — значит, покупатели поглощают всё предложение и создают дефицит. При этом хорошо бы еще увидеть лимитную поддержку покупателей. Вот это и есть правильная точка входа в лонг от уровня поддержки.
Если активные покупки больше не двигают цену вверх — значит, пассивное предложение поглощает спрос,- формируется профицит. Все зеркально к лонговому сетапу. В такой ситуации трейдеры ищут возможность входа в шорт.
Выход из позиции строится по тому же принципу: как только сторона, за которой ты стоишь, перестает быть эффективной, — это сигнал фиксировать профит.
Эти подходы разные по стилю, но их объединяет одно: стратегия следования за трендом. Но не тогда, когда монета уже дала 10Х, а когда рынок только формирует движение и по объемам видно, что одна из сторон теряет эффективность. Это не зависит от подхода к торговле — долгосрочного или внутри дня — смысл один: идти вместе с рынком.
Плюсы очевидны: высокая эффективность, возможность работать вместе с крупным капиталом, понятные правила отбора монет для торговли. Здесь снова помогает правильная тактика: фильтровать сделки и не лезть в рынок, когда нет ясного направления.
Совет: рекомендуем пройти наше мини-обучение направленной стратегии от Resonance, которое будет полезно как новичкам так и опытным трейдерам.
Риск-менеджмент
Без защиты капитала трендовая торговля обречена. Нужно рассчитывать размер позиции и рисковать не более чем 2–3% на сделку.
Главная рекомендация: всегда думай о рисках раньше, чем о прибыли. Даже самая правильная стратегия торговли не спасёт, если ты входишь по принципу “всё или ничего”.
Больше о расчете размера позиции можете почитать в статье “Стратегия важна, но риски важнее”
Заключение
Стратегия торговли по тренду — это не волшебная кнопка, а системный подход. Она работает тогда, когда трейдер понимает, за счёт чего формируется движение: спрос, предложение, эффективность объёмов. И именно это отличает тех, кто идет вместе с рынком, от тех, кто гонится за “картинкой на графике”.
Следование за трендом значит вовремя увидеть в объемах, что одна из сторон теряет контроль, и войти в рынок тогда, когда у тебя есть преимущество. При этом важно соблюдать простые правила:
- искать правильные точки входа там, где есть дефицит или профицит;
- использовать частичную фиксацию и донабор позиции, чтобы максимально эффективно сопровождать сделку;
- не игнорировать риск-менеджмент, потому что он — основа любой стратегии, даже самой прибыльной.
Следи за новыми статьями в нашем телеграм канале.
Не нужно выдумывать сложных схем и искать “грааль”. Используй инструменты платформы Resonance.
Регистрируйся по ссылке — получай бонус и начинай зарабатывать:
OKX | BingX | KuCoin.
Промокод TOPBLOG дает тебе 10% скидки на любой тарифный план Resonance.
Рекомендуемые статьи