Lots of Buying Is Not an Edge: 3 Crypto Charts Explained

Three moments from market history, with the coin and date hidden. Each comes with a question — which phase is it, and who dominates? — then a three-step breakdown and what happened next.
Table of contents






Three moments from market history, with the coin and date hidden. Each one comes with a question. Answer it to yourself, then open the answer.
How to read a chart: three steps
- Phase — accumulation, uptrend, distribution or downtrend: where the coin is in the cycle. How to tell them apart — in the article on market phases.
- Who dominates — buyers or sellers; this is what delta shows.
- Pressure efficiency — whose trades move the price more for their volume. It is the band under the delta on the cluster chart: above zero, buying has the edge; below zero, selling does.
Example 1: a big rally, then sharp swings at the top
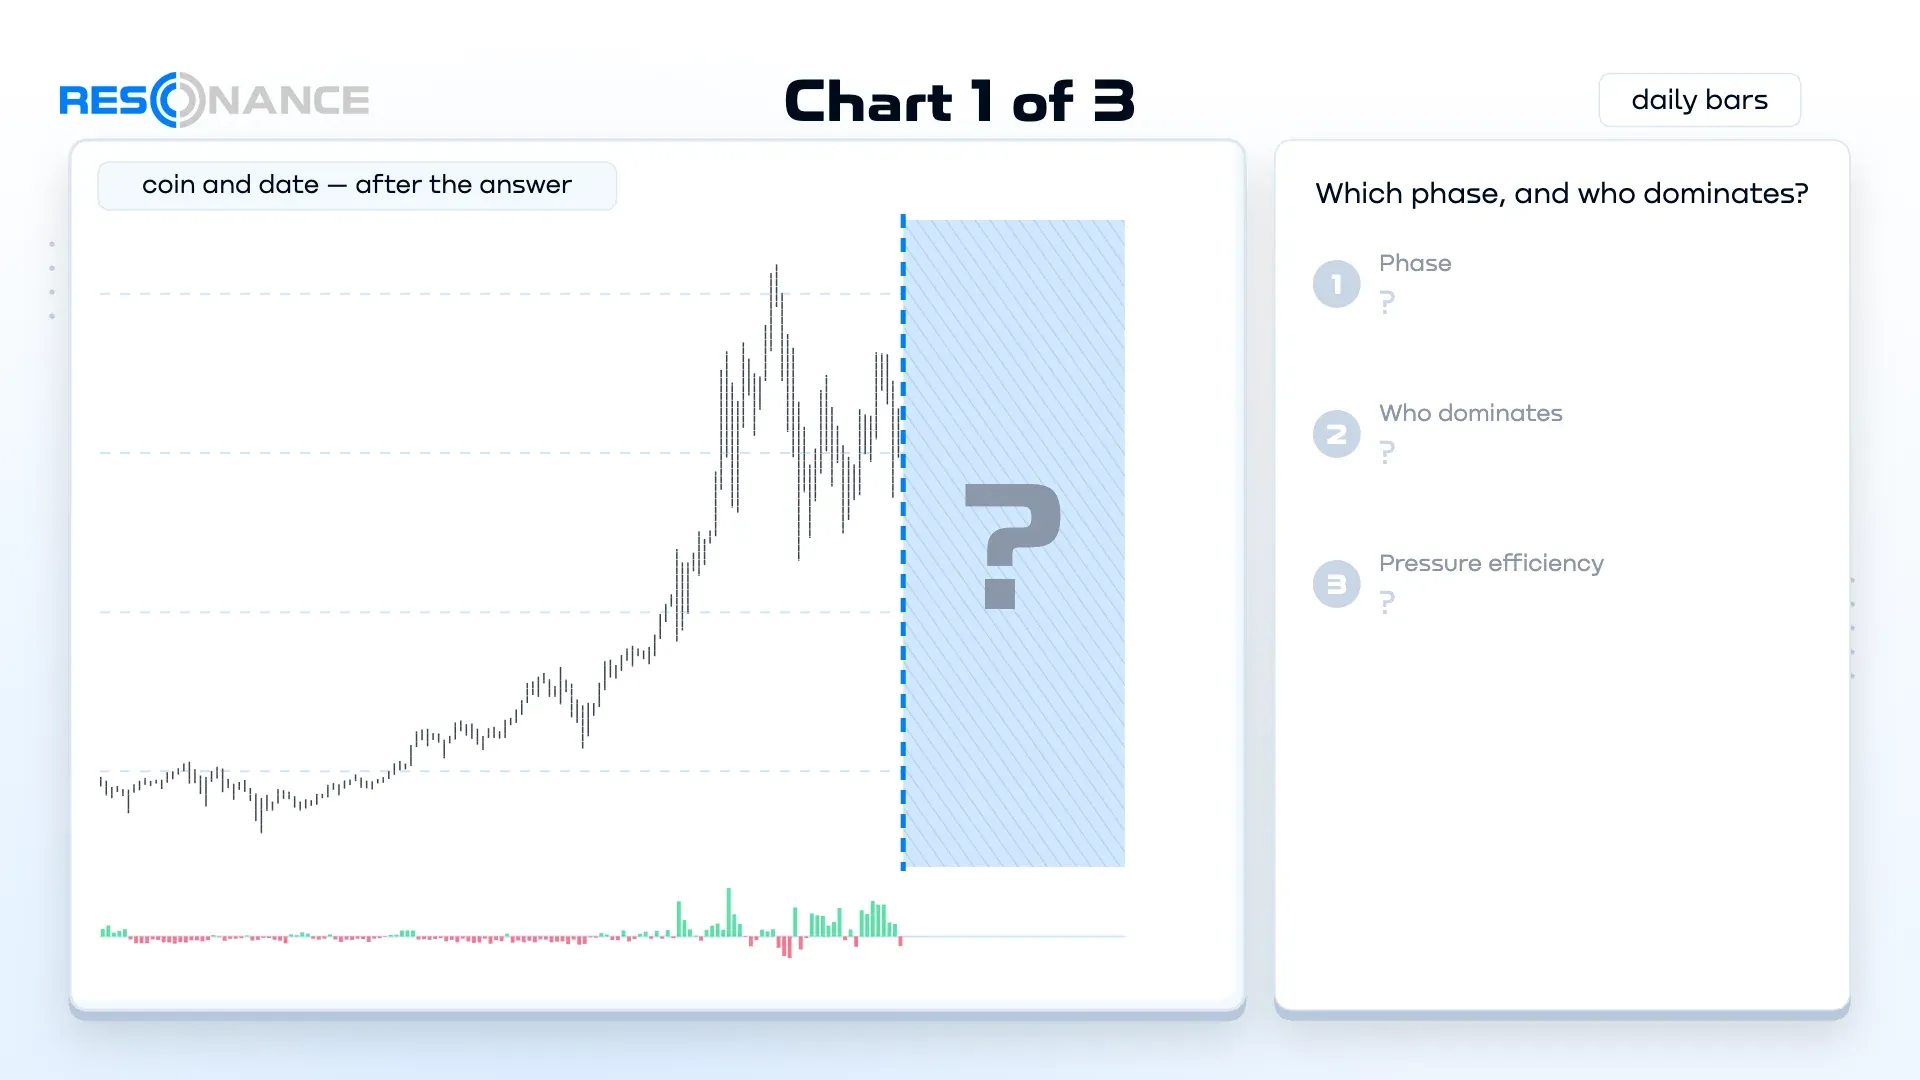
Which phase is this — and who dominates here?
Show the answer
BTC/USDT, Binance, daily bars, January 9, 2018.
Step 1. Phase. Distribution, day 24: a wide sideways range after a big rally.
Step 2. Who dominates. Delta was positive on four of the last five days, and over the whole phase buying made up more than two thirds of the volume. At first glance, buyers look stronger.
Step 3. Pressure efficiency. This is the key part: over the phase the band stays near zero — above zero on 10 days out of 23, and slightly below it in the last days. There was a lot of buying, but it gave no edge: the price did not follow the buying.
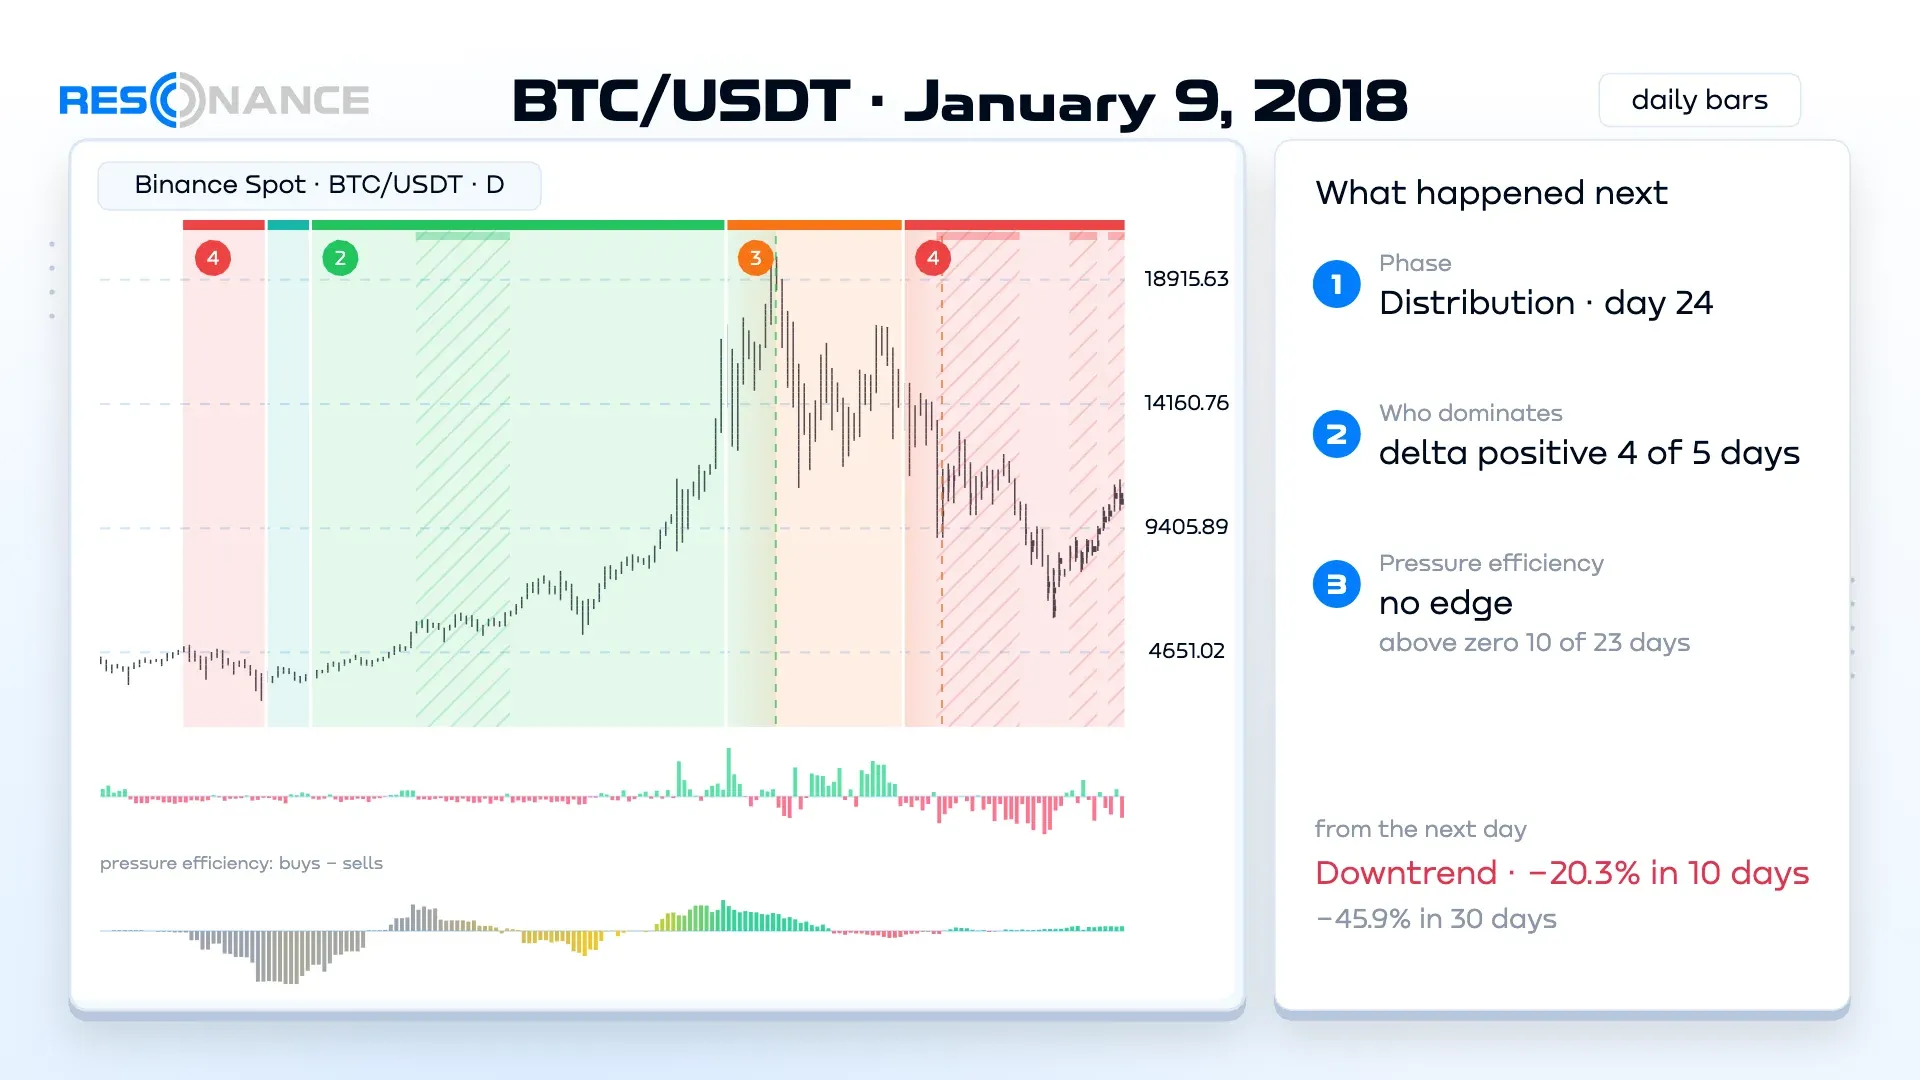
What happened next. A decline started the next day: −20.3% in 10 days and −45.9% in 30.
The lesson: lots of buying is not an edge yet. Look at whose trades move the price.
Example 2: a long sideways range after a rally
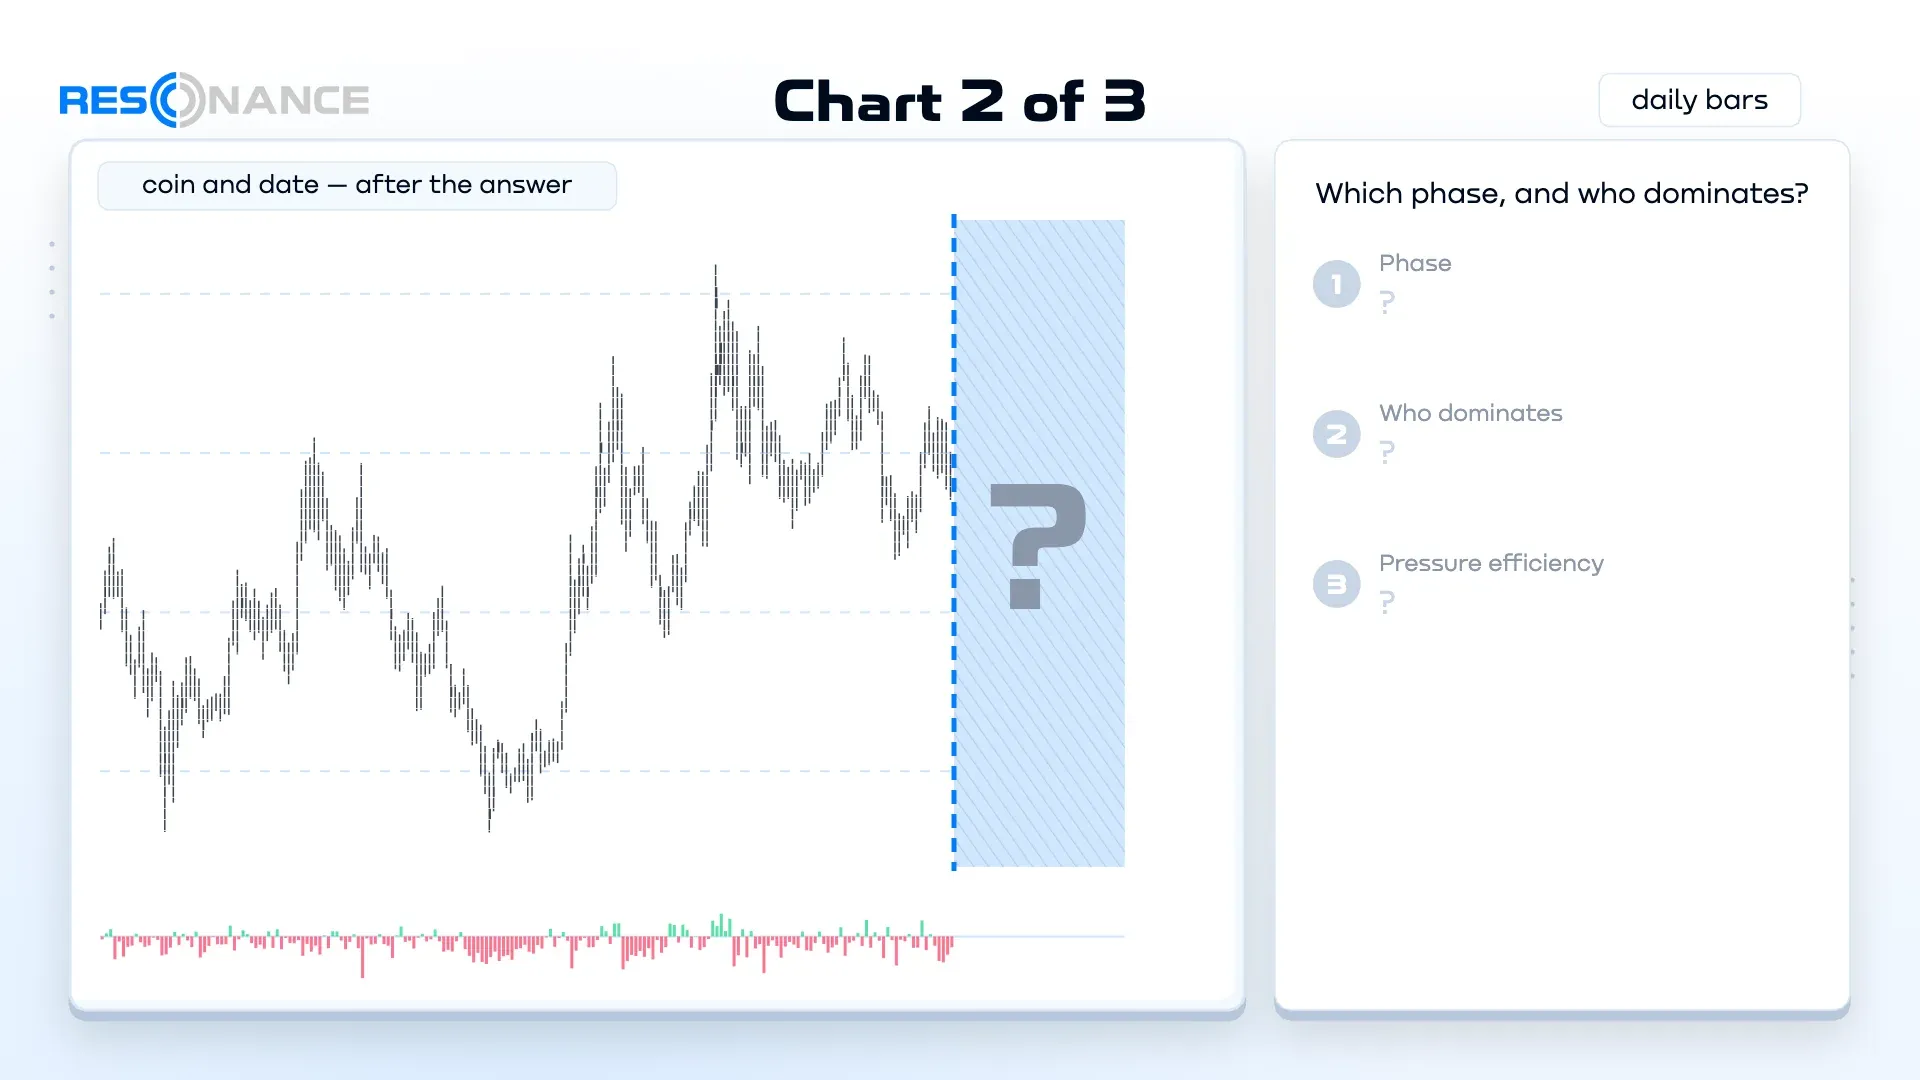
Same question: which phase, and who has the edge?
Show the answer
ADA/USDT, Binance, daily bars, October 8, 2025.
Step 1. Phase. Distribution, day 53: a sideways range after a rally.
Step 2. Who dominates. Delta was negative on all of the last five days — sellers pushed every day.
Step 3. Pressure efficiency. For almost the whole phase the band stays below zero — above zero on only 4 days out of 52. Selling moved the price more than buying, day after day.
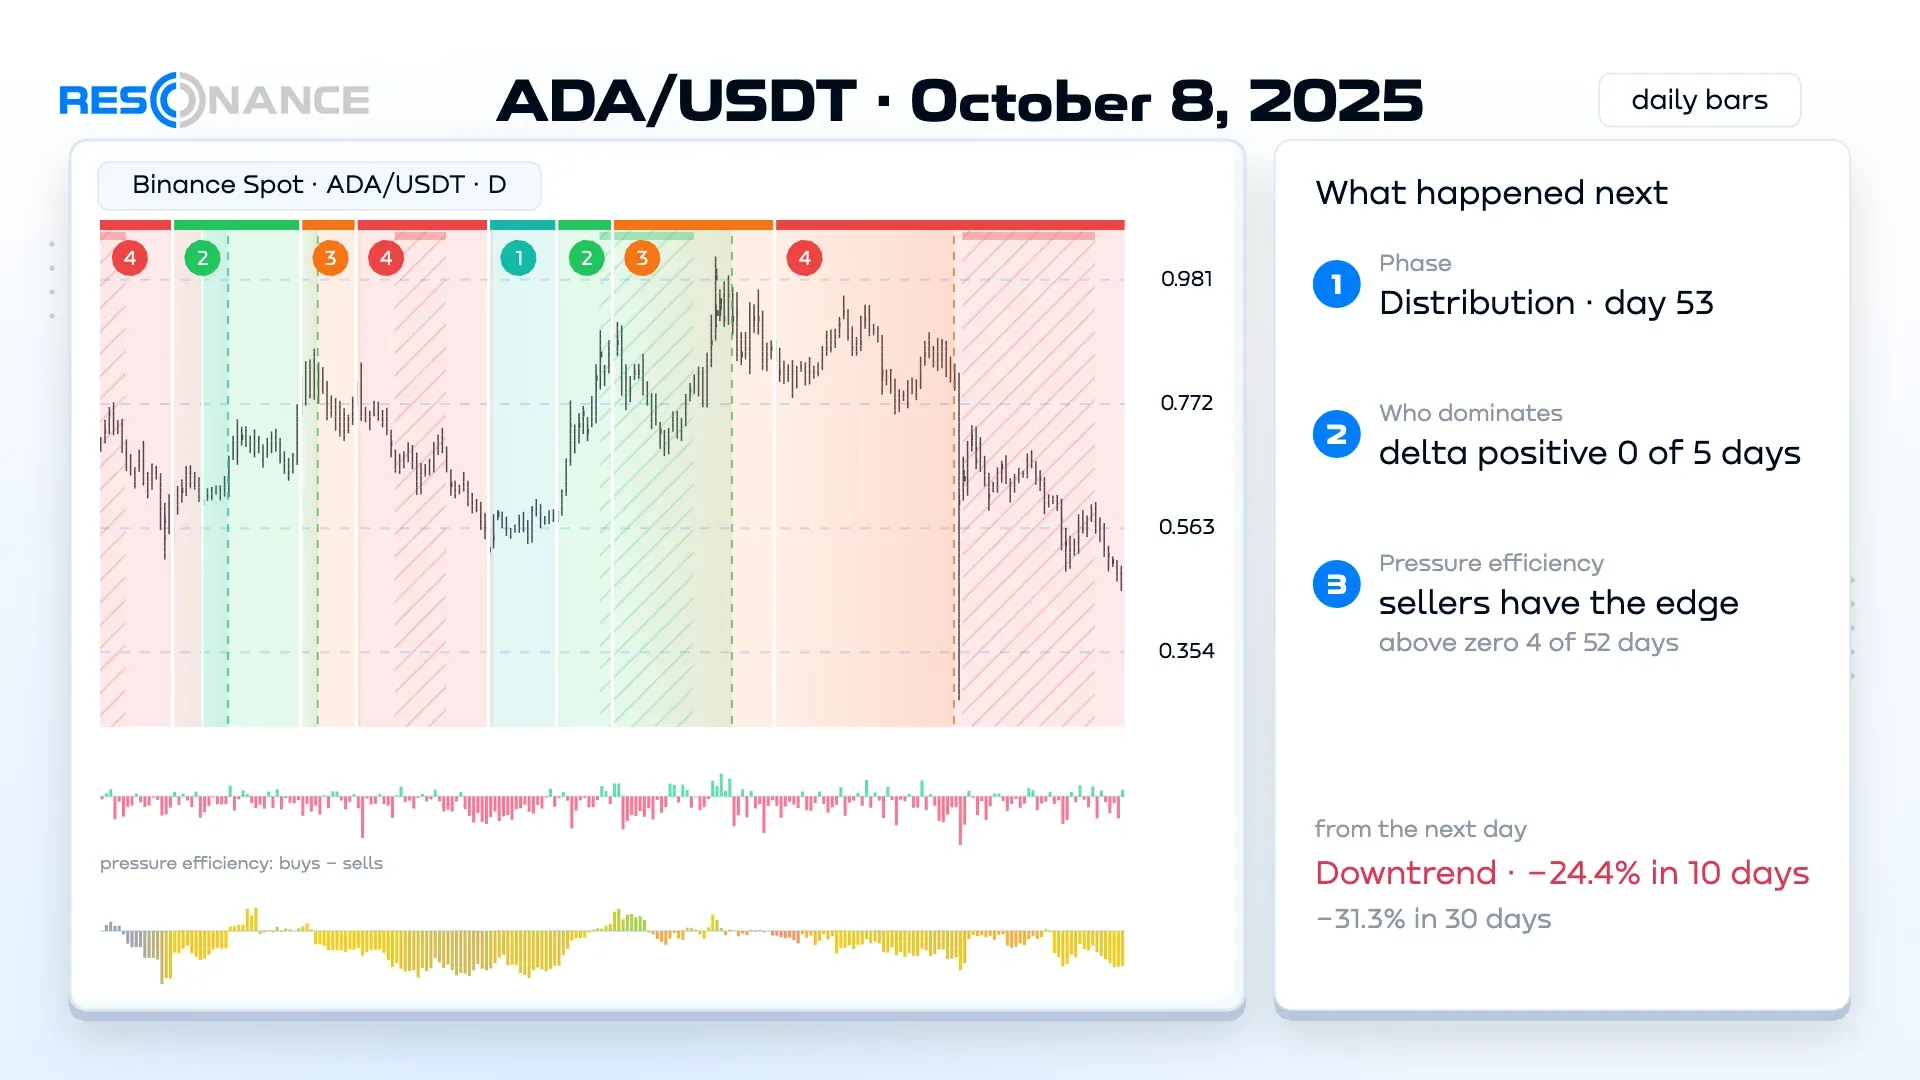
What happened next. A decline started the next day: −24.4% in 10 days and −31.3% in 30.
The lesson: in distribution, watch who keeps pushing day after day.
Example 3: after a spike and a drop — a narrow range
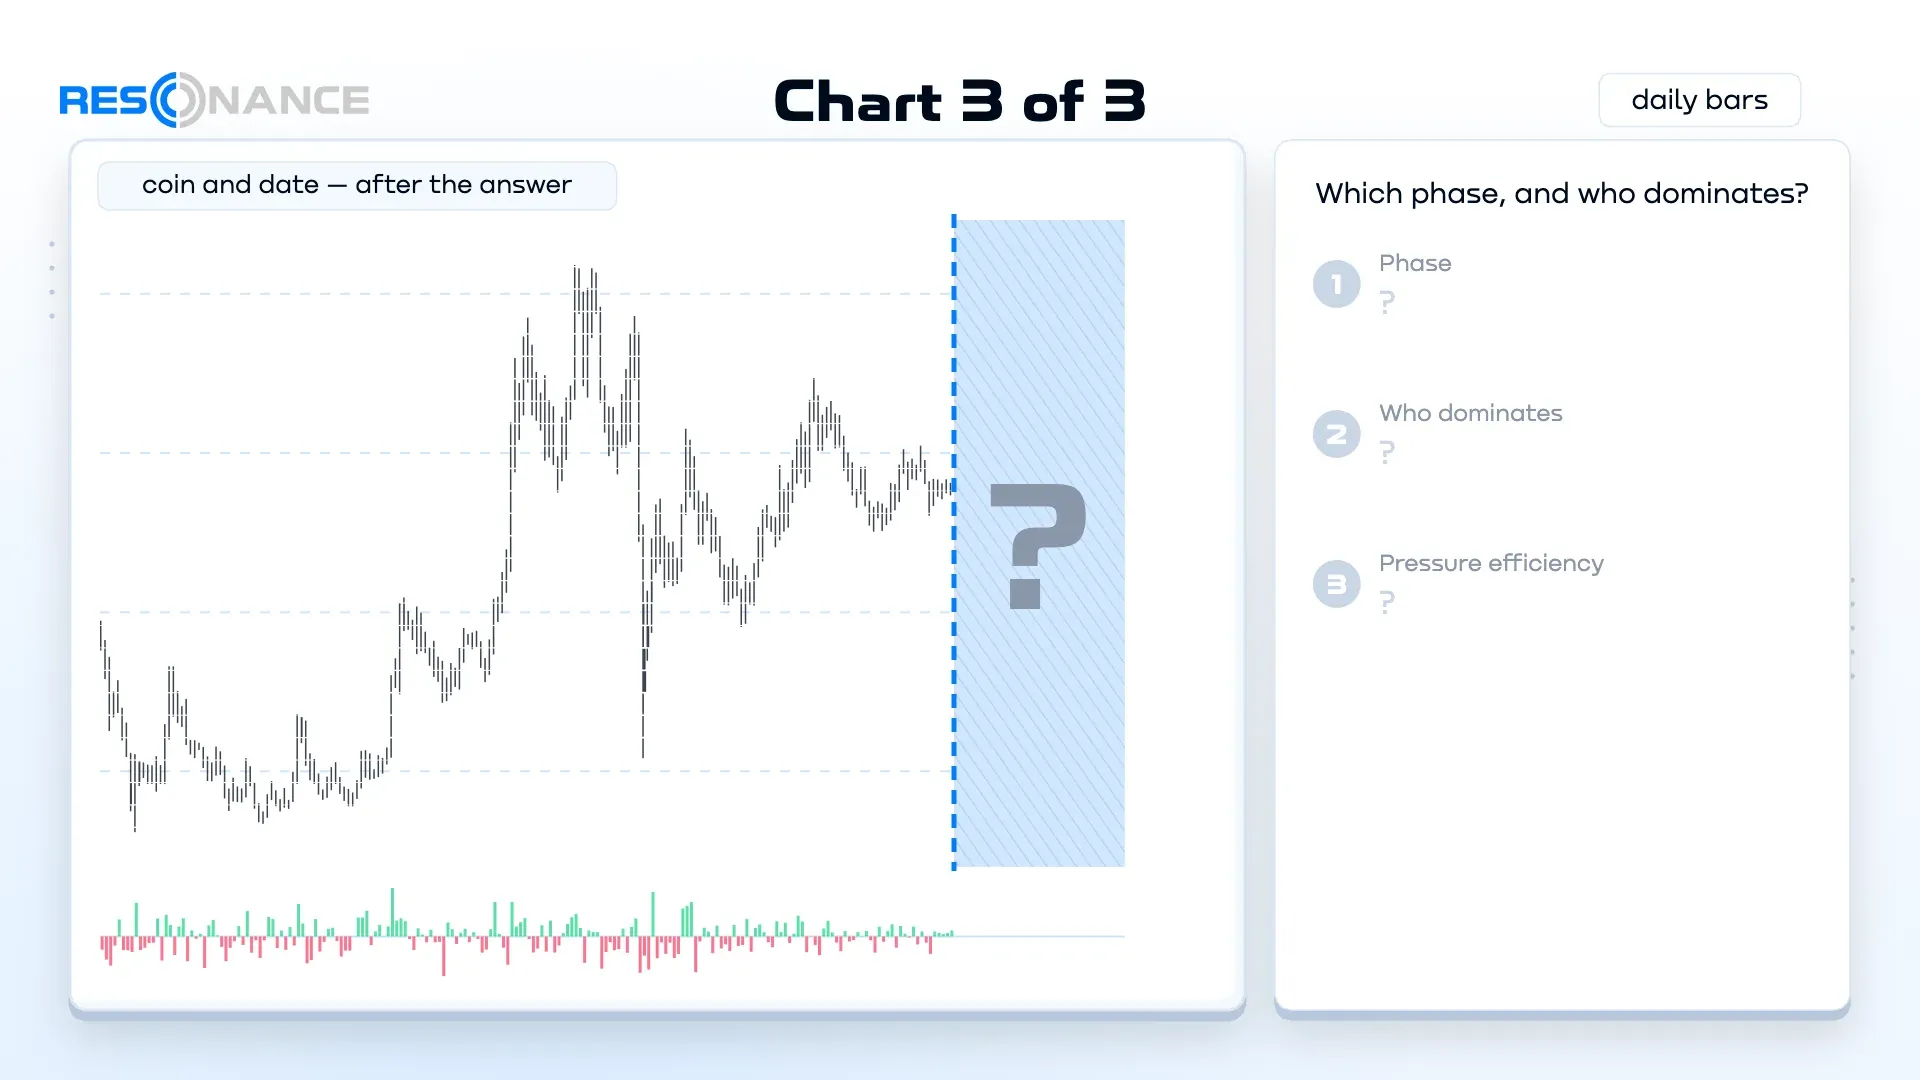
Which phase — and who dominates?
Show the answer
ZEC/USDT, Binance, daily bars, August 16, 2026.
Step 1. Phase. Accumulation, day 6: the decline has stopped and the price moves in a narrow range.
Step 2. Who dominates. Delta was positive on all of the last five days — buyers came in every day. Volume was less than half the usual: the market went quiet.
Step 3. Pressure efficiency. On every day of the phase the band is above zero — buying moved the price more than selling.
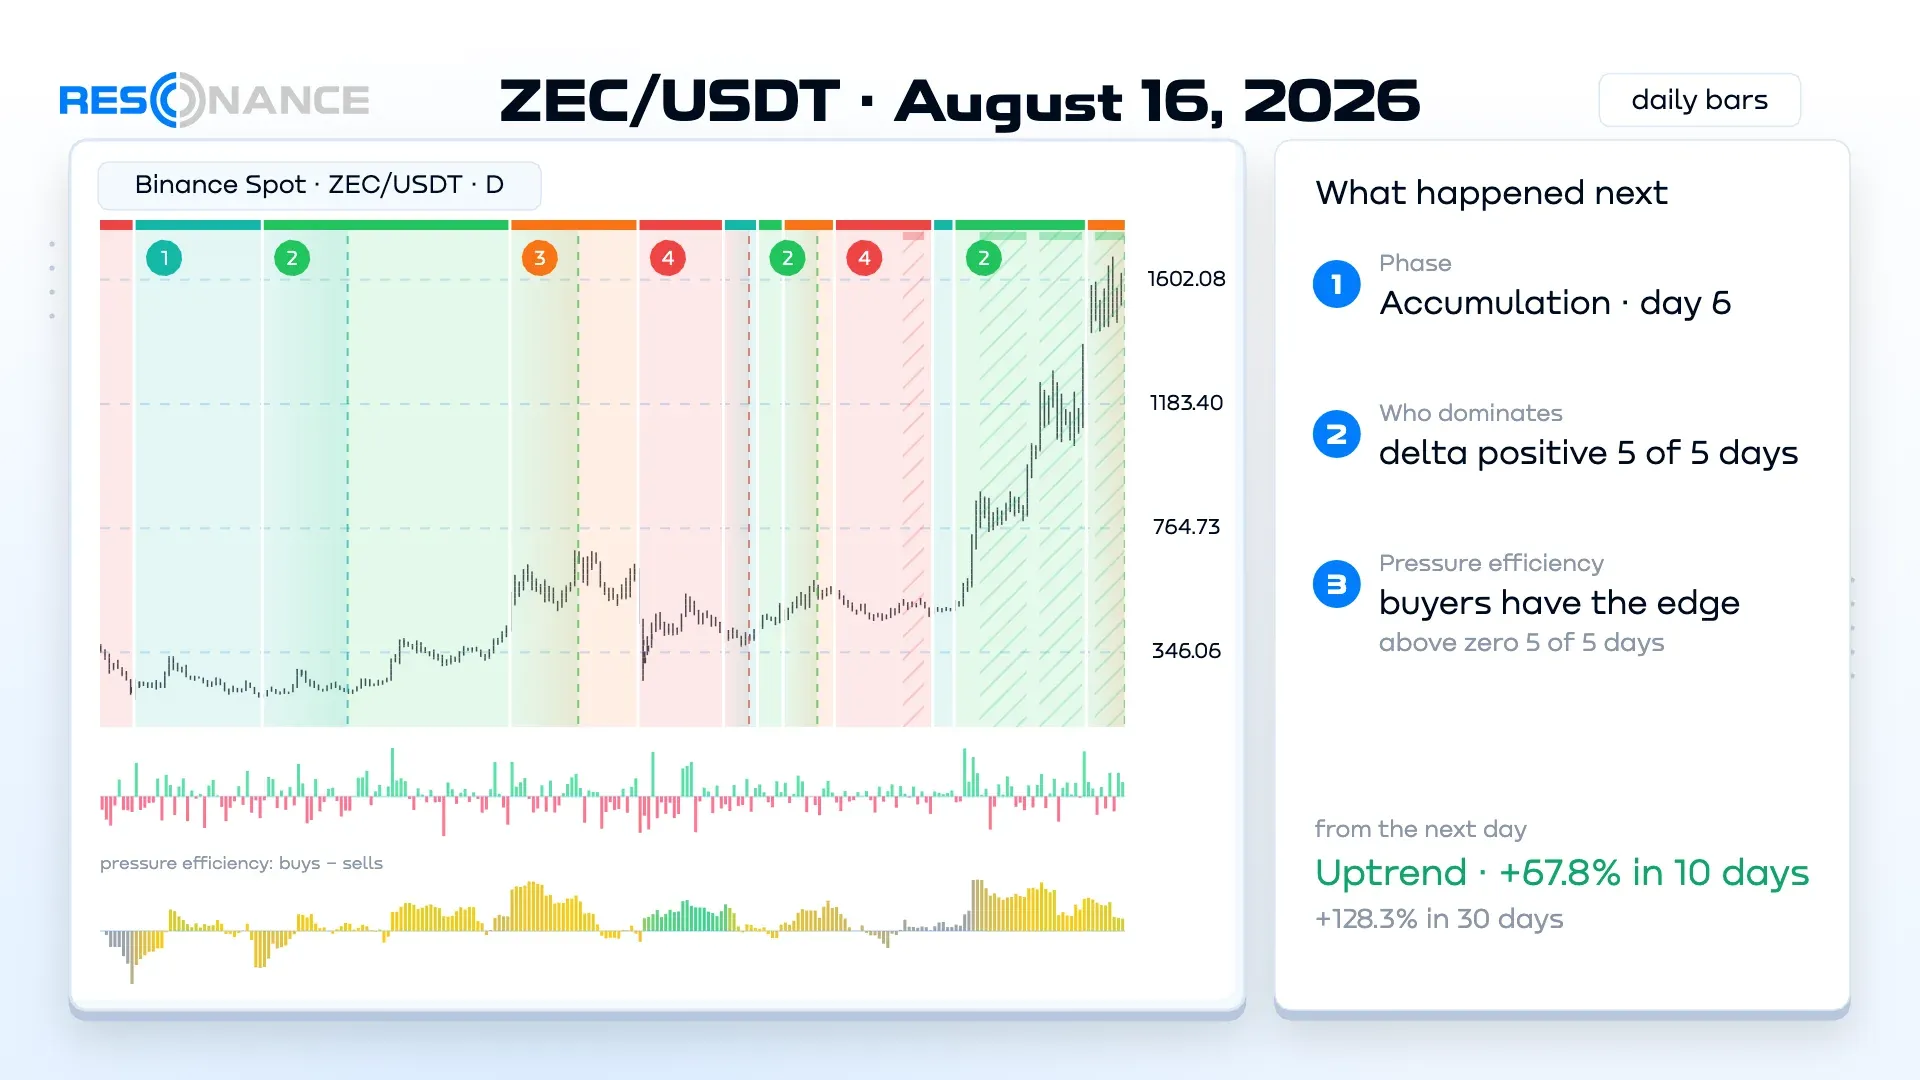
What happened next. A rally started the next day: +67.8% in 10 days and +128.3% in 30.
The lesson: quiet accumulation with buying every day — this is what a buyers’ edge looks like.
What these three charts teach
- Lots of buying is not an edge yet. In the first example there was more buying than selling, but the price did not follow — and the market went down.
- In distribution, what matters is who keeps pushing day after day. In the second example, selling moved the price more for almost the whole phase.
- Quiet accumulation with buying every day is a buyers’ edge. In the third example the market went quiet, while buying moved the price on every day of the phase.
This is a review of history, not advice on what to buy. Every Saturday — three new charts in the Chart Reading section.
Practice on your own
- You can practice the same steps on market history in the simulator.
- The four phases and how to see who dominates — in the free mini-course.
- New breakdowns — in our Telegram channel.
Recommended articles