Volatility in Trading: How Market Phases Help Identify Strong Price Moves

Cryptocurrency volatility is not chaos and not a standalone signal to enter a trade. It appears as a result of a changing balance between supply and demand. In this article, we explain how market phases, volume, liquidity, and participant behavior help traders understand where a strong move may appear and why it is important to analyze context, not just price.
Table of contents

Volatility in Trading
In simple terms, volatility is the speed and amplitude of an asset’s price change over a specific period of time. High cryptocurrency volatility is its main feature and, at the same time, one of the key advantages of the sector, because it creates opportunities for strong profit potential. A price can move 5–10% within a short period of time — something that may take days or even weeks in traditional markets.
But there is an important point here. For a trader, it is not enough to simply watch the movement. The real task is to identify volatility in advance — before the price has already “taken off.” Because once the move becomes obvious, a large part of it has already been missed. This is especially true in crypto, where movement develops quickly, the market operates online 24/7, and high-frequency market conditions can change the situation very fast.
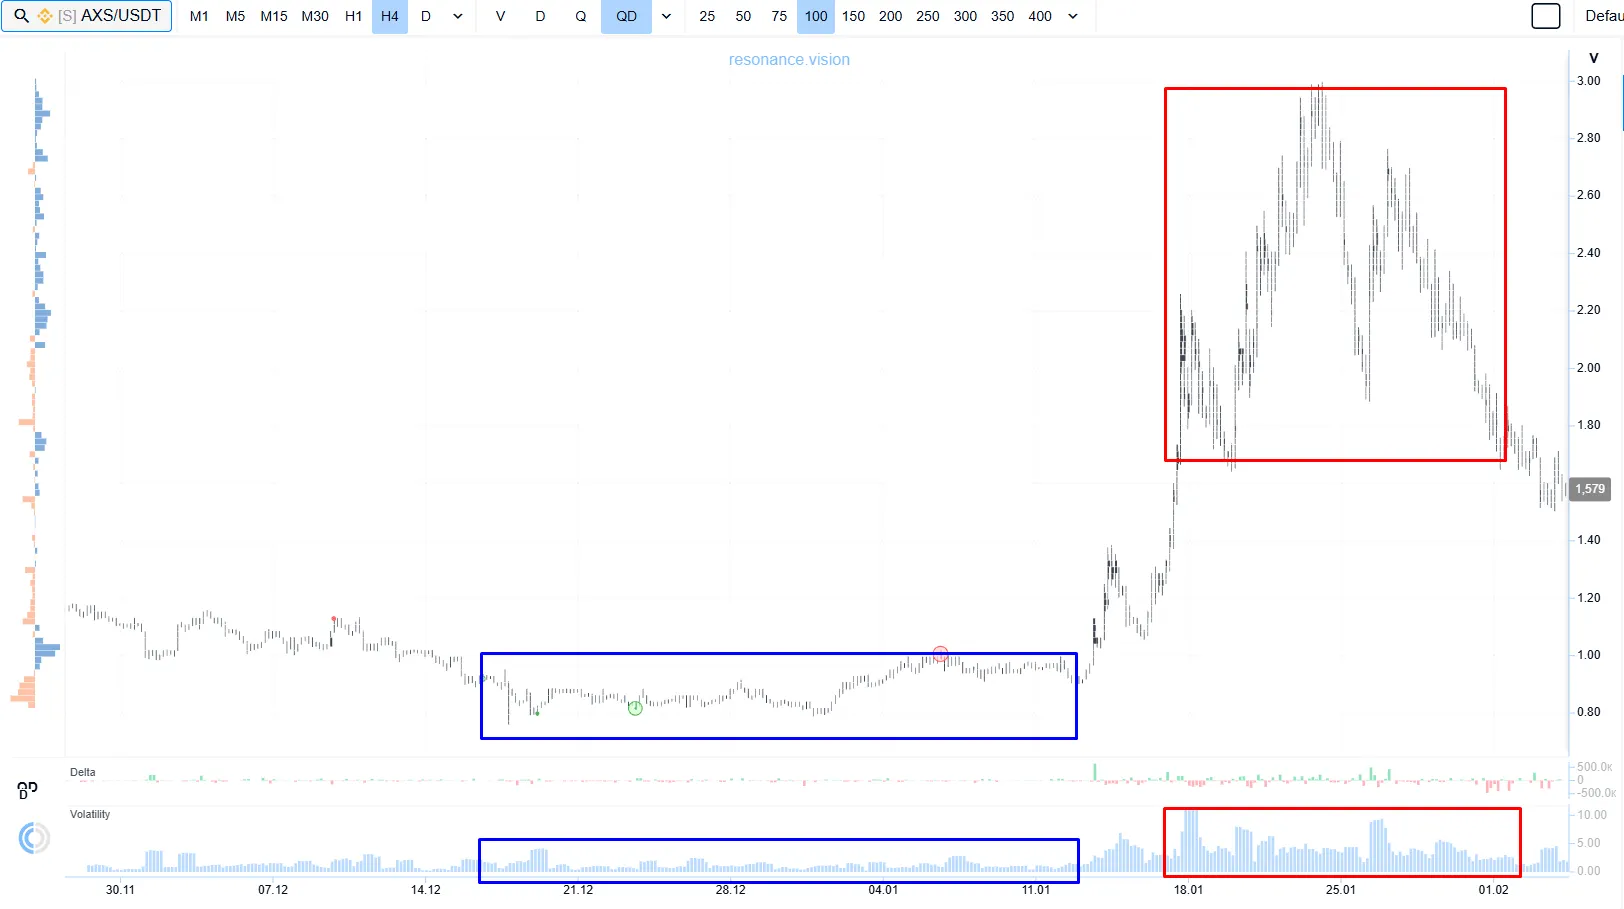
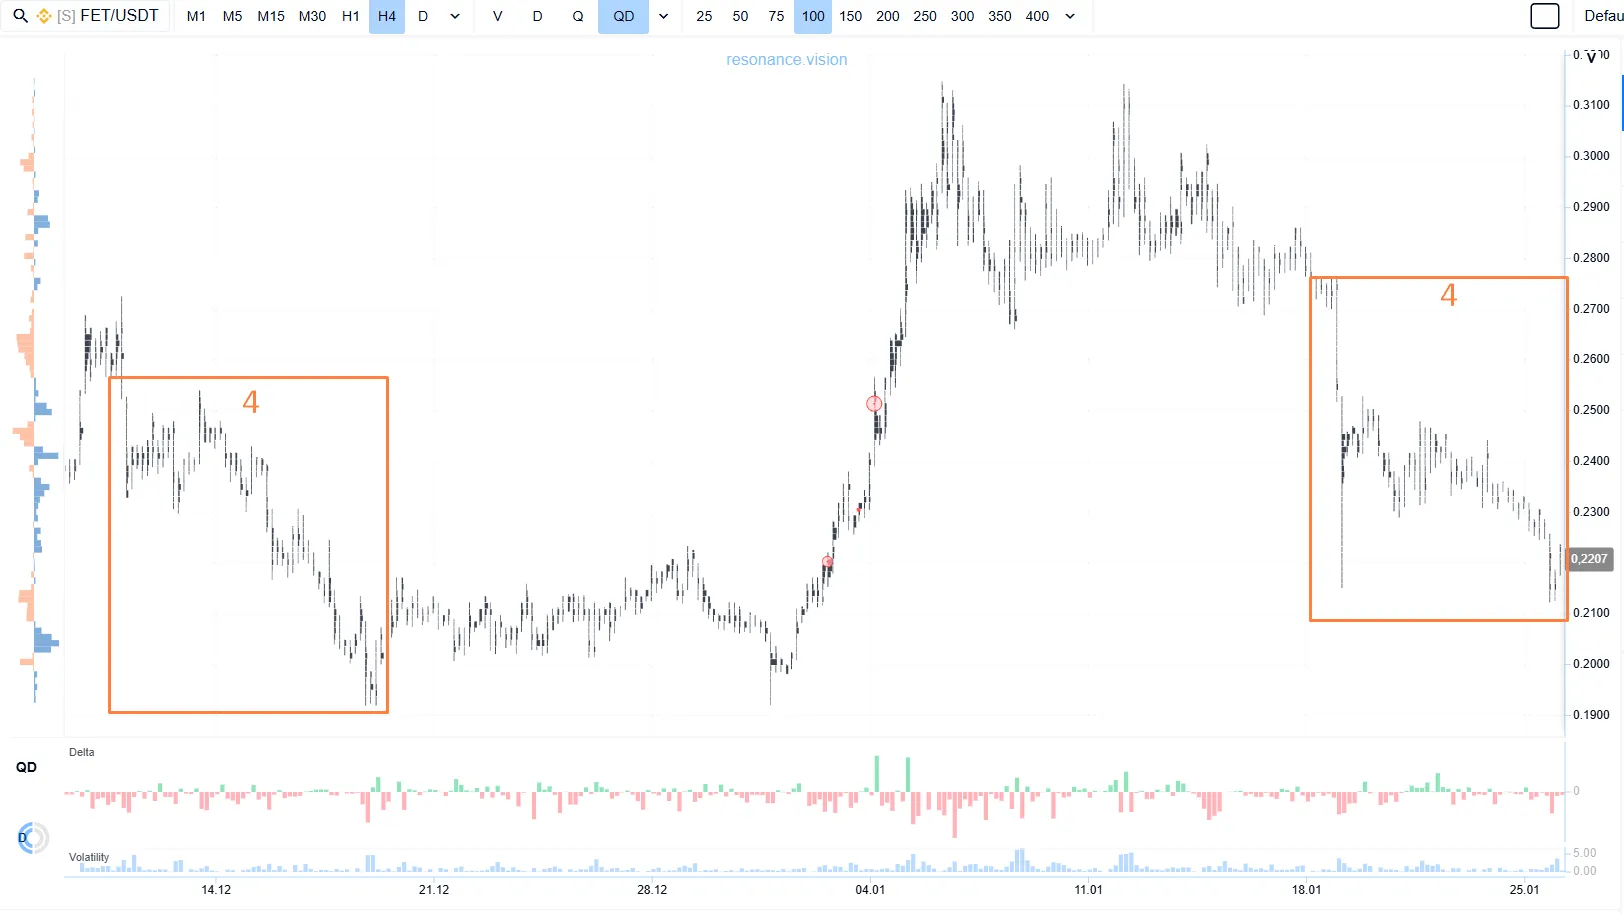
The screenshot marks a low-volatility phase (blue rectangle) and a high-volatility phase (red rectangle).
Supply, Demand, and Market Phases
The foundation of any market movement is the law of supply and demand. Price never changes on its own. Its movement always reflects the interaction between buyers and sellers. If demand exceeds supply, price rises — this creates a deficit. If supply exceeds demand, price falls — this creates a surplus. The struggle between participants is constant, and it creates states of deficit and surplus that define the current market phase. That is why traders need to monitor high-frequency changes in supply and demand online, rather than only analyzing the movement after the fact.
There are 4 main market phases:
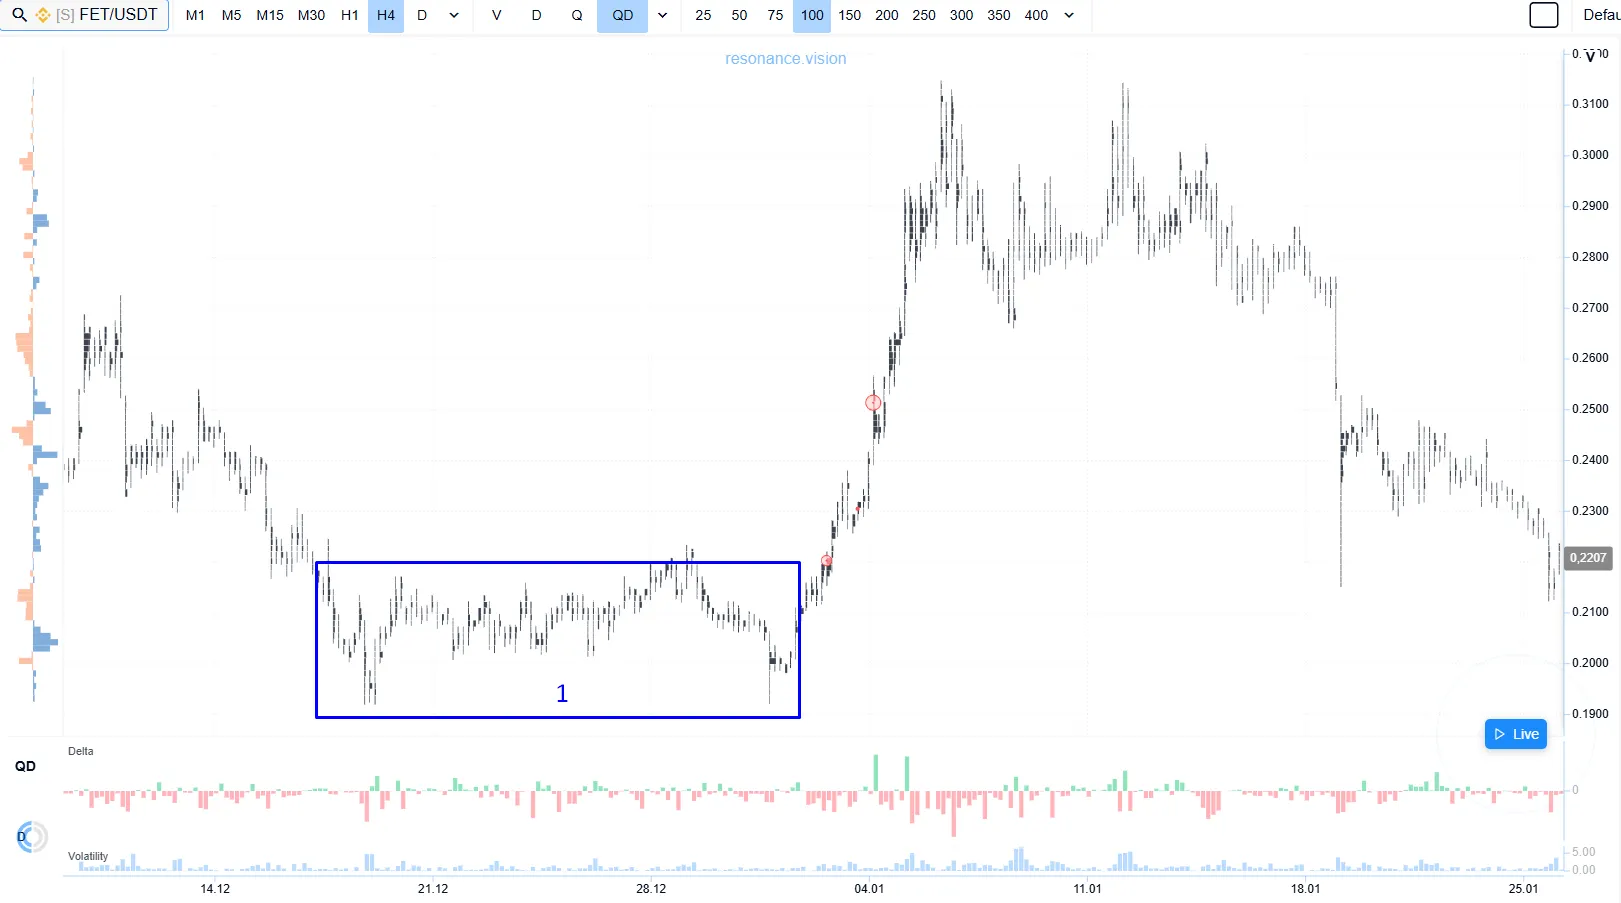
Phase 1 — Formation of a deficit state (accumulation): in this phase, participants accumulate their positions. Price usually moves within a narrow range, while price volatility remains low.
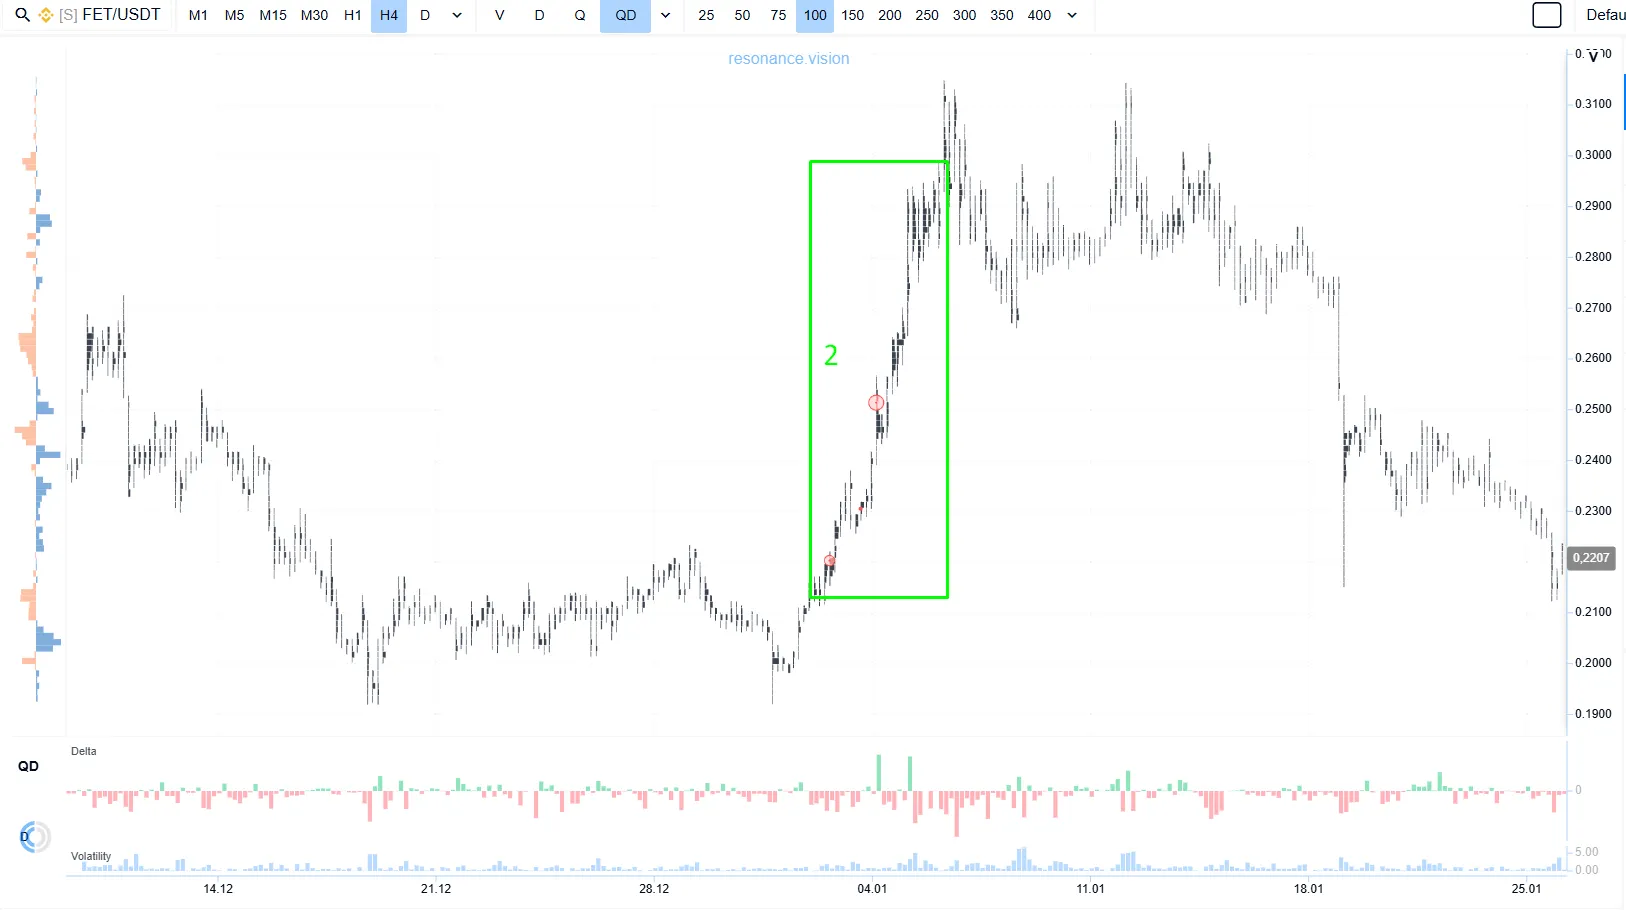
Phase 2 — Realization of the deficit state (impulse): once accumulation is complete, active upward price movement begins. At this point, cryptocurrency volatility rises sharply, and price accelerates.
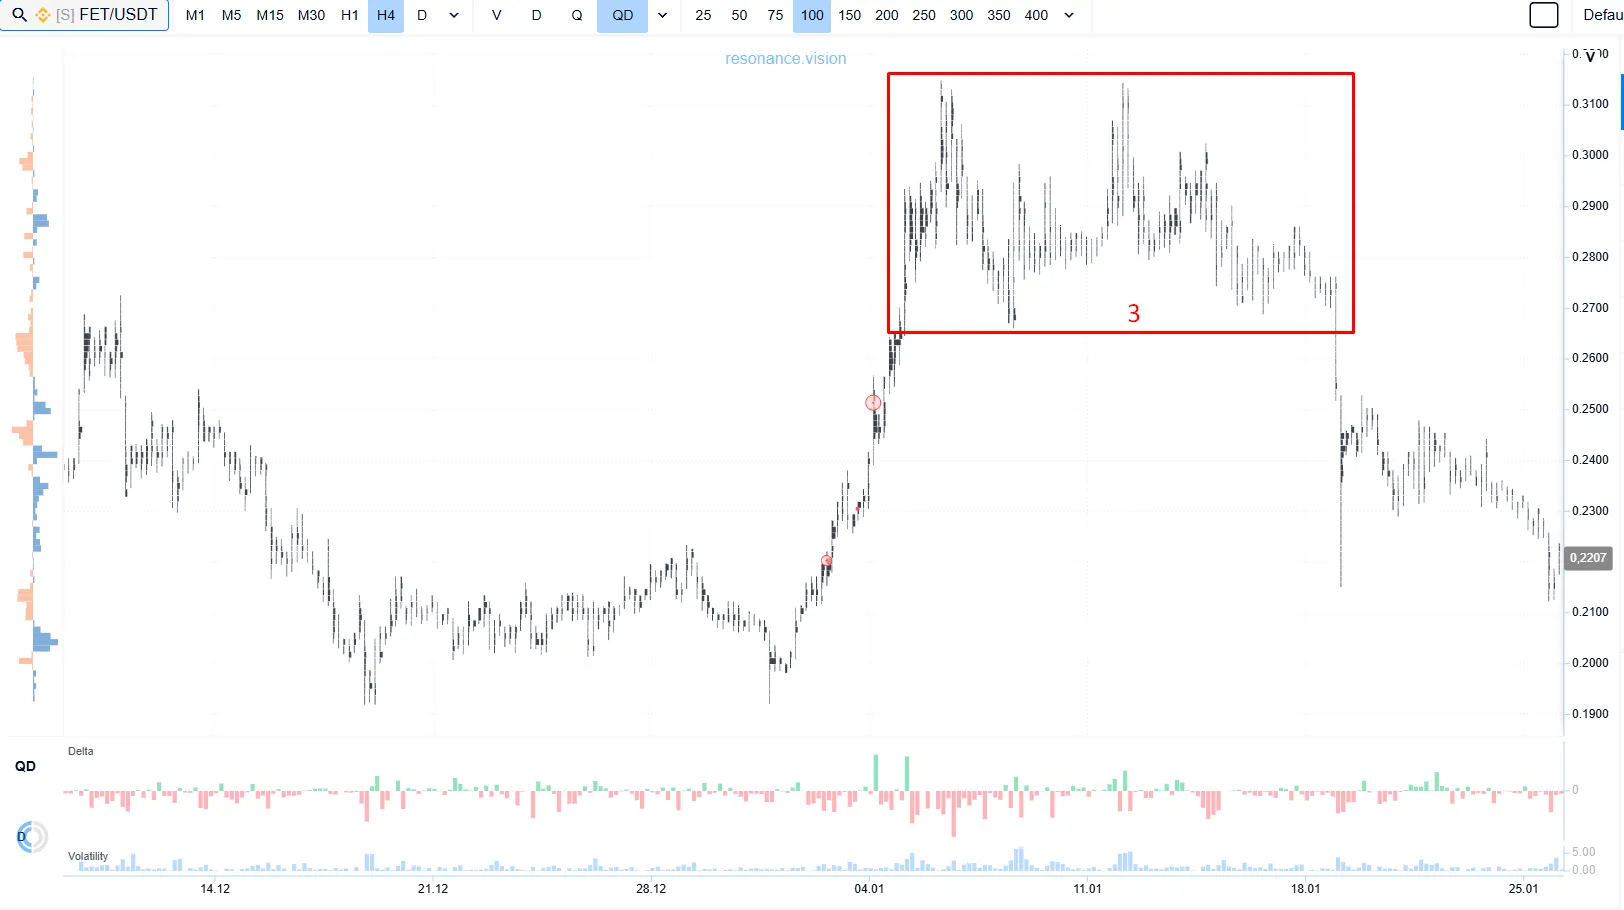
Phase 3 — Consolidation (surplus): after the impulse, participants who bought earlier during the accumulation phase begin to lock in profit, the market buyer loses strength, and highs stop being updated.
Phase 4 — Search for balance: after an active move, the market tries to find a new fair price. Supply may still dominate demand, but price gradually reaches a zone where buyer interest appears again. Here, it is important to observe how volume affects price: whether sellers continue to apply effective pressure or whether sell-side absorption has already begun.
Volatility: Risk or Opportunity
There is a common belief that high volatility in trading is a risk.
In practice, this is not entirely true. First of all, it is an opportunity.
It appears where active interest from market participants appears. Price volatility directly depends on liquidity: when order books become “thin,” even a relatively small amount of market buying or selling can cause a significant price swing. This creates the conditions for strong volatility and a potential opportunity to generate profit.
As you may have noticed, low volatility often appears during the formation of a deficit state: the market compresses, participants build positions, and price moves within a range. High volatility more often appears at the moment when an imbalance is being realized, when a deficit or surplus has already started to move the price. This is why it is important to look not at volatility separately, but at the market phase, demand, supply, and price reaction to volume. A volatility trading strategy only makes sense when it is built around this context, not around the amplitude of movement alone.
Clusters, Volumes, and Impulse
Most traders try to identify volatility using indicators. The problem is that standard tools, technical indicators, and classic techniques usually fail to keep up with market changes.
In this case, you need to look deeper.
To understand where volatility may appear, you need to look not at price alone, but at the behavior of market participants.
For this, you need to use a cluster chart.
It allows you to see:
- where buyer or seller activity appears;
- whether this activity leads to price movement;
- whether there is pressure without result — a sign of absorption;
- where the market is “compressing” before an impulse.
In Resonance, this type of analysis can be performed online: you can track clusters, limit activity, delta, balance, and find assets faster when the market is moving from one phase to another. These techniques help traders see high-frequency shifts in market behavior before they become obvious on a standard chart.
In simple terms, clusters allow you to look inside the candle, almost like an X-ray. They do not allow you to calculate volatility itself, but they provide the context in which it may appear. A trading volatility index can show that amplitude has already increased, but clusters help explain what created the conditions for that move.
Traps of High Volatility
High cryptocurrency volatility is not only an opportunity, but also a source of mistakes. If a trader sees only a sharp movement but does not understand the market phase, they can easily enter too late, hold a position against the changed context, or ignore the moment when volume stops confirming the move. Without the ability to calculate risk management correctly, the trader will keep getting shaken out of positions.
Price can move sharply and unpredictably. Without understanding the context, this leads to mistakes:
- late entries;
- holding a position against the market;
- ignoring a phase change.
That is why it is important to work with data, not emotions. If the market phase changes, the position needs to be reviewed. If volume stops moving the price, it is a signal to trade more carefully. This is how a trader stops merely reacting to volatility and starts understanding what stands behind it. The faster a trader sees these changes online, the lower the chance of entering too late or holding a position against the new market state.
This is what makes it possible to calculate risks properly in high-volatility conditions, where the expected profit becomes less predictable without context. Any volatility trading strategy should also take into account whether volume still supports the movement or whether the phase has already changed.
If you are just starting to learn volume analysis, market phases, and the logic of supply and demand, start with the free Resonance mini-course. It will help you build the foundation: understand why price moves, how deficit and surplus are formed, what role liquidity plays, and why volatility in trading cannot be analyzed separately from the market context. It also helps build data-based techniques for reading the market, instead of relying only on emotion or delayed indicators.
Conclusion
To work with the market effectively, it is important to understand phases, analyze supply and demand, look at volume, and evaluate how price reacts to the actions of participants. Volatility in trading is not random and it is not chaos. It does not appear on its own and it is not a signal to enter a trade. It reflects what is happening between the buyer and the seller.
If a trader looks only at candles, a sharp move seems unexpected. If they analyze volumes, limit liquidity, and the market phase, they see not just volatility, but the reason why it appears. This is the main advantage of data-based analysis: not guessing where price will go, but understanding what state is forming in the market and where there are good setups for making profit.
In Resonance, these situations can be tracked online through the cluster chart, heatmap, delta, balance, and screeners. This is important because the market phase does not change after a candle closes; it changes during the interaction of supply and demand. Online analysis helps you see where participant activity appears, how volume affects price, and whether market buying or selling produces a result.
This approach is especially useful in crypto, where movement can develop quickly. Instead of manually reviewing dozens of charts, a trader can use Resonance online tools for high-frequency monitoring of assets with growing activity, changing liquidity, and signs of transition from a quiet phase into an impulse. A trading volatility index or other analytical techniques can complement this process, but they do not replace context. This approach does not remove the need for analysis, but it makes market work faster and more systematic.
Follow new insights in our telegram channel.
No need to invent complex schemes and look for the "grail". Use the Resonance platform tools.
Register via the link — get a bonus and start earning:
OKX | BingX | KuCoin.
Promo code TOPBLOG gives you a 10% discount on any Resonance tariff plan.
Recommended articles


