Moving Average in Trading: How to Use It with Volume
Discover why the standard Moving Average (MA) often provides lagging signals and how combining this indicator with volume analysis and cluster charts helps reveal the true intentions of market participants.
Table of contents
- 01Introduction
- 02What a Moving Average Actually Shows
- 03Why a Single MA Is Not Enough
- 04Lagging Signals
- 05Lack of Information About Participant Actions
- 06False Crosses and Noise
- 07Same Signal — Different Meaning
- 08Volume Analysis with a Moving Average
- 09How to Use the Moving Average in Crypto Trading
- 10Moving Average: Confirmation of an Uptrend
- 11Moving Average: Confirmation of a Downtrend
- 12Moving Average: False Breakout
- 13Moving Average: Ranging Market
- 14Workflow Algorithm
- 15Moving Average: Common Trader Mistakes
- 16Conclusion

Introduction
The moving average (MA) is one of the most well-known and widely used indicators in trading. It is available on virtually every platform, is easy to customize, and helps you quickly identify the overall direction of price movement.
That’s exactly why many traders start by using the MA when analyzing cryptocurrency charts. When price is above the average, the market looks strong. When price drops below it, the move appears weaker. At first glance, it seems simple and visually clear.
But here’s the important question: Is a single moving average enough to make trading consistently profitable in the cryptocurrency market?
In the past, traders mostly had access to price data alone, so tools like this made sense for their time. Today, the situation is different. We can look not only at how price changed, but at what drove that change: whether there was real demand, whether the move was backed by actual volume, how buyers and sellers behaved, and whether imbalances appeared.
It’s now clear that the moving average method only shows part of the picture.
In this article, we won’t argue whether MA “works” or “doesn’t work.” Our goal is not forecasting. We won’t debate the core idea of the MA itself. Instead, we’ll examine what changes when you add demand, supply, and price reaction to volume into the analysis.
What a Moving Average Actually Shows
A Moving Average (MA) is a technical indicator that calculates the average price over a chosen period and plots it on the chart as a smoothed line.
In simple terms, it takes the prices from a certain number of candles or bars, averages them, and helps reveal the overall direction of movement by filtering out some of the market noise.
With its help, it’s convenient to:
- See the general market dynamics;
- Quickly understand where price stands relative to the average;
- Visually separate more directional moves from chaotic fluctuations.
This is precisely why it’s so popular. As an indicator, the moving average is simple, intuitive, and doesn’t clutter the chart.
But it’s important to understand that it only works with price action that has already occurred. It doesn’t show whether large capital was driving the market, whether there was a strong buyer or seller behind the move, whether the impulse was accompanied by real volume, whether selling pressure was being absorbed, and so on. In other words, MA can show the direction of the move, but not what is happening underneath it.
For basic visual orientation, this may be sufficient. But when it comes to making actual trading decisions, simply smoothing price is no longer enough. Because the market moves not by lines, but by the actions of participants.
Why a Single MA Is Not Enough
Lagging Signals
Any moving average is built on already closed data. The longer the period, the stronger the smoothing — and the later the signal appears.
As a result, traders often see “confirmation” only after part of the move has already played out. Price has shifted, the impulse has occurred, and the MA is just starting to react.
This feature by itself doesn’t make the tool useless, but it clearly reveals its limitation: in crypto trading, the moving average does not reveal the moment a move is born — it only records it after the fact. This means the trader often misses a good entry point.
Many trading strategies using moving averages look clear on the chart, but they often lose their edge once you compare them with volume, delta, and cluster data.
Lack of Information About Participant Actions
Price may cross the MA upward or downward. But this information alone doesn’t answer the key question: What exactly happened in the market?
Did a strong buyer step in?
Is there limit resistance?
Was this arbitrage or real interest from many participants?
Is there liquidity in the asset?
None of this is visible from the MA alone.
This means the trader sees the fact of a price change, but not its underlying market cause.
False Crosses and Noise
In ranging markets, price can constantly cross the average in both directions. Formally, signals appear, but there is no directional movement.
This is especially noticeable in the crypto market due to high volatility. Price can quickly cross the average several times and then just as quickly return.
If you look only at the MA, these episodes look like signals. If you look deeper, they often turn out to be nothing more than market noise.
Same Signal — Different Meaning
Price can cross the MA in two outwardly similar situations.
In one, strong demand really stands behind the move. In the other, it’s a weak impulse with no follow-through.
On a chart with a moving average, these two signals will look very similar. But their market background is completely different.
That’s why the next step is to look not only at the fact of the MA cross itself, but at what was happening with volume at that moment. Because an outwardly identical signal does not mean an identical market situation.

Volume Analysis with a Moving Average
The moving average captures the average result of price change. Volume shows what is really happening in the market. It helps determine whether there is genuine participant involvement in the move or whether we’re just seeing a local price fluctuation without solid volume support.
When we add demand and supply analysis to crypto trading, the focus shifts. We no longer look only at where price has moved, but whether that move was supported by real market participant activity.
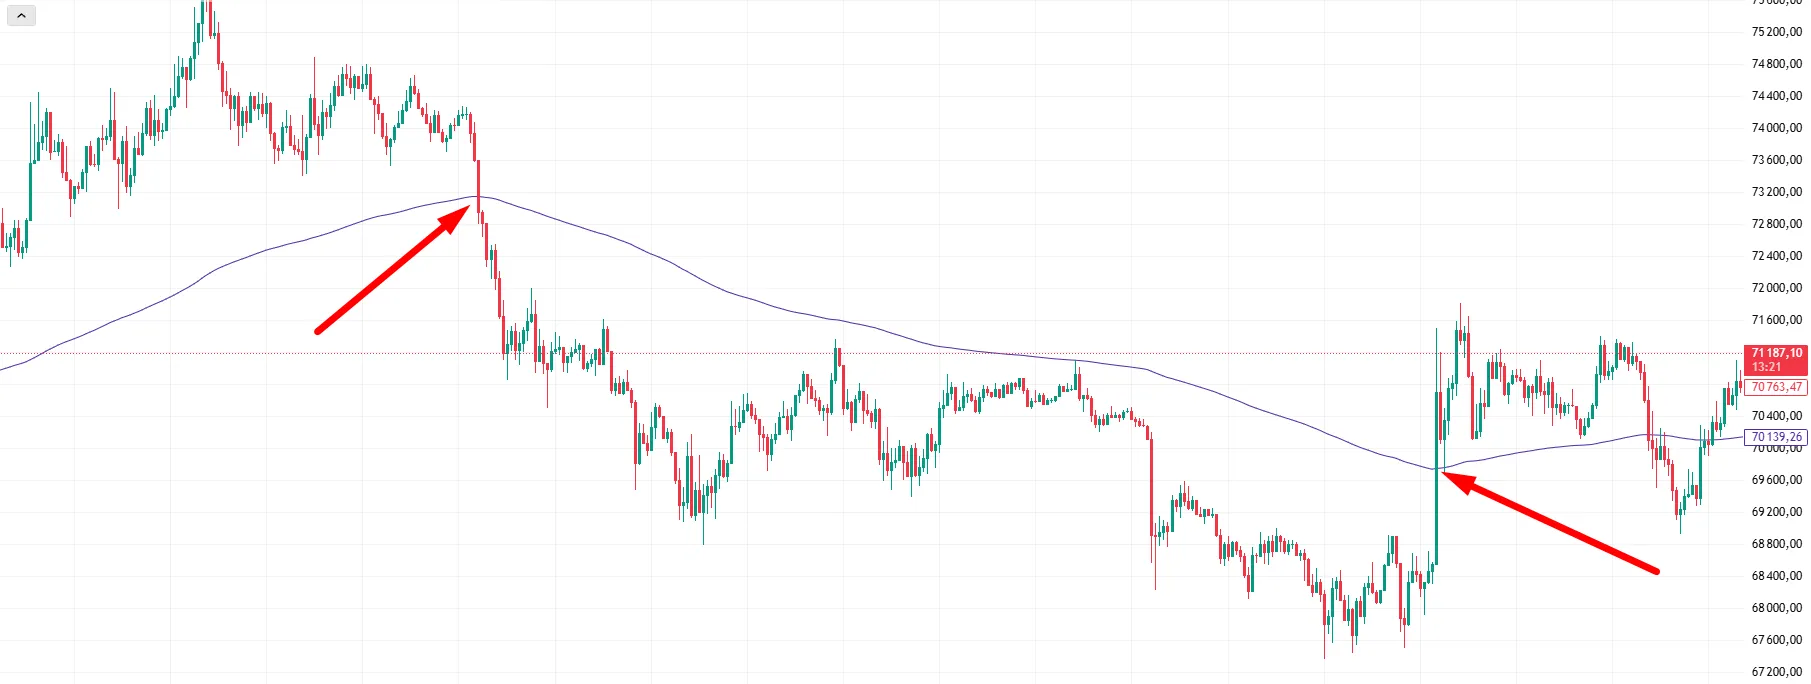
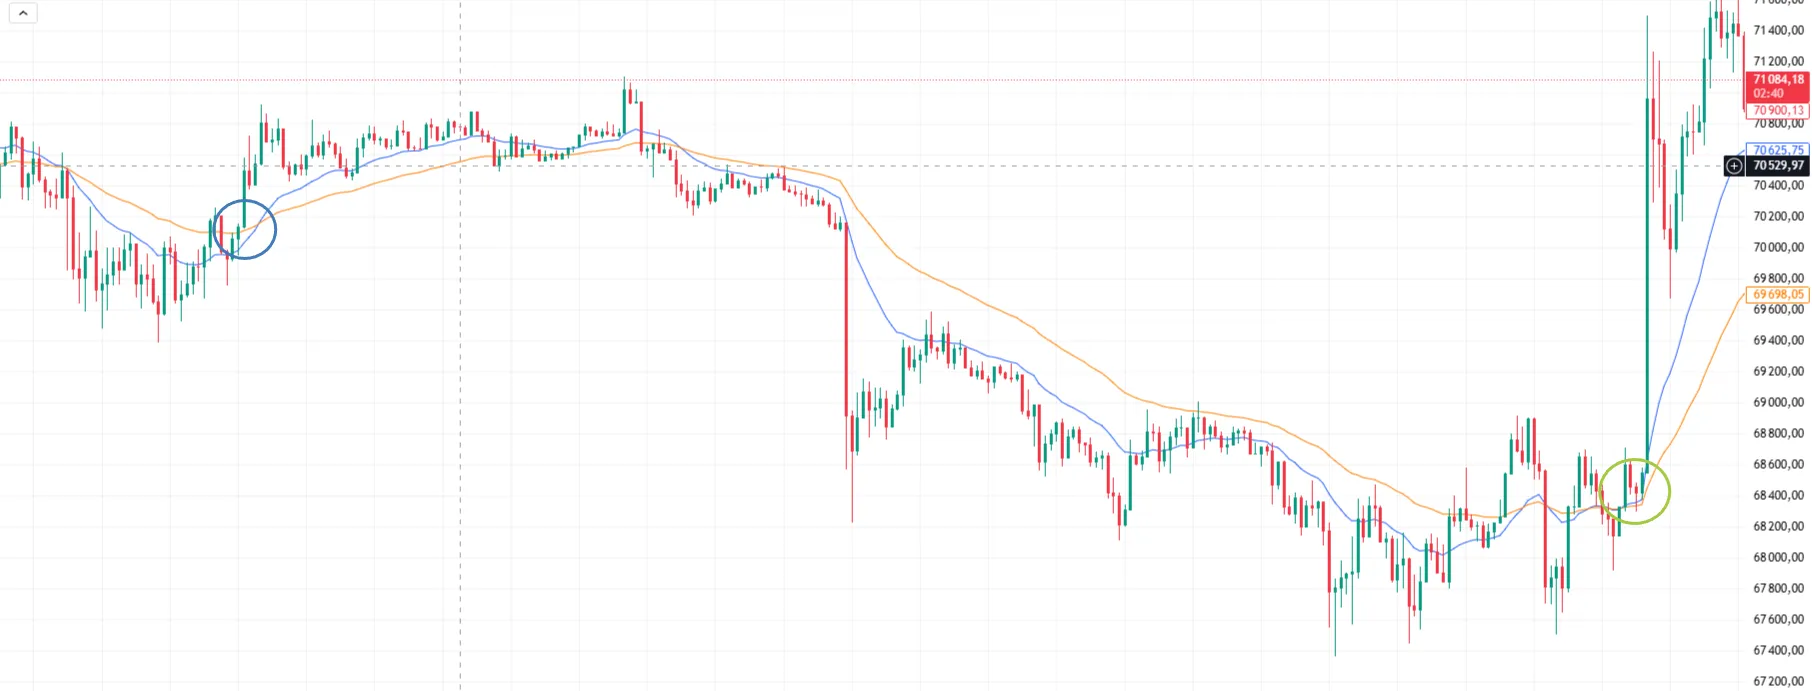
The same MA signal can be read very differently. This is clearly visible in the examples below. In both cases, price crosses the moving average upward.
Formally, the signal is the same.
But when you open the cluster (footprint) chart, the picture becomes clear.
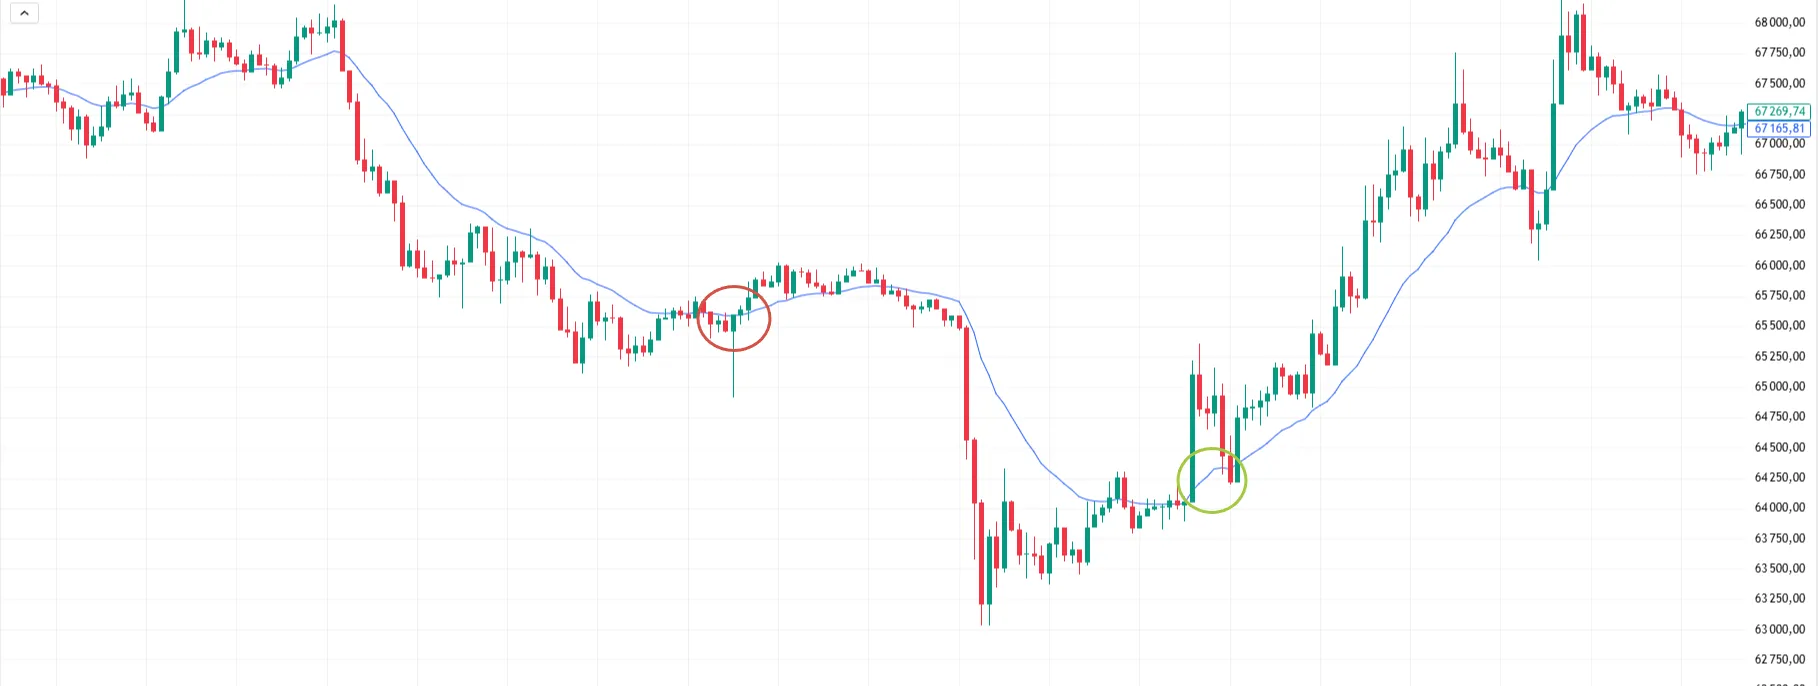
Situation 1 (red circle)
On the clusters, you can see market buying is present, but it is not pushing price higher. The buyer is weak and not achieving the desired result. Then market selling appears and effectively drives price down.
Situation 2 (green circle)
Here, after the MA cross, a different market situation is visible: the buyer is acting more aggressively, market buying produces results, and counter-selling is ineffective.
It turns out that the formal MA signal looks similar in both cases, but the meaning is completely different.
And this is exactly what the moving average itself does not show. Volume, the cluster chart, and delta reveal this difference. That’s why two similar MA signals can lead to very different outcomes. The difference between them is shown not by the line, but by volume behavior.
Moreover, it’s not the volume itself that matters, but the price reaction to it.
High volume by itself guarantees nothing. It is far more important to understand what happened to price after the effort.
If the buyer is aggressive but price barely rises, this is already a key observation — it signals emerging supply (selling pressure building). If the seller is pushing with market orders but the downward move doesn’t continue, it means their volume is being absorbed by limit orders. When volume is present but there is no result, this is market inefficiency — and an opportunity to profit.
This is where proper demand and supply analysis begins. We evaluate not just the presence of activity, but the connection between effort and result. In turn, this allows us to understand what precedes a price change and to make the right trading decision in time.
How to Use the Moving Average in Crypto Trading
If you already have a moving average on your chart, it should not be used as the foundation of a strategy or as a forecasting tool. At most, it can serve as a reference point or an attention trigger.
Here’s what proper logic looks like:
Not like this: price crossed the MA = entry
But like this:
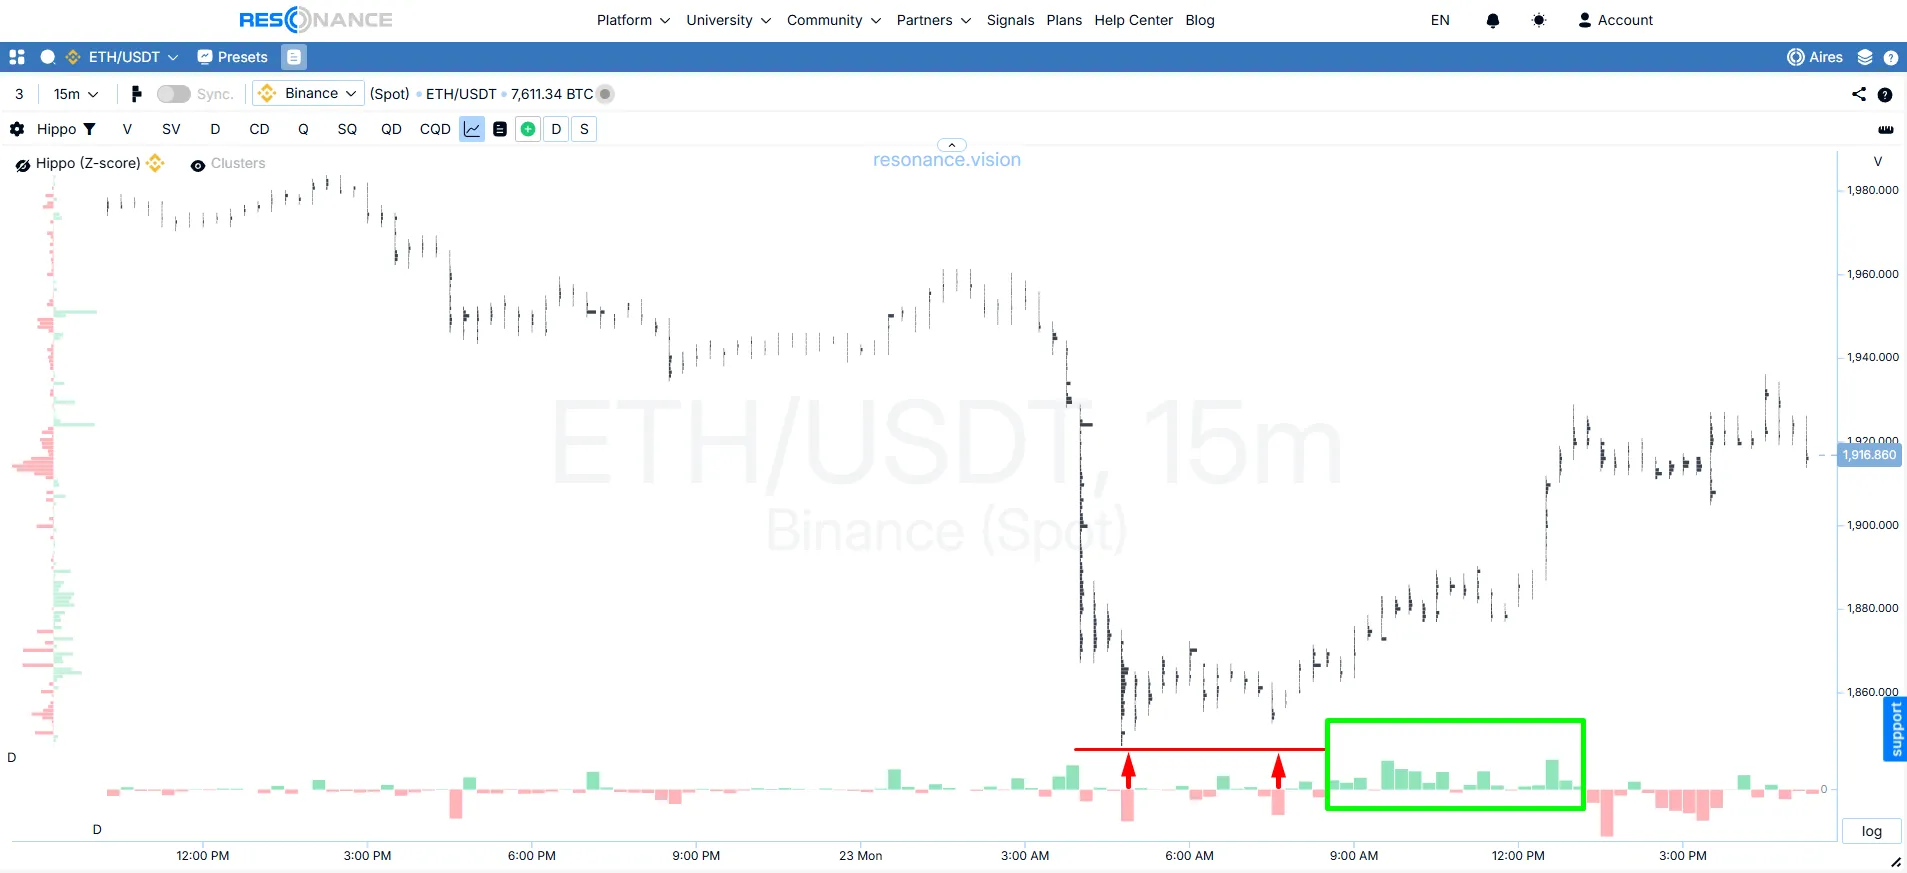
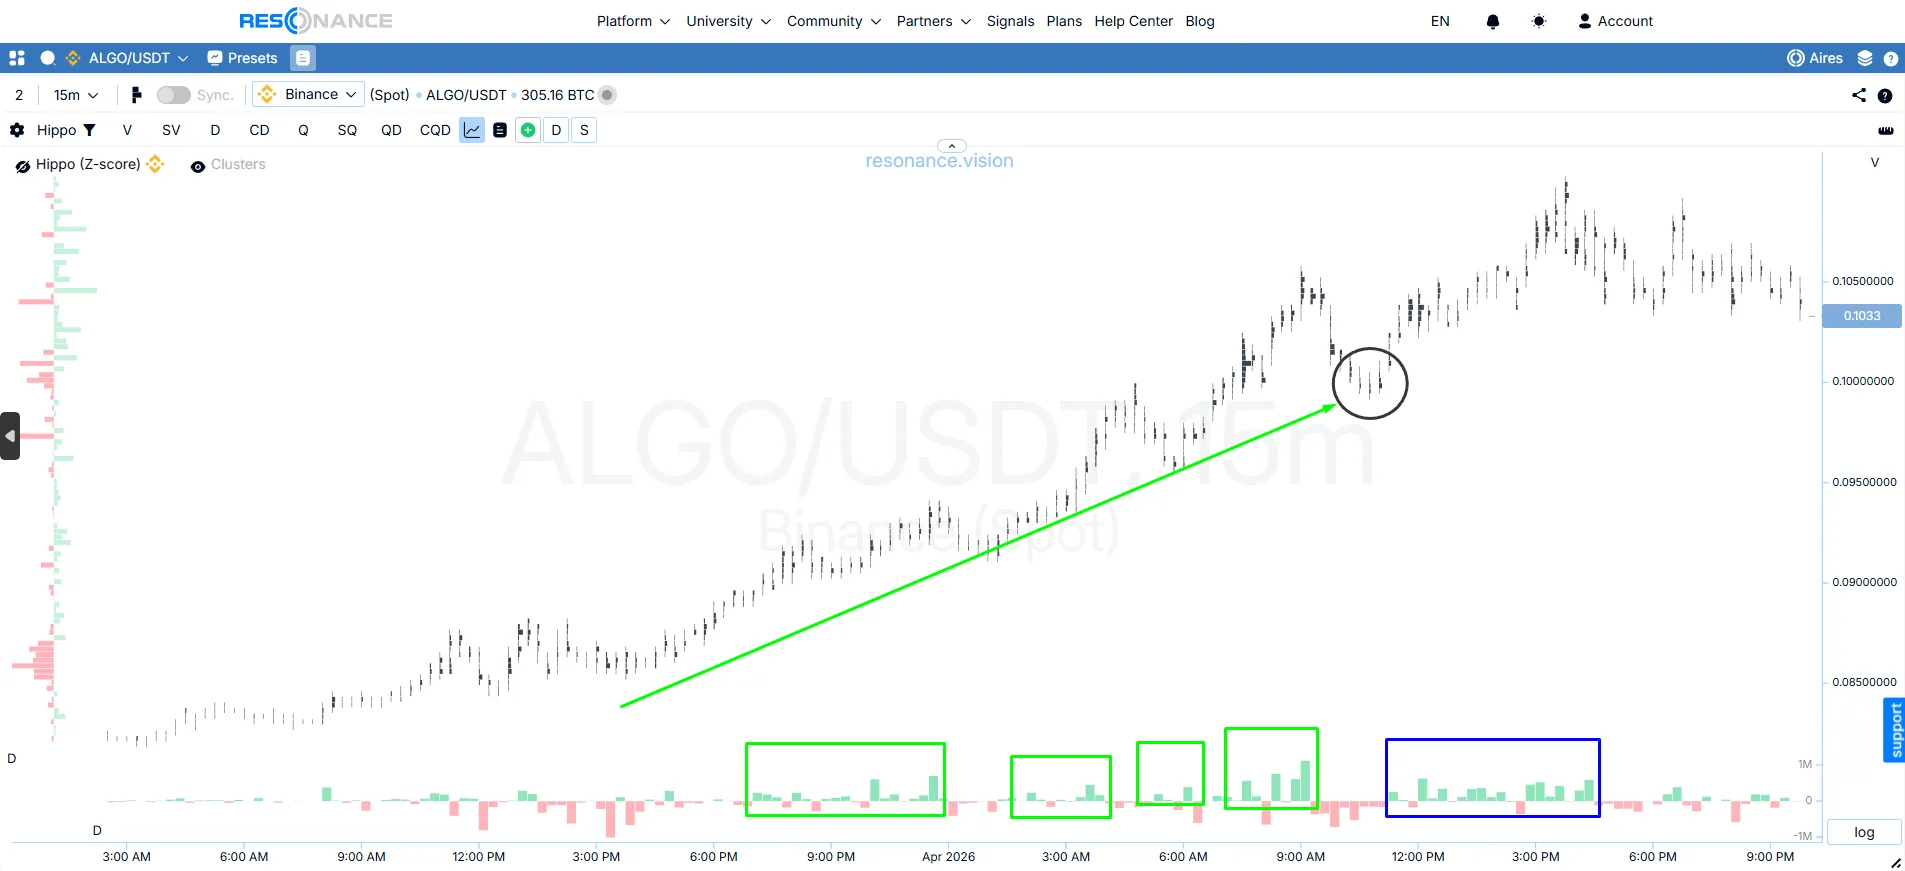
- Price approached the MA (blue arrow)
- This caught your attention
- Analyze volume
- Evaluate the price reaction
- Only then consider the trade
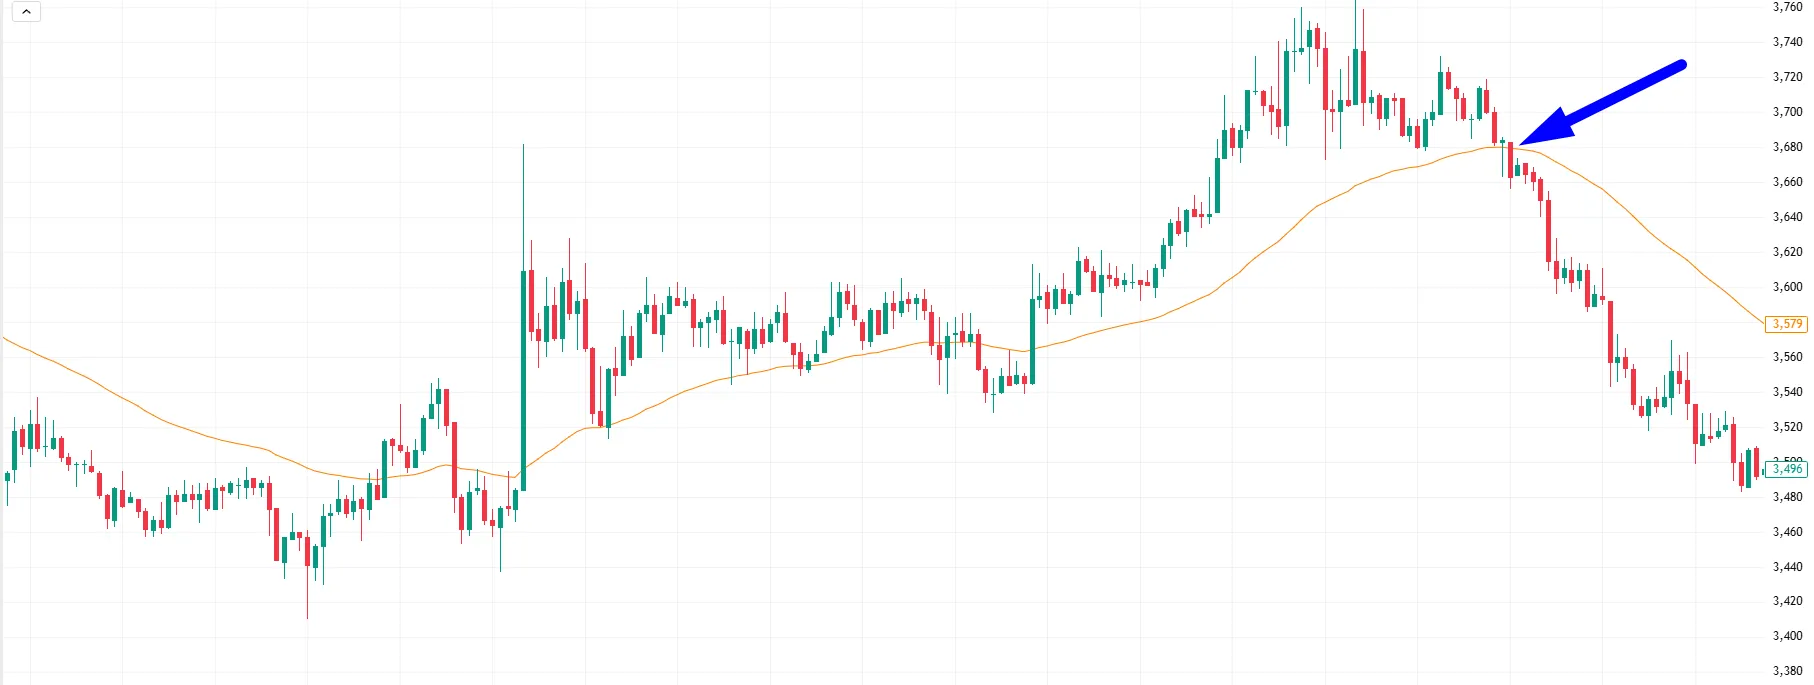
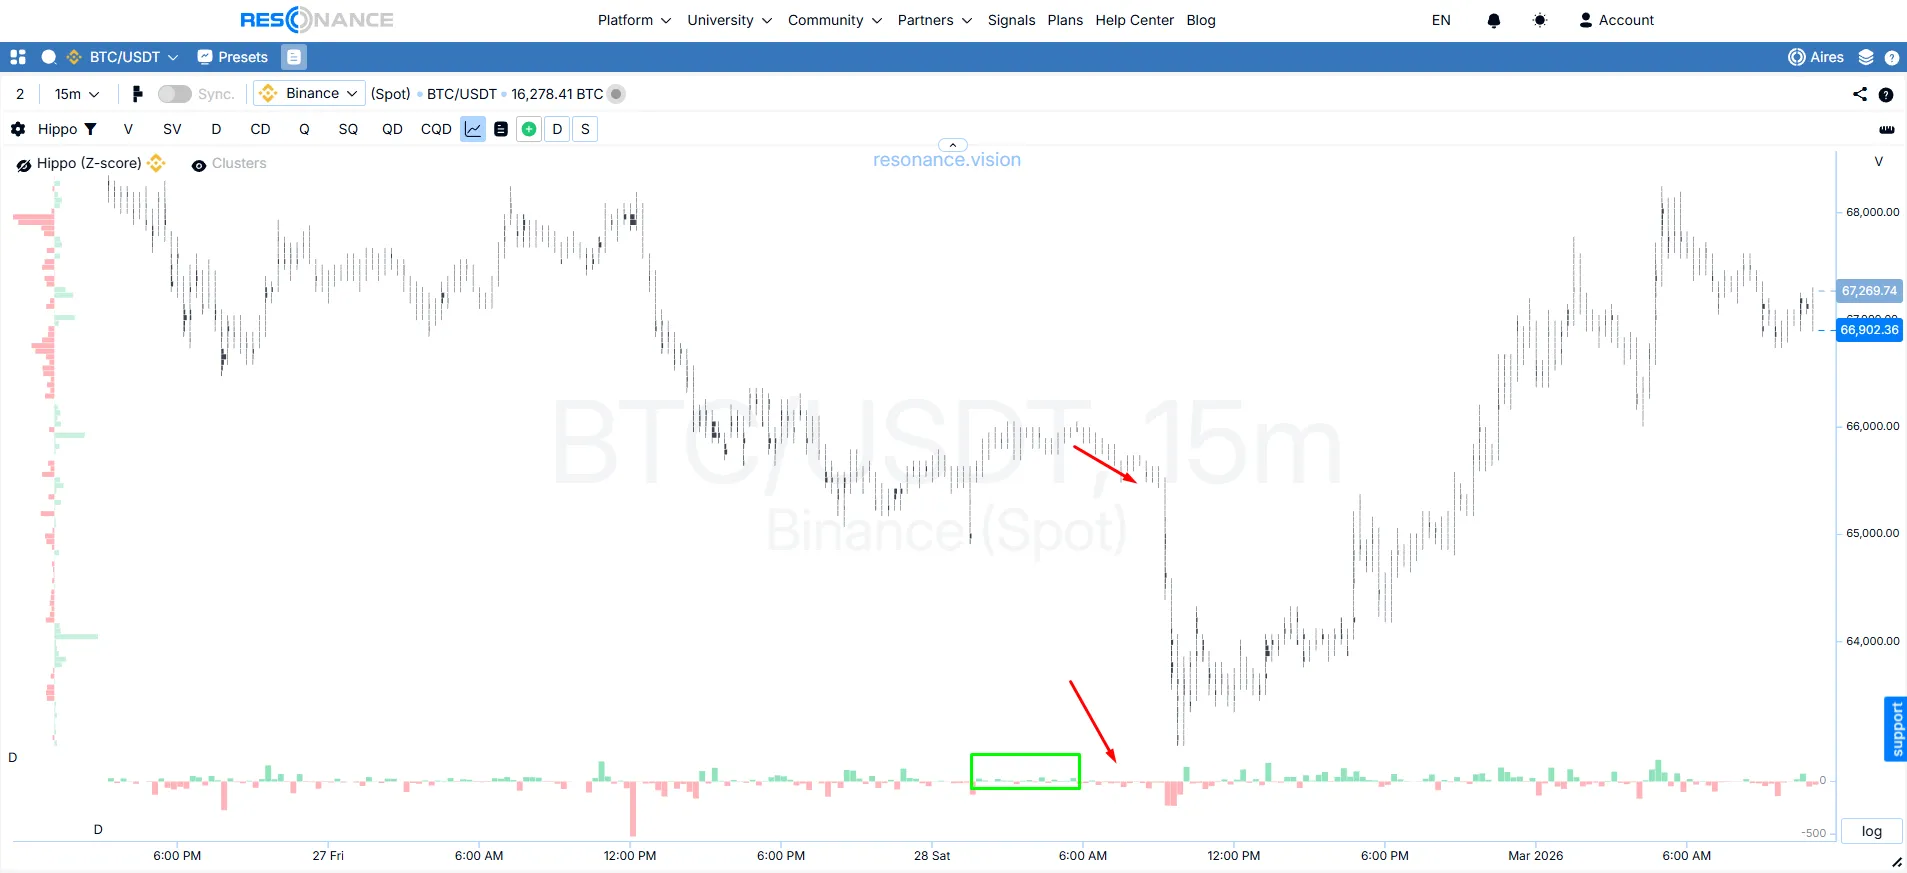
What do we see on the cluster chart? At the local high (red line), there was significant effort from market buyers — visible from the large green delta (green arrow) — but the high was not updated, and price began to decline on relatively small market selling (red boxes). This suggests the buyer is weak and a surplus has formed. That surplus eventually leads to lower prices (which is exactly what happened).
Did price cross the MA, return to it, or bounce off it? By itself, this still doesn’t decide anything. It is only a reason to look at what is happening inside the move.
Thus, the moving average neither confirms nor cancels a trade. It simply marks an area on the chart where you can move on to more meaningful analysis — through the cluster chart, delta, and price reaction to volume.
On the cryptocurrency market, this is especially important. When you look deeper, you can see whether real demand or supply stood behind the move.
The working logic is simple: first — volume, imbalance, and price reaction; then — a scenario-based conclusion. In this chain, the MA explains nothing — it only draws attention to the zone.
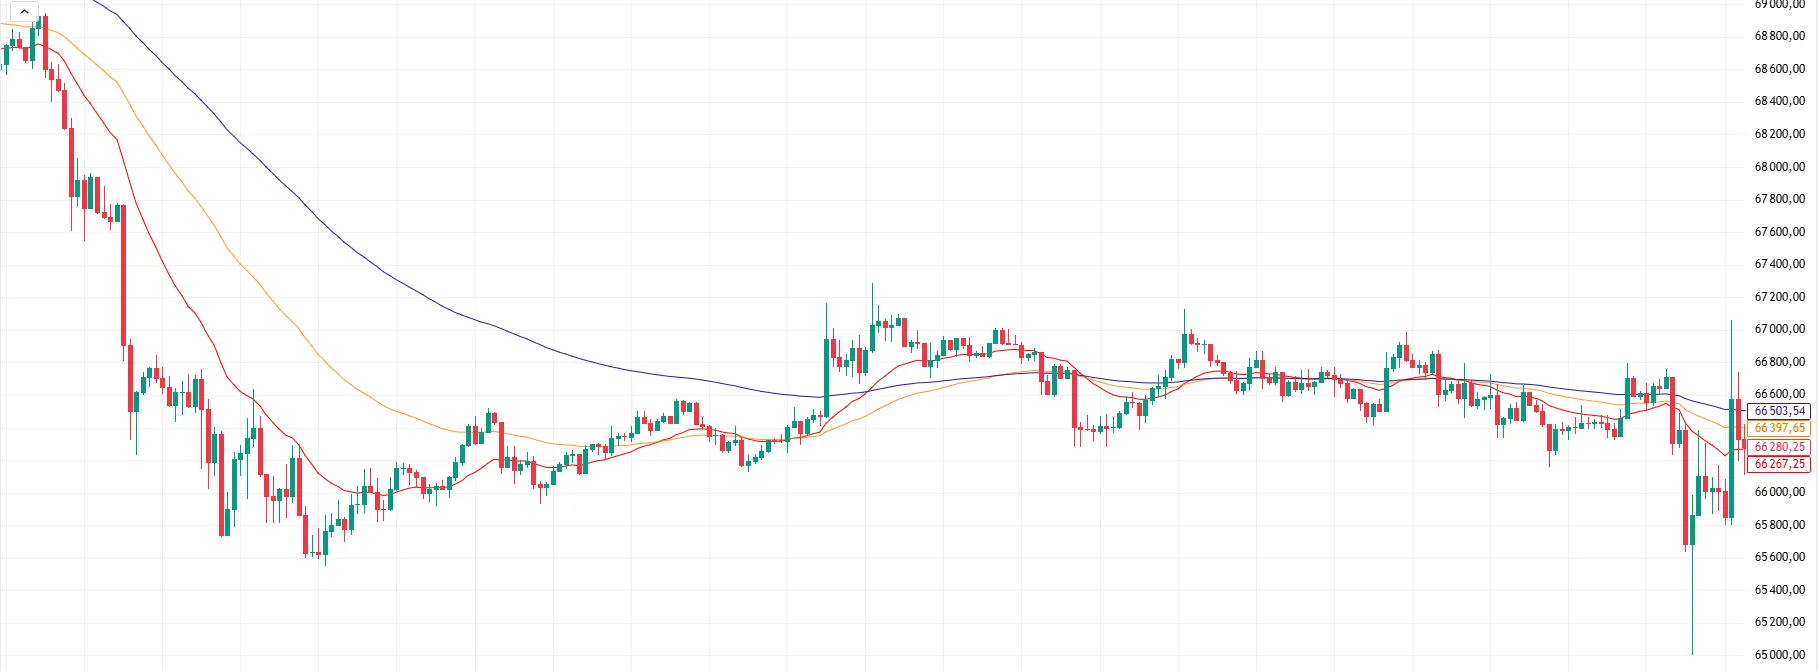
Moving Average: Confirmation of an Uptrend
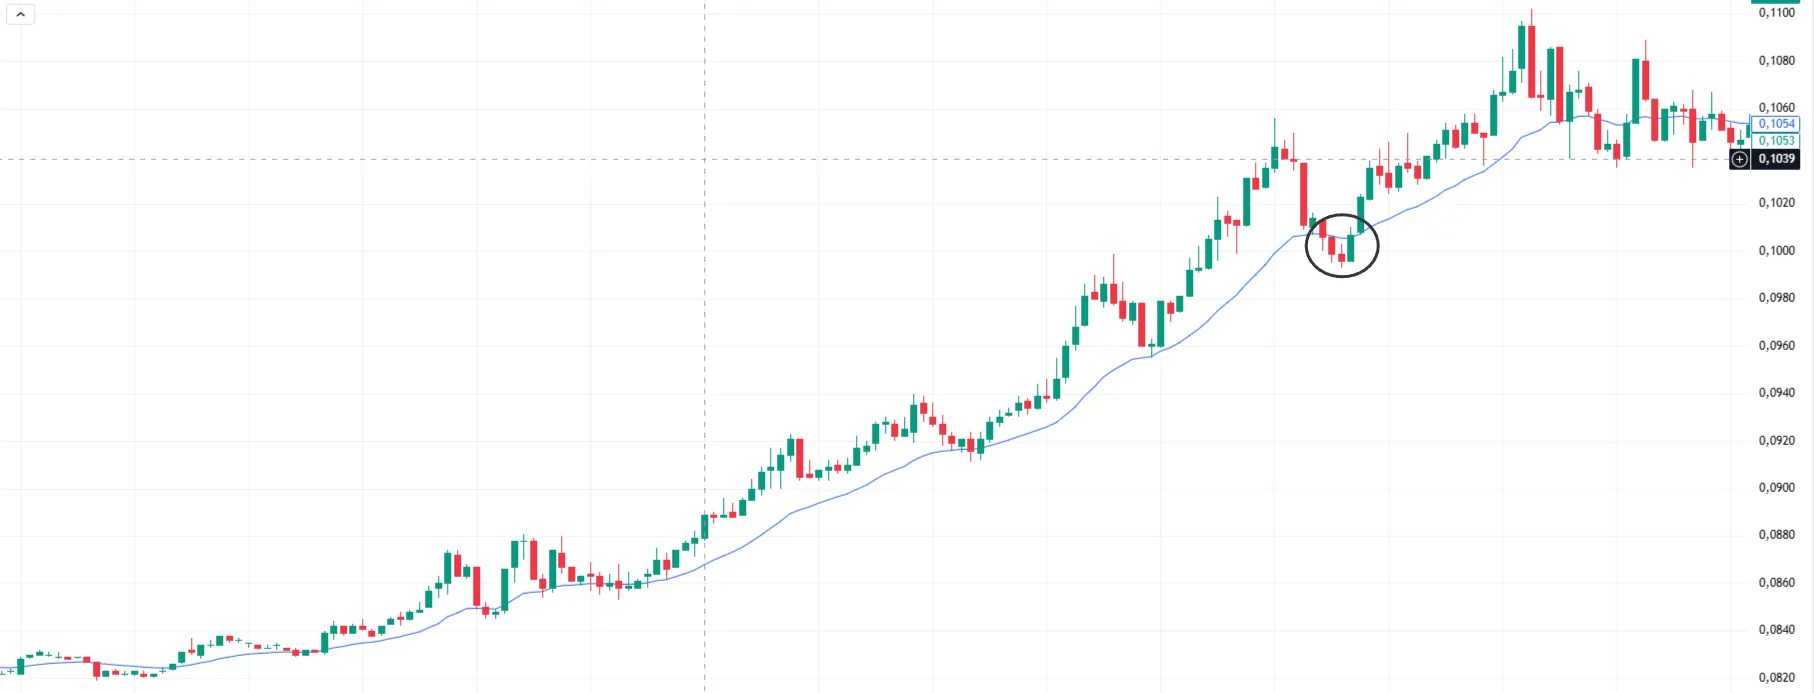
Formally, the chart shows price rising above the MA. For many, this would already look like sufficient confirmation of continued movement.
But the key point here is not the position of price relative to the average.
On the cluster chart, you can see that market selling produced no result — the low was not updated (red line and arrows) — while market buying is delivering results: buyer initiative is not being extinguished, and the move continues. Price reacts with upside, and this already confirms the strength of demand.
In other words, in this example the rise occurred not because price is above the MA, but because demand is confirmed by analysis of traded volume and price reaction. The moving average acts as a trigger, while delta confirms the move.
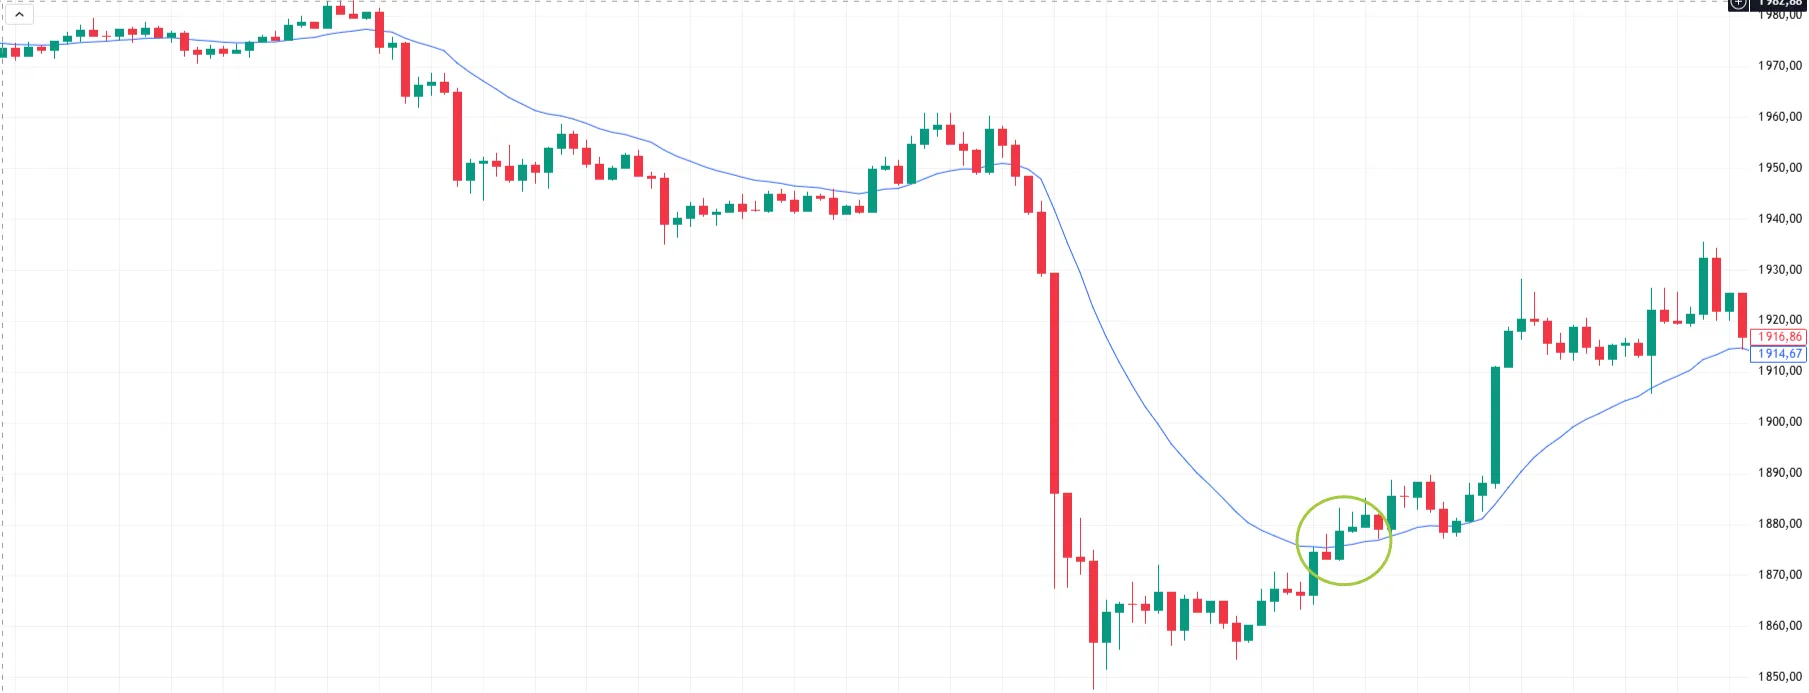
Moving Average: Confirmation of a Downtrend
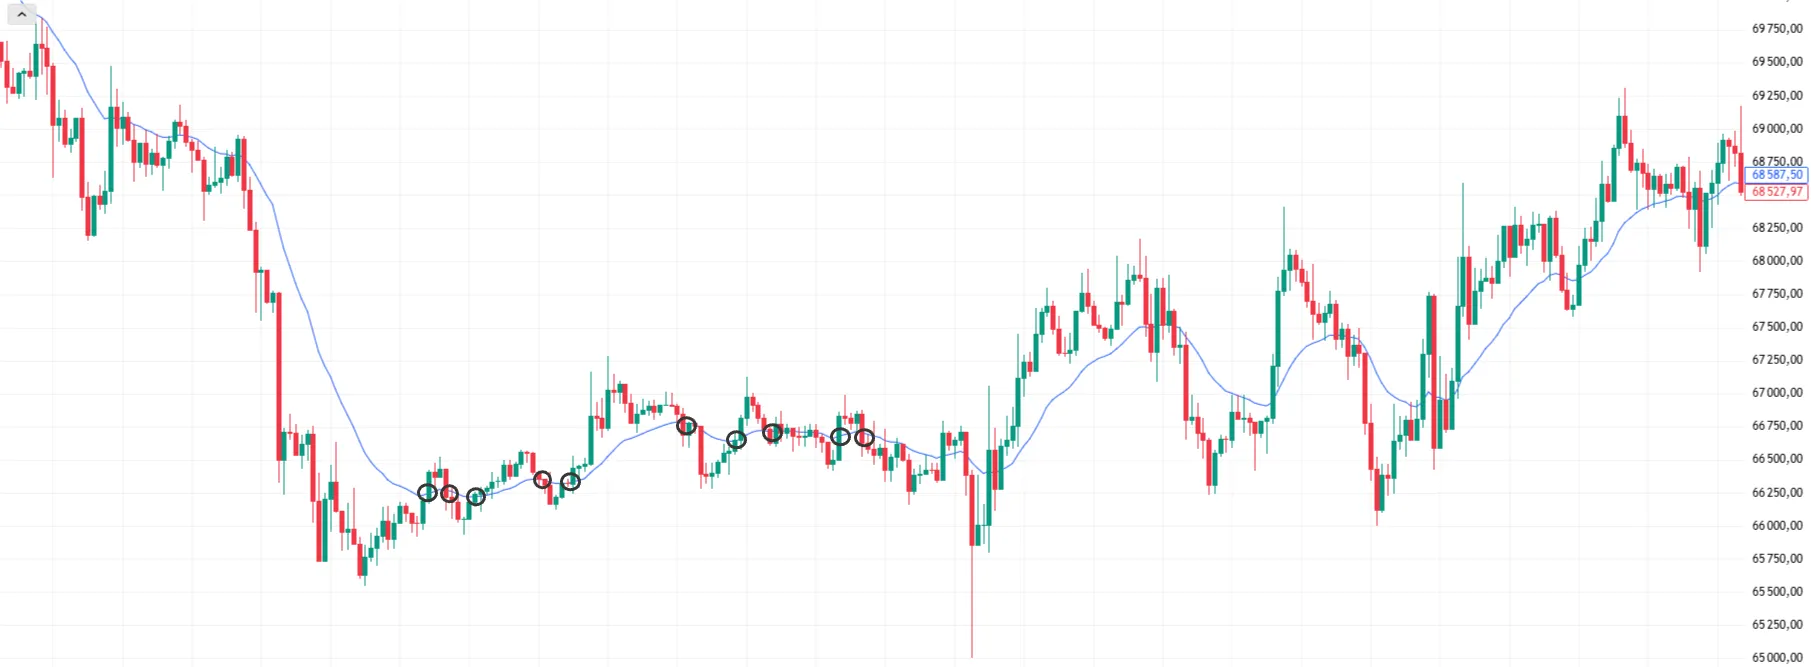
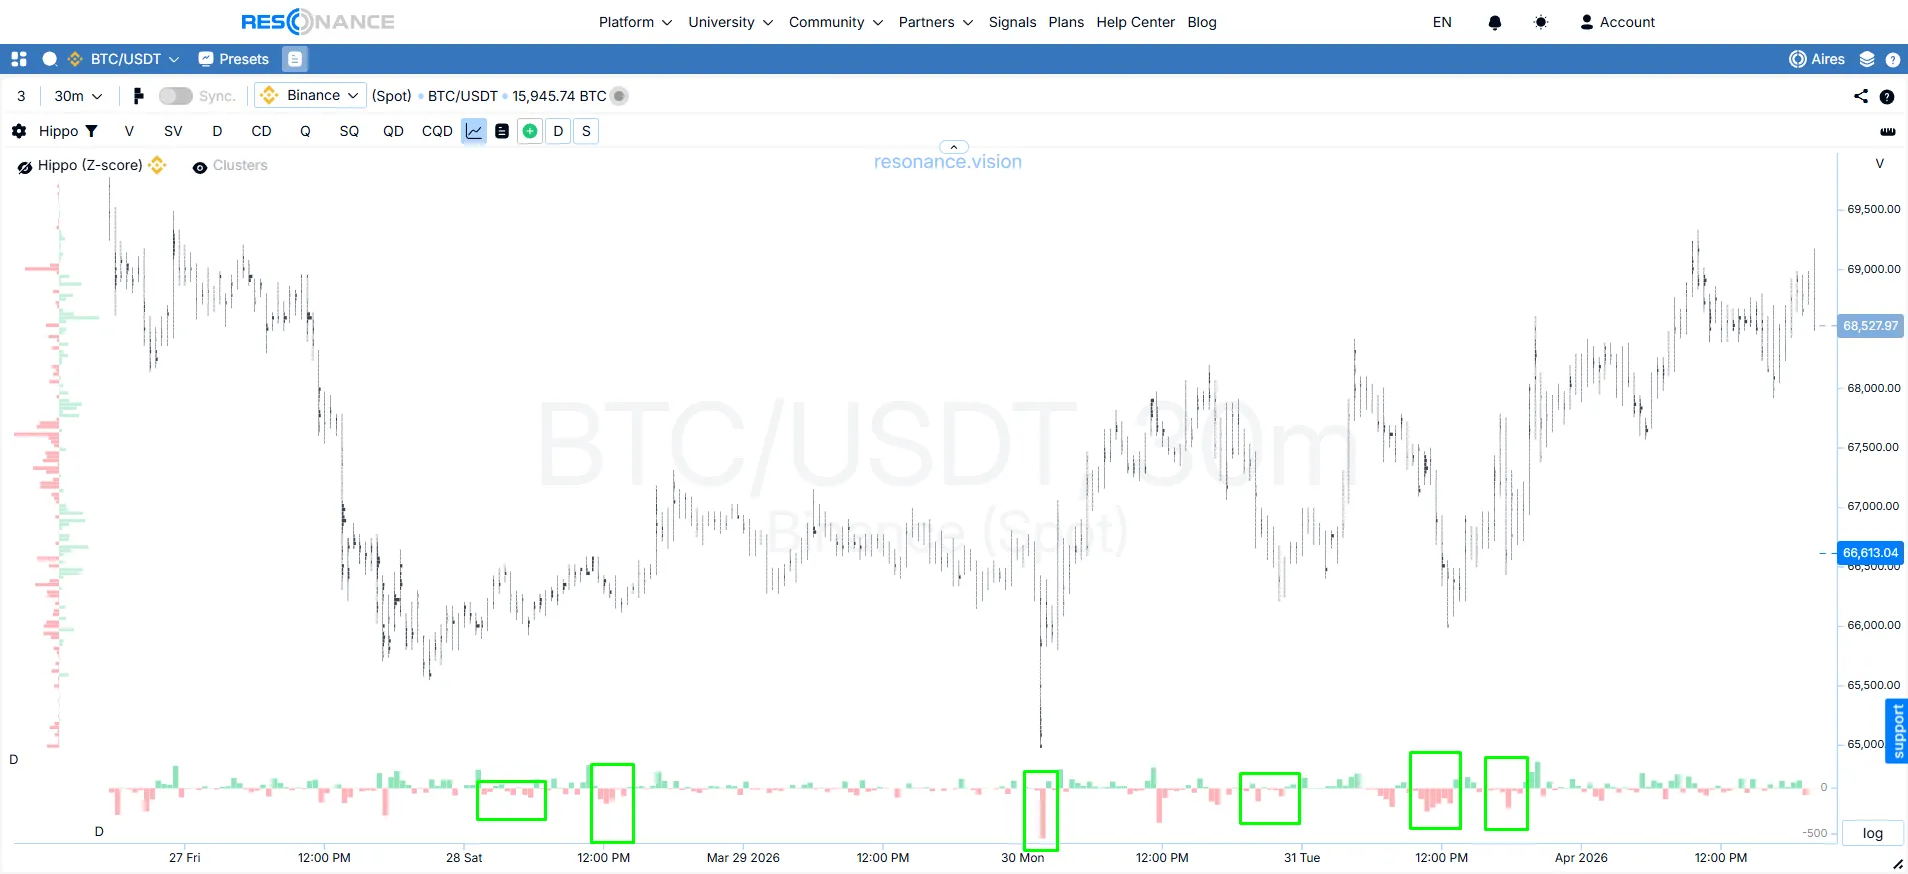
Formally, price is below the MA, and this may look like a standard signal of weakness.
But what matters here is not the position relative to the average, but the behavior of participants inside the move.
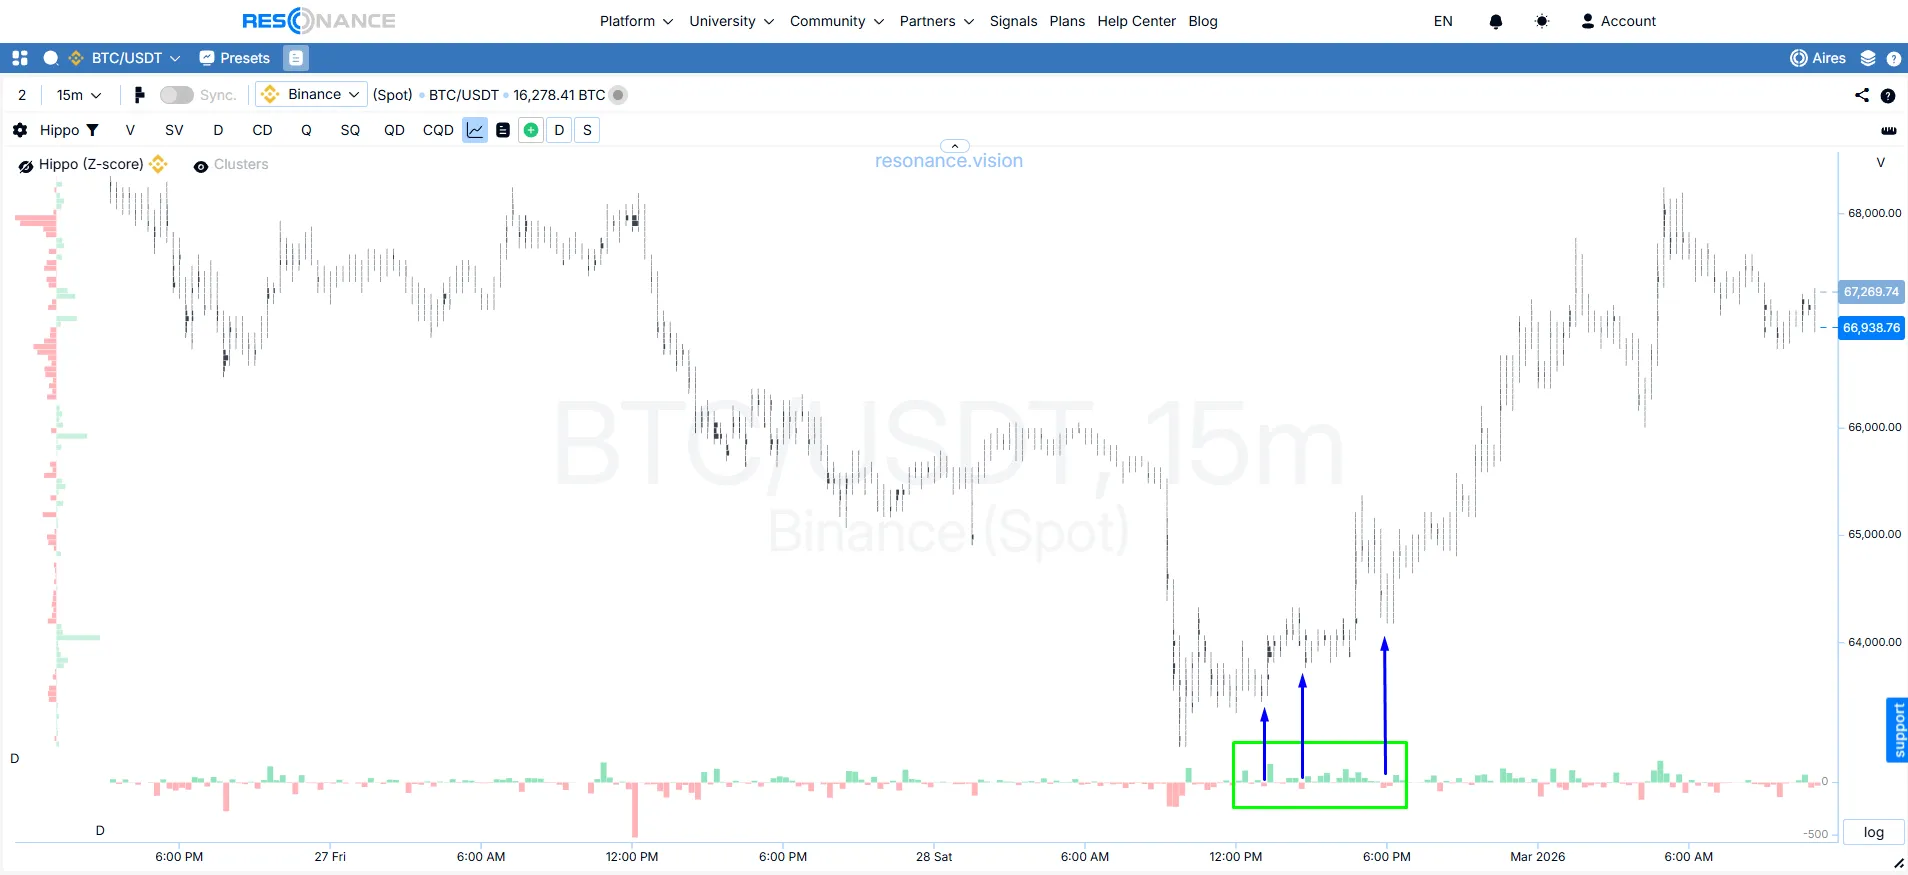
Fact: price is below the MA (green circle). In this context, the best signal is not the cross itself, but the market’s reaction to aggressive buying. Next, we move to demand and supply analysis.
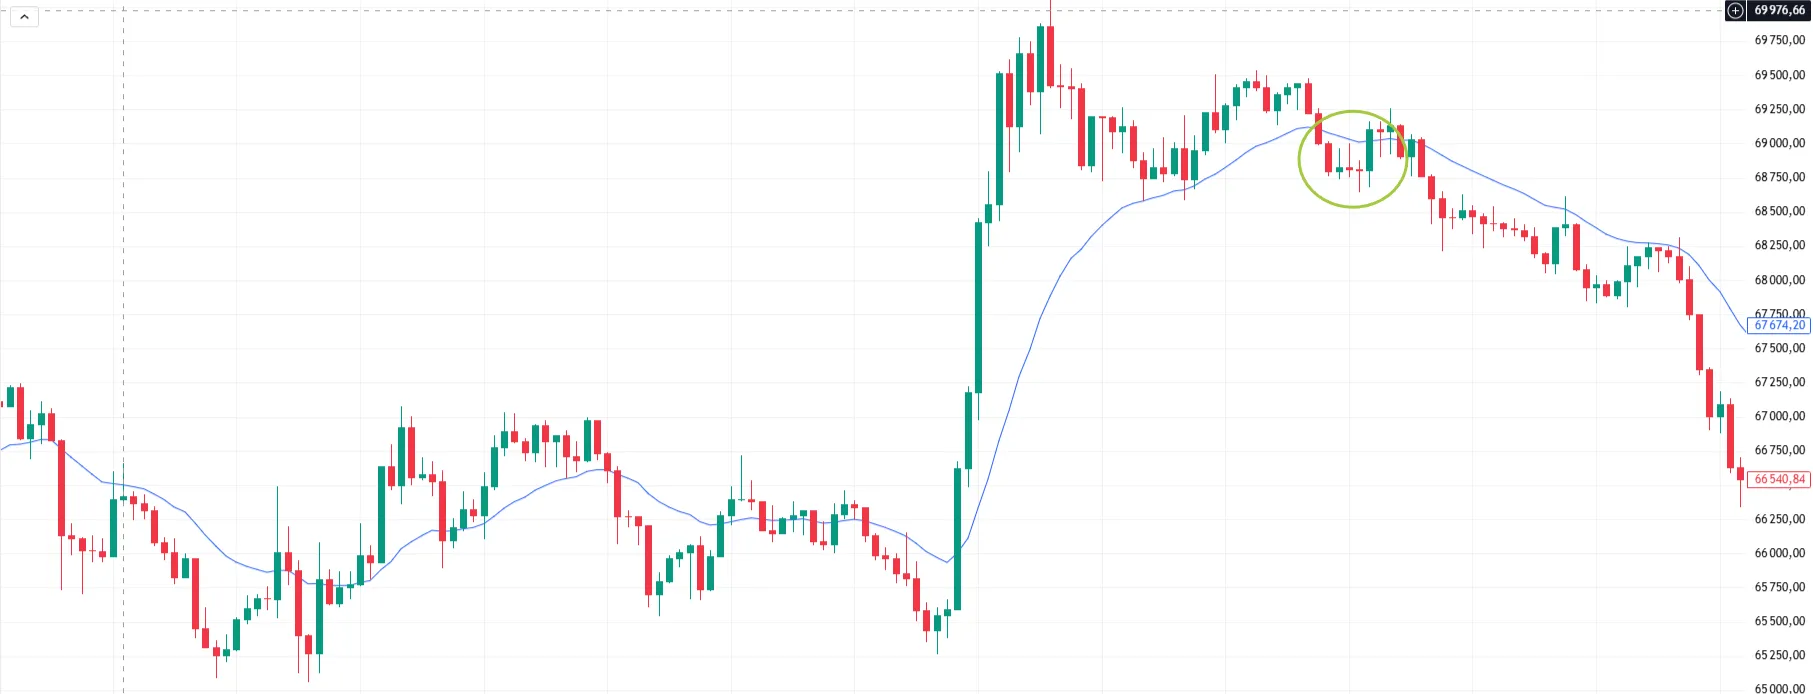
Volume analysis: Despite buying (green rectangles), price is not updating local highs (green line). The buyer is present but not achieving results. Selling is increasing (red rectangles), and price is declining.
This already shows that buyer initiative is weakening while the seller is gradually taking control. The downward move is confirmed by analysis of market volume.
That is why the decline here is confirmed not by the MA line, but by how price reacts to volume.
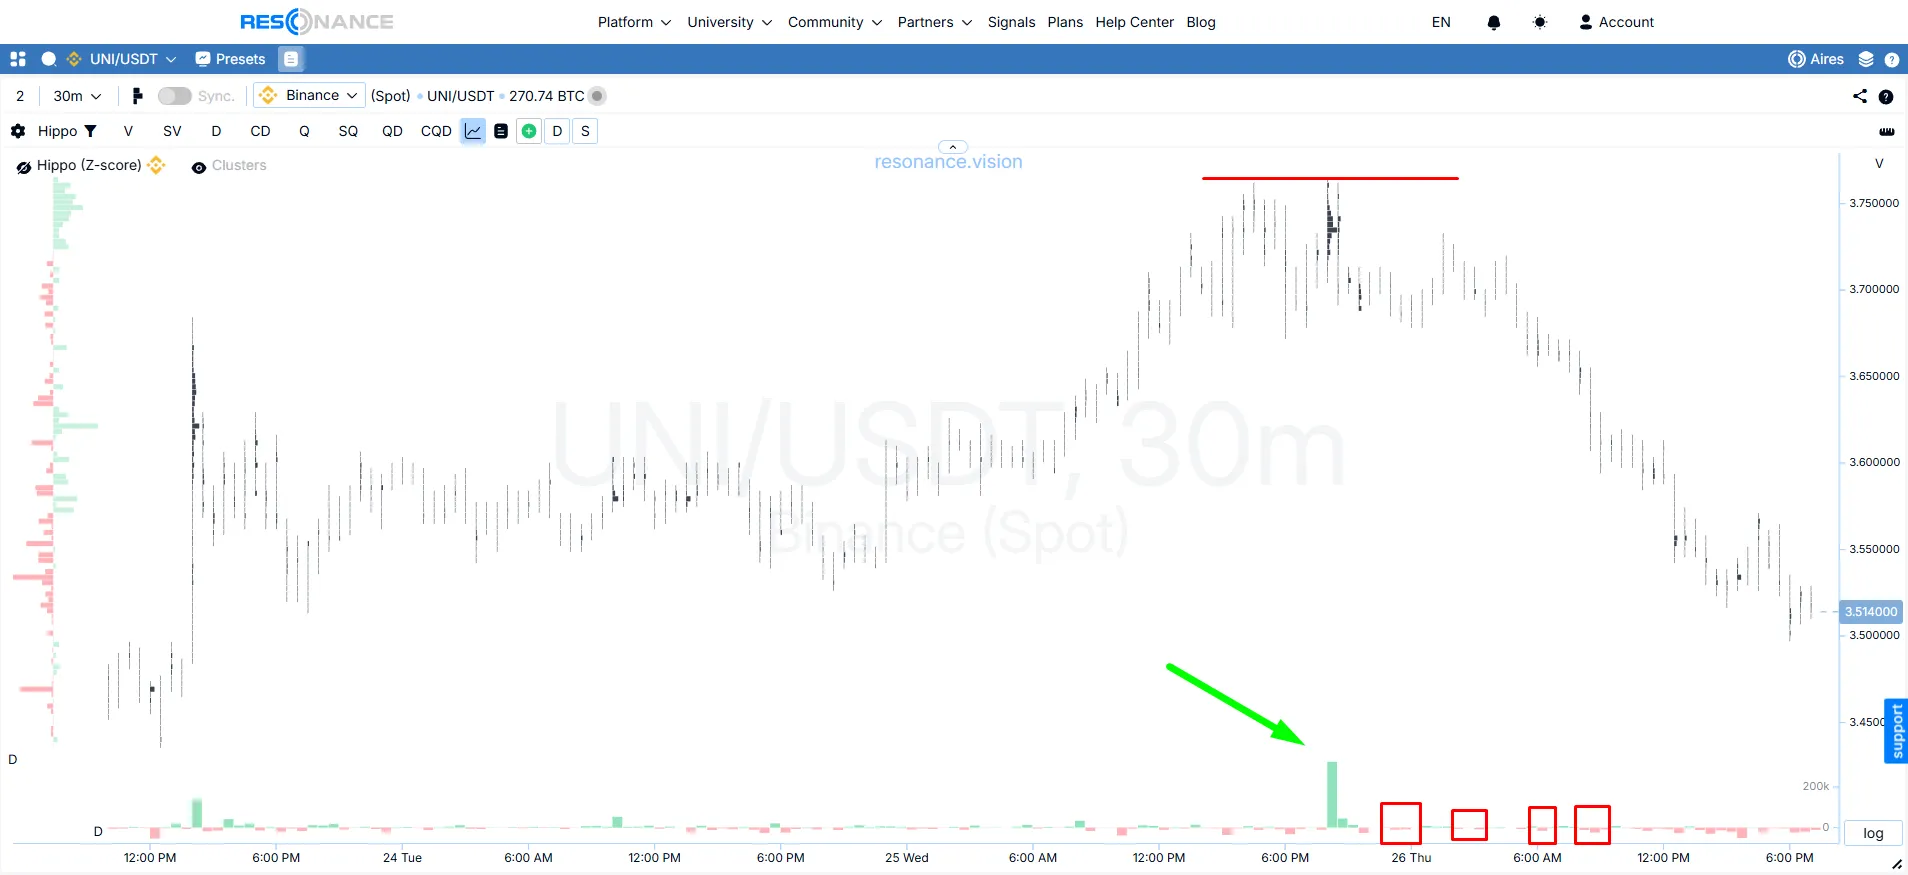
Moving Average: False Breakout
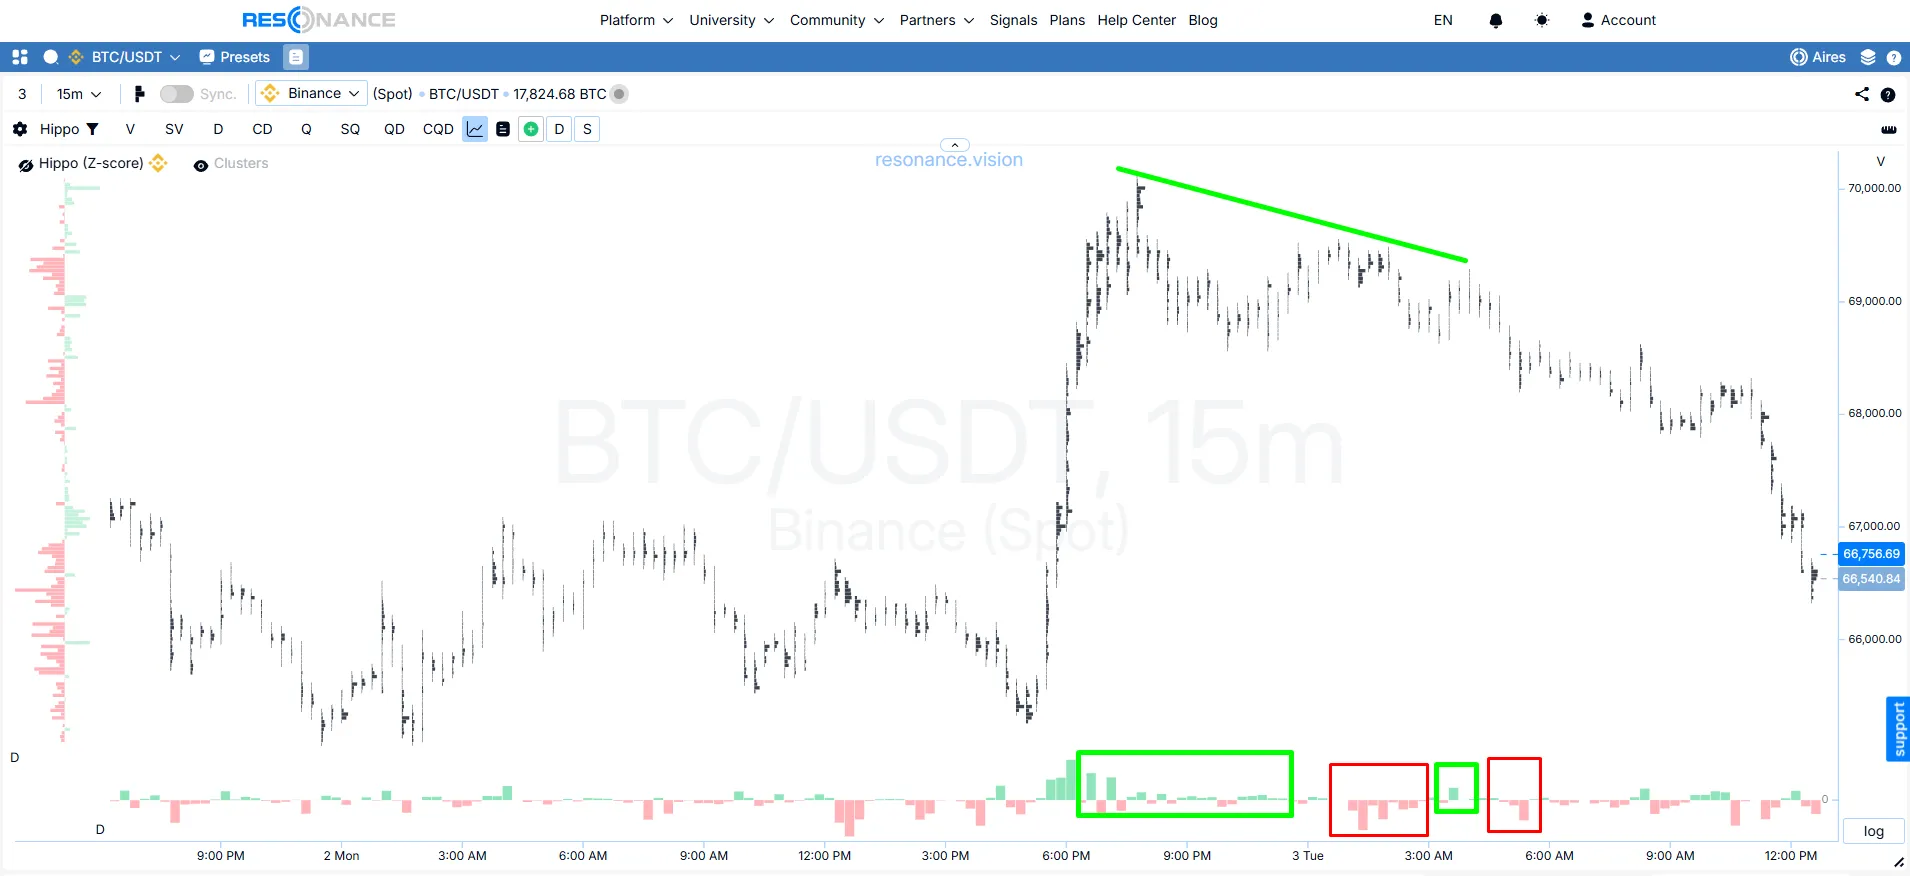
On a chart with a moving average, this situation may look like a downside breakout.
If you look only at the MA, it’s easy to jump to the hasty conclusion that the uptrend is breaking and the move will continue lower (white circle).
Fact: price moves below the MA. The best way to read this kind of setup is through volume and price reaction, not through the MA alone.
Volume analysis: Context is important. The cluster chart shows a different picture. The buyer is active and price is rising (green rectangles and arrow). The trend remains upward, and after a small decline the buyer continued pushing price higher with market orders (blue rectangle).
The downside signal from the moving average is not confirmed.
It turns out that the MA itself often pushes toward a premature conclusion, while volume analysis helps you see that the breakout was not confirmed by the actions of market participants.
Moving Average: Ranging Market
In a range, price constantly crosses the MA, but these crosses by themselves provide no value.
If you look only at the line, the chart looks noisy and ambiguous. Formally, signals exist, but there is no directional movement.
Fact: price constantly crosses the MA. No directional movement.
Volume analysis: On the cluster chart, we can see how market selling is being absorbed. Participants are building a deficit (buying pressure), and the probability of an upside move is increasing.
In intraday trading and scalping, the moving average often reacts too slowly, because price can cross the line several times before real demand or supply is confirmed by volume.
In contrast, the cluster chart allows you to see what is invisible on the MA: whether market selling is being absorbed, whether a deficit is forming, and whether one side is gaining an edge.
In other words, where the moving average gives a series of weak visual signals, demand and supply analysis can already reveal a well-founded trading idea. In practice, trading with moving average alone often leads to delayed entries and weak decisions because the line does not show what is happening inside the move.
Workflow Algorithm
If for some reason you still look at the MA, use it not as the basis for decisions, but as a secondary reference. The core analysis and strategy should be built on different logic. For cryptocurrency trading, the best tool is the one that helps you see demand, supply, and imbalance early.
Step 1. Determine the context.
Understand which phase the market is in: is there directional movement or are we in a range?
Step 2. Mark the point of attention.
Price has approached the MA, crossed it, or returned to it after an impulse. This is not yet a signal — it’s only a reason to look closer.
Step 3. Check volume.
Is there activity in the move? Does one side have an advantage? Is there anomalous volume?
Step 4. Evaluate the price reaction to effort.
Does the effort of the more active market participant produce a result? Does the price move get follow-through?
Step 5. Look at clusters and delta.
Are there signs of imbalance, absorption, deficit (buying pressure), or weakening on one side?
Step 6. Draw a scenario-based conclusion.
Only after this can you decide whether there is a real trading idea here or just another superficial line cross without meaningful confirmation.
Moving Average: Common Trader Mistakes
Mistake 1. Treating an MA cross as a ready-made signal.
The mere fact of a cross says nothing on its own. MA crosses happen constantly, especially in ranges. Without market context and a proper strategy, such entries turn into a series of random trades with no edge.
Mistake 2. Ignoring the effectiveness of volume relative to price change.
High volume without result is already important information — and you cannot ignore it. What looks like a trend is not always one. Without evaluating price reaction to volume, it’s easy to get caught in a weak or false move.
Mistake 3. Searching for the “perfect” MA period instead of analyzing market mechanics.
Trying to fine-tune settings does not improve analysis and does not solve the problem of losing trades. In crypto trading, what matters is not the length of the MA, but understanding what is happening with demand and supply.
Mistake 4. Reading a range through an averaged price line.
In a trend, the MA can serve as an attention trigger, but in a range it loses meaning. Without understanding the market phase and analyzing demand/supply, the trader has no edge over other market participants.
Mistake 5. Looking at price in isolation from demand and supply.
The MA does not predict the future — it only shows the past. Attempting to build forecasts based solely on it leads to lagging and often unprofitable trading decisions.
Conclusion
The moving average can indeed simplify visual perception of the chart. But this alone is no longer enough to deeply understand the market. The moving average is a limited and outdated indicator.
Today, traders have access to far more meaningful data: volume, clusters, delta, and market anomalies. These tools allow you to see not just price change, but what caused it.
Therefore, the sooner your analysis shifts from lines on the chart to demand and supply, the closer you get to a real understanding of market mechanics and a more profitable trading strategy.
The moving average can help a beginner see the direction of movement (trend), but it does not show when that move may end. Without volume analysis, it produces lagging and noisy signals.
For intraday trading and scalping, cluster charts, delta, and volume analysis usually provide more useful signals than a smoothed indicator like the moving average.
When the goal is not just to describe the chart, but to understand what is really happening in the market and to make money, advanced cryptocurrency market analysis tools provide much more.
Follow new insights in our telegram channel.
No need to invent complex schemes and look for the "grail". Use the Resonance platform tools.
Register via the link — get a bonus and start earning:
OKX | BingX | KuCoin.
Promo code TOPBLOG gives you a 10% discount on any Resonance tariff plan.
Recommended articles


