Crypto Scalping: How to profit from every market move

Dive into the world of active crypto trading by exploring one of the most exciting yet challenging strategies — crypto scalping. If you want to learn how to profit from the smallest market moves, understand supply and demand, and master the best scalping trading tools to spot short-term trends — this is the material for you.
Table of contents
- 01What is scalping and what makes it unique?
- 02What is spoofing and how to avoid it?
- 03How to analyze data: trigger and analytical signals
- 041. Trigger — attention signal
- 052. Analysis:
- 063. Action:
- 07Speed Print tool: how to use it to find trade ideas
- 08Risk Management: How to Control Risk?
- 09Finding Trade Ideas: Where and How?
- 10Frequently asked questions (FAQ)
- 11Conclusion

In this article, we’ll break down what intraday scalping is, which analytical tools to use for effective trading, how to build a solid strategy, and how to spot short-term trends in crypto. We’ll also cover essential concepts such as cluster charts, delta, limit orders, the Speed Print scanner, and heatmaps. And of course, we’ll provide recommendations on trading, risk management, and finding crypto trade ideas.
What is scalping and what makes it unique?
Scalping is a trading strategy where positions are opened and closed extremely quickly, sometimes within seconds or minutes. The goal is to profit from tiny price movements, enough to cover fees and make a small gain.
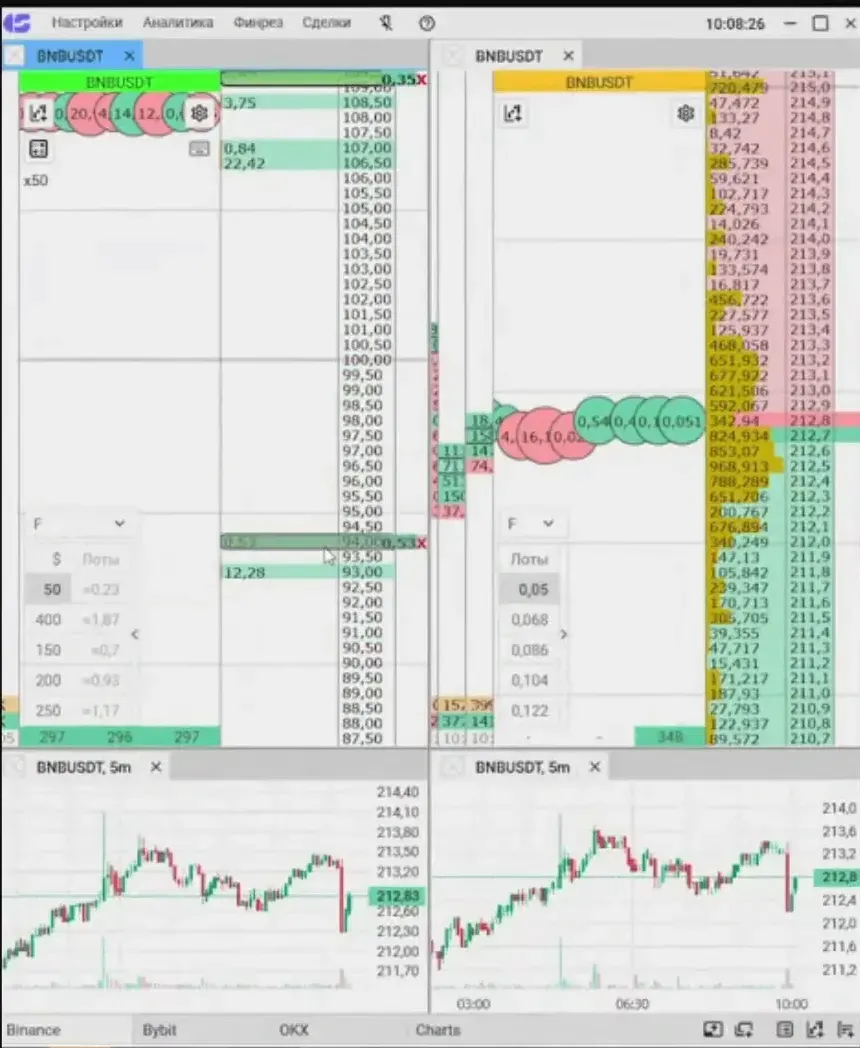
Imagine a trader closely watching the order book, spotting large limit buy or sell orders and assuming they won’t be “broken through.” The trader places orders just before those large limits to “bounce” off them and profit from minimal price movement.
This is a very active process requiring constant attention, fast reactions, and technical skills. Scalpers often use special trading terminals connected to crypto exchanges at maximum speed. However, due to public connections and many users, the competition here is intense.
The classic image of a scalper is one who monitors dozens of order books simultaneously, reacts quickly to large limit orders, and opens/closes positions instantly. It resembles a gambling game with constant action, requiring intense focus. But such techniques aren’t the most effective for making money. Here’s why.
What is spoofing and how to avoid it?
One common mistake among scalpers is over-trusting large limit orders in the order book. Not all of them reflect real demand or supply.
Spoofing is a manipulative technique where a market participant places large limit orders to create the illusion of strong interest in buying or selling. The goal is to provoke others to act in the desired direction. Once the market moves, these orders are canceled, and the spoofer trades in the opposite direction — for example, sells where everyone expects growth.
“Walls” or “blocks” are large limits that appear as strong support or resistance. But if no trades are executed behind them, it could be a trap.
How to spot spoofing:
- Heatmap shows large limits, but the cluster chart shows no execution volume
- Limit orders disappear when the price approaches
To avoid spoofing, rely not just on limits but on actual trade execution — confirmed by volume, delta, and trade count.
How to analyze data: trigger and analytical signals
Not all data is equally important. We divide it into two types:
- Trigger data: signals that draw attention to an asset or situation. These can be large limits, order speed, news, or Telegram signals.
- Analytical data: deep analysis done after noticing the trigger. Here we compare accumulation, delta, price and volume behavior to confirm or reject our price forecast.
This separation helps filter out noise and focus on validating trades using clear volume-based facts.
To succeed, you need a trading system with various strategies, techniques and a consistent logic of analysis.
3 steps to market analysis:
1. Trigger — attention signal
- Anomalies like:
– Sudden spike in trade count or speed in Speed Print
– Large limit volumes in Hippo heatmap
– Unusual limit dynamics in BAS
– Significant volume accumulation in FTT - News
- Telegram signals
2. Analysis:
- Are there signs of deficit or surplus?
- Are market participants acting effectively?
- Is there limit support or resistance?
- Are limits being hit by market orders or just spoofing?
3. Action:
- Open a position only after confirmation by traded volume
- Set a clear stop-loss
- Manage the trade: partial exit, adjust stop-loss, etc.
This logic helps avoid manipulation and react only to strong, confirmed market signals. The approach is universal and suits both beginners and experienced traders.
Scalping trading tools
Effective trading requires analytical tools that help understand market conditions and quickly open/close trades based on real-time changes.
Terminals and connections
Scalpers use trading terminals with ultra-fast exchange access. But due to public connections, many users compete for order execution, making trading harder.
Cluster charts
Cluster charts are key analytical tools. They show trade volume, buy/sell distribution for each candle, and help identify volume accumulations in real time. They’re very effective in spotting deficit and surplus states.
Key cluster chart terms:
- Volume — total traded volume (buy + sell)
- Delta — the difference between the volume of purchases and sales on the market. It is displayed as a coloured histogram: green - purchases prevail, red - sales prevail.
- Number — number of trades
- Delta by number — the difference between the number of buy and sell trades.
These metrics help understand market behavior and detect supply or demand.
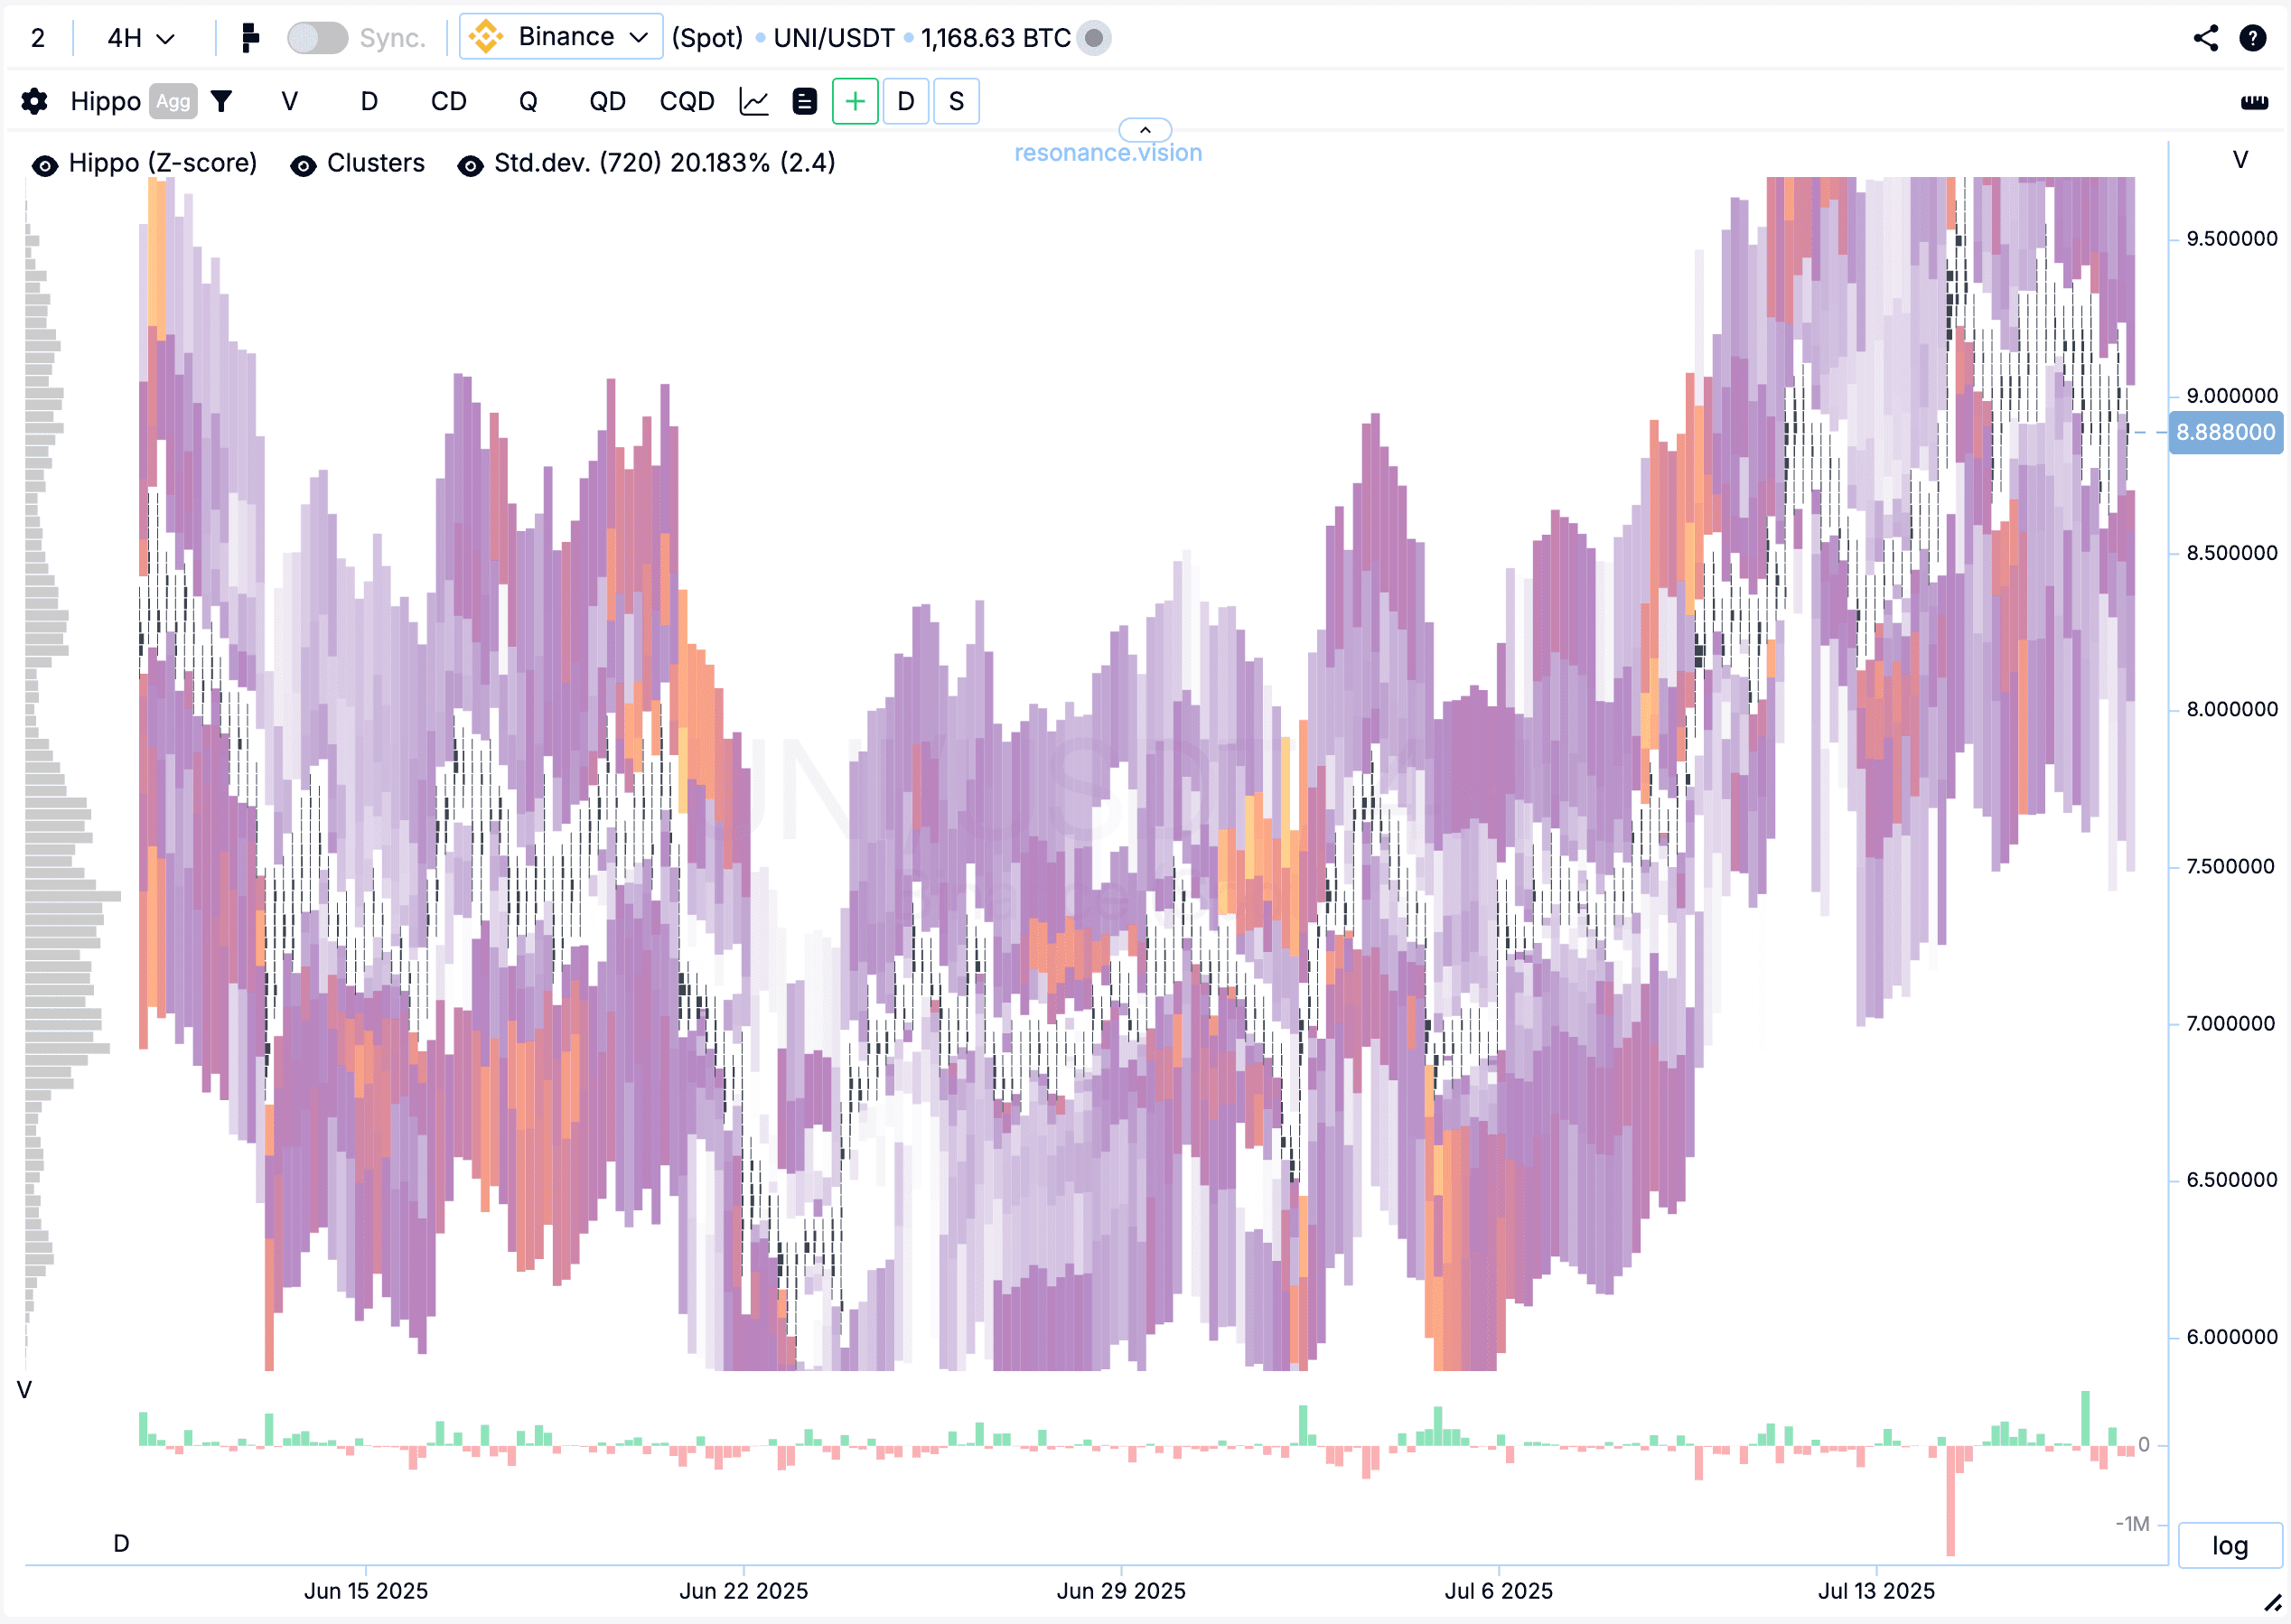
Heatmap
The heatmap shows the distribution of limit orders, displayed directly on the cluster chart window as colored zones. The brighter the color, the larger the limit volume at that price level.
Unique features of the Resonance platform heatmap:
- Aggregates data from multiple exchanges for a fuller picture of passive supply/demand
- Groups limits by percentage range and timeframe
- Anomaly mode (Z-score) showing how atypical the limit volume is in the current market
We explain heatmap-based scalping in detail in our follow-up article: “Hippo:
Limit-Based Trading Strategy” — be sure to check it out!
Speed Print tool: how to use it to find trade ideas
Speed Print is a powerful scalping trading tool that analyzes all trading pairs on the market, detecting anomalies in trade speed and count. This is not just another indicator. The search algorithm helps quickly identify potentially interesting trading situations.
Any scalping strategy requires fast and accurate analytical tools. Search algorithms help quickly trigger on abnormal market events and spot reversal patterns. The trader’s job is not to act immediately but to assess how volumes affect the asset’s price. Intraday scalping is no exception.
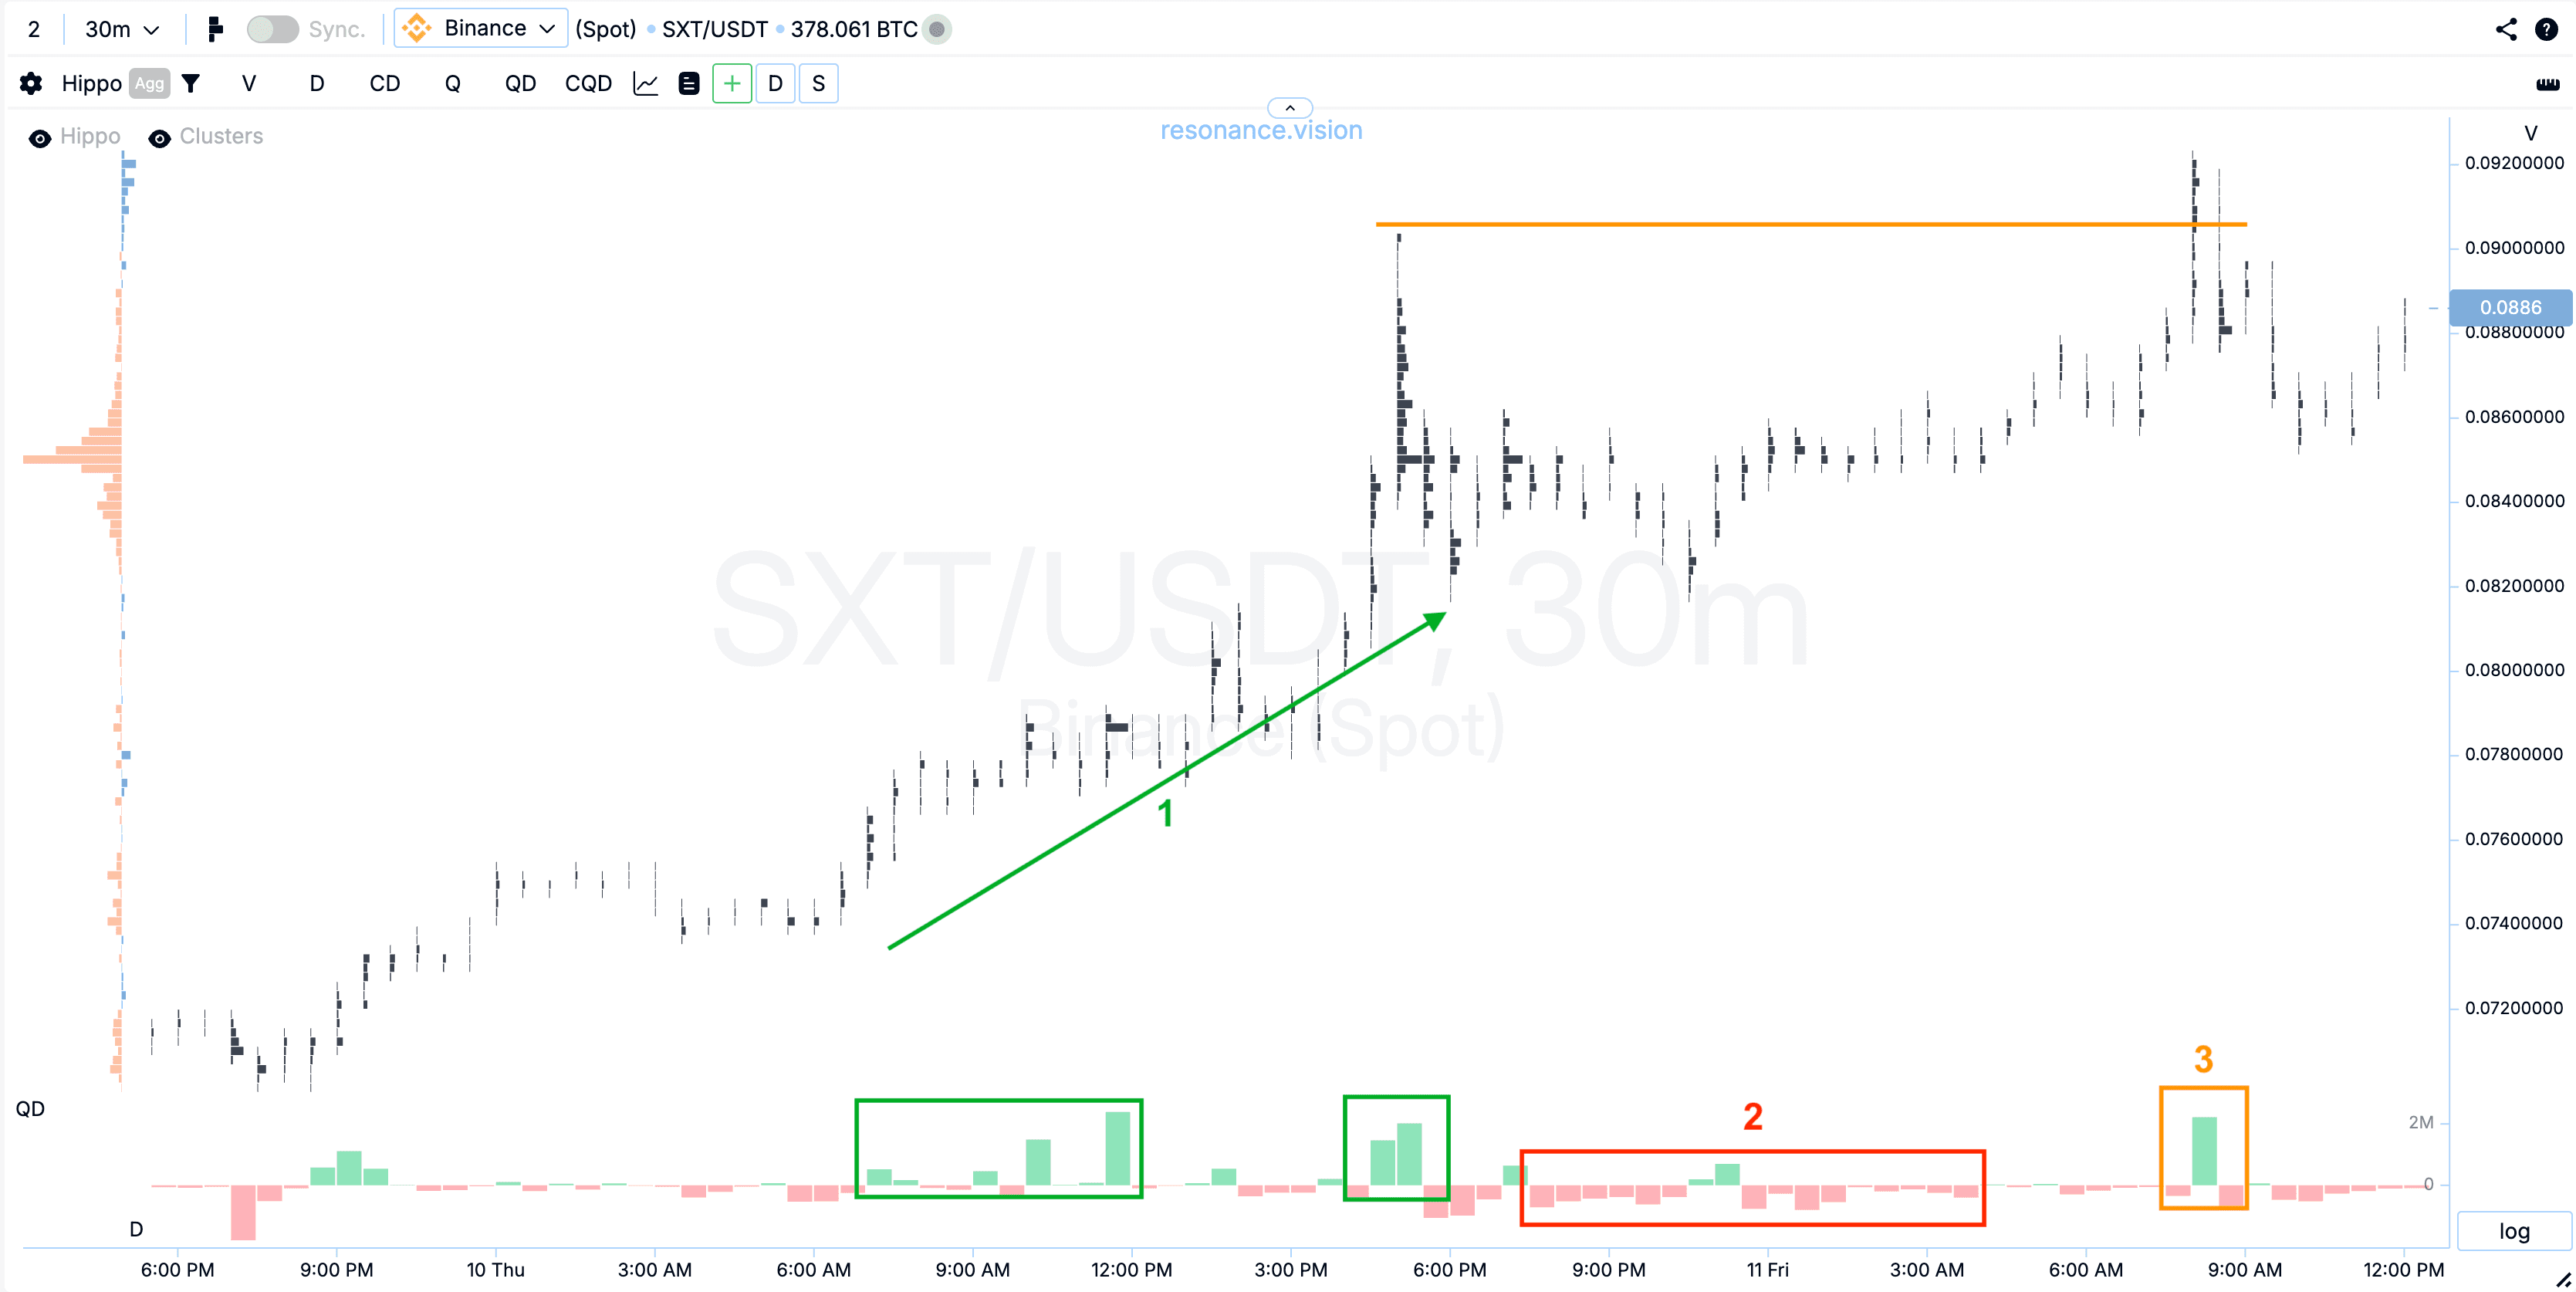
In this example, the Speed Print search algorithm detected an abnormal number of trades on the SXT coin. A detailed analysis revealed the formation of a local deficit:
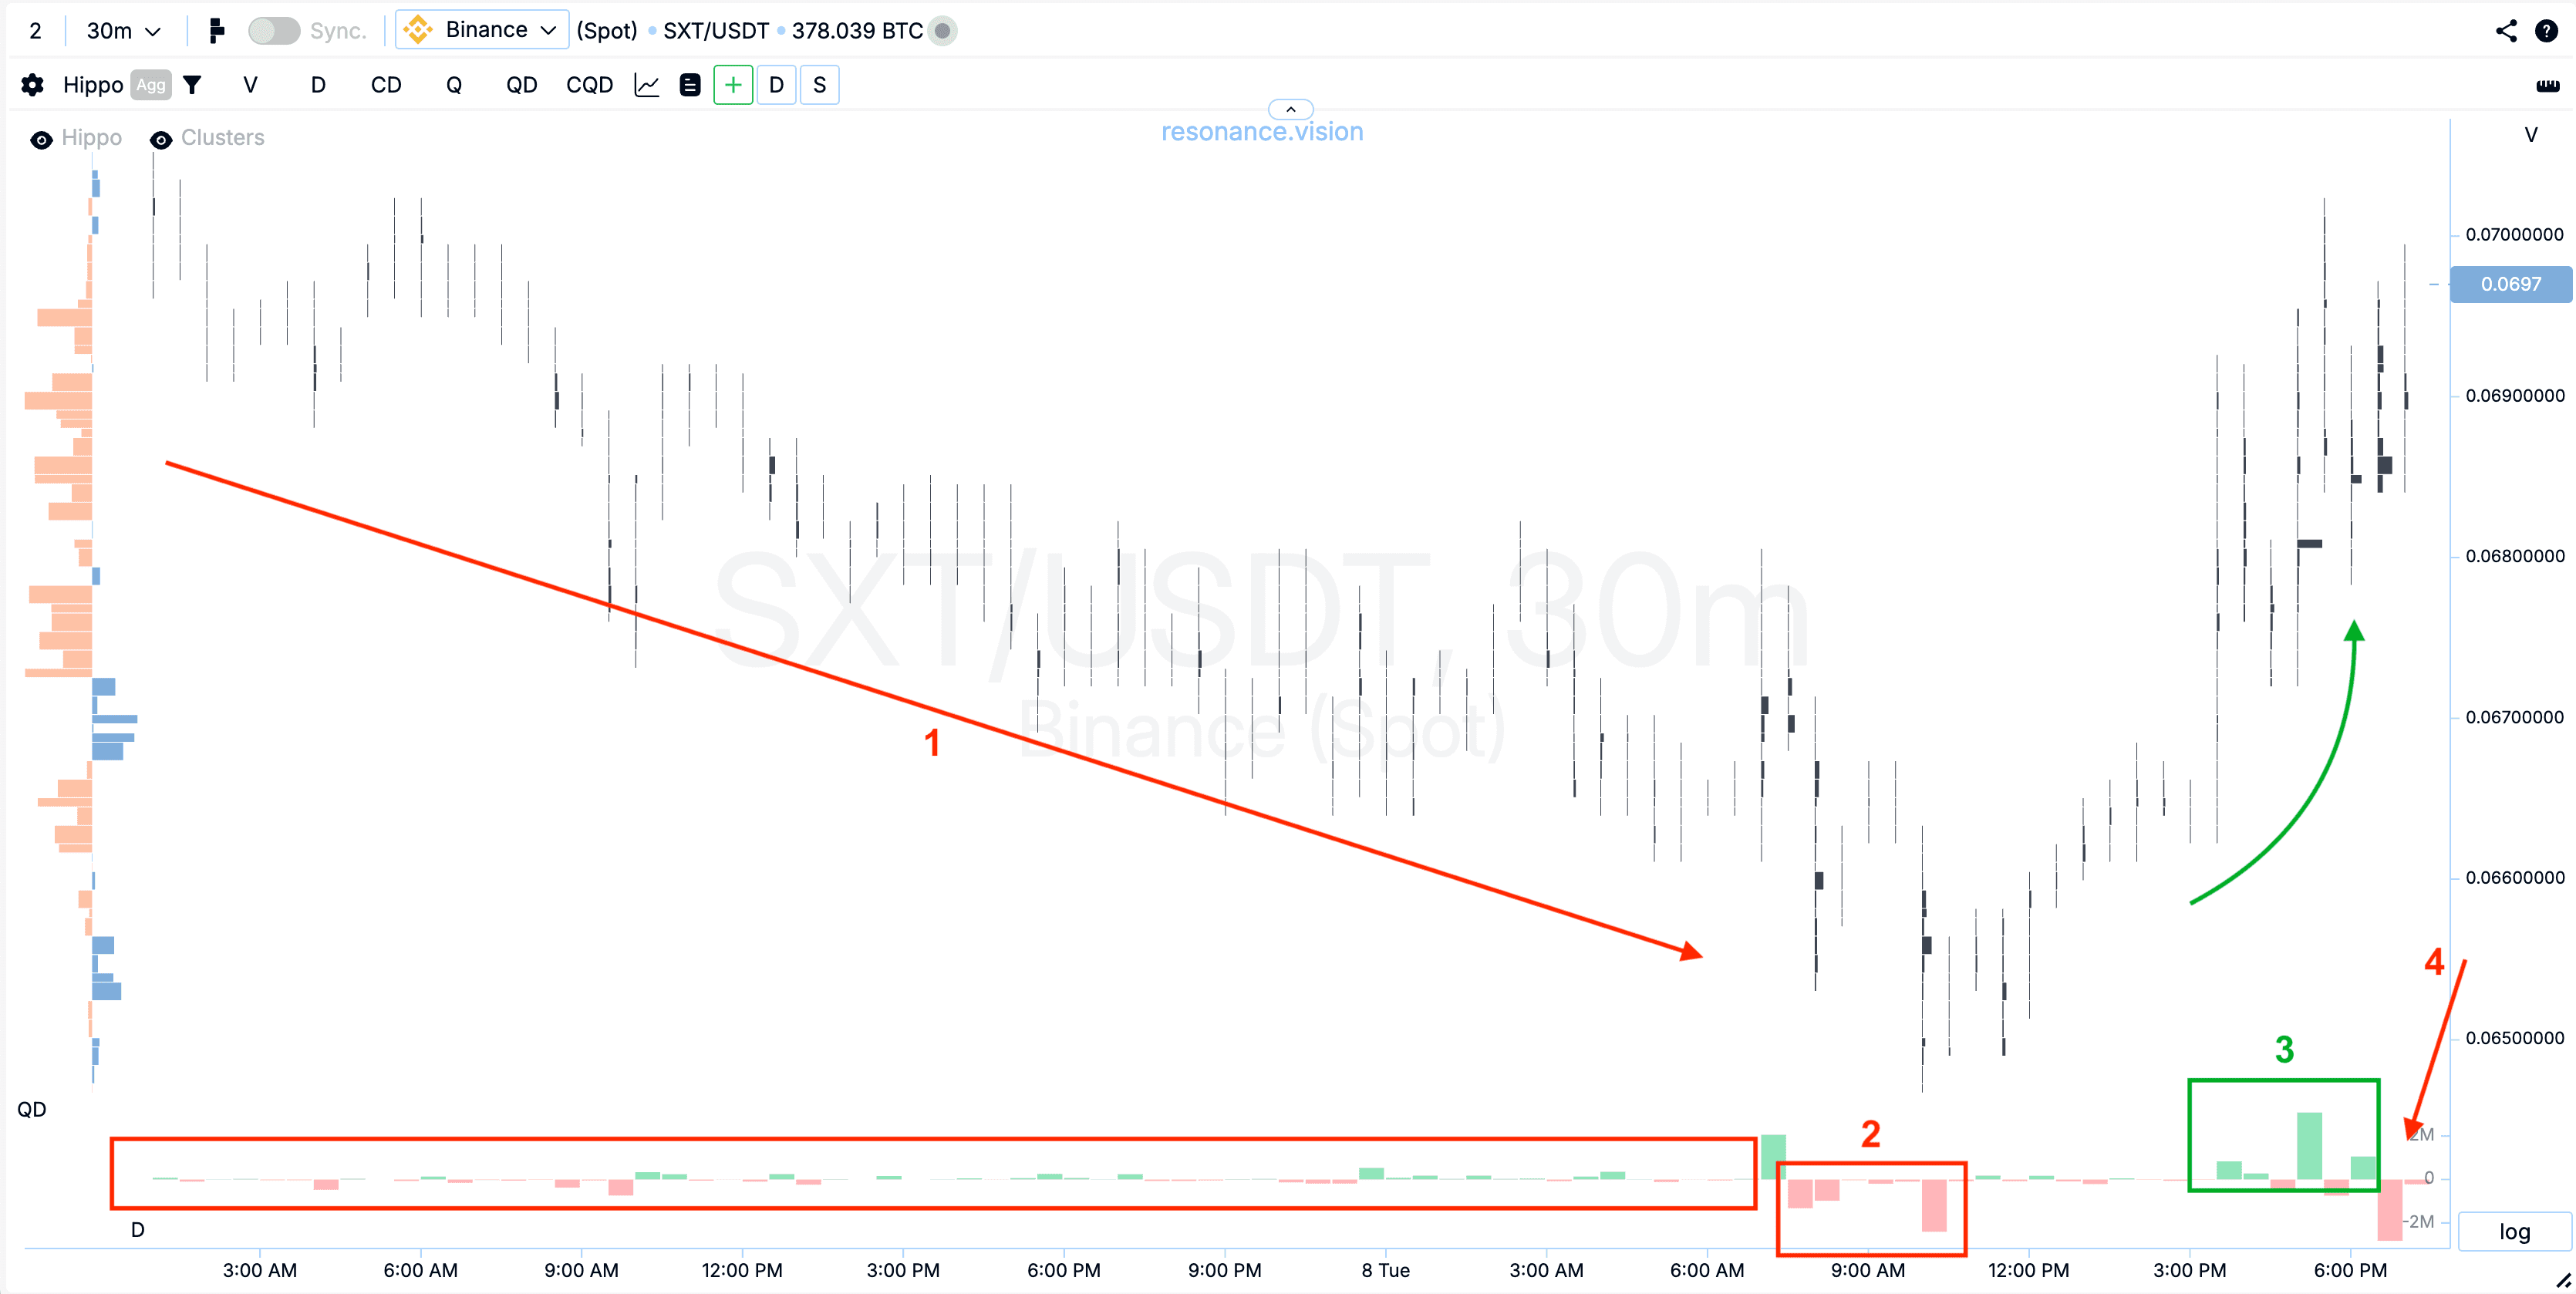
- The price fell on small sales volumes, buying did not yield results (1)
- Market sales ceased to lead to a significant update of the local minimum (2)
- Buying markets appeared, which had a positive effect on the price - it rose (3), so buyers actively joined the process
- New sales (quite large) did not lead to a price decrease (4) - this confirms the deficit and is an argument for keeping the deal or even adding to the volume.
As we know, deficit leads to price growth — the price rose 16%.
In general, with or without adding to the position, it was already possible to make a good profit on this deal.
But was it okay to keep the deal going?
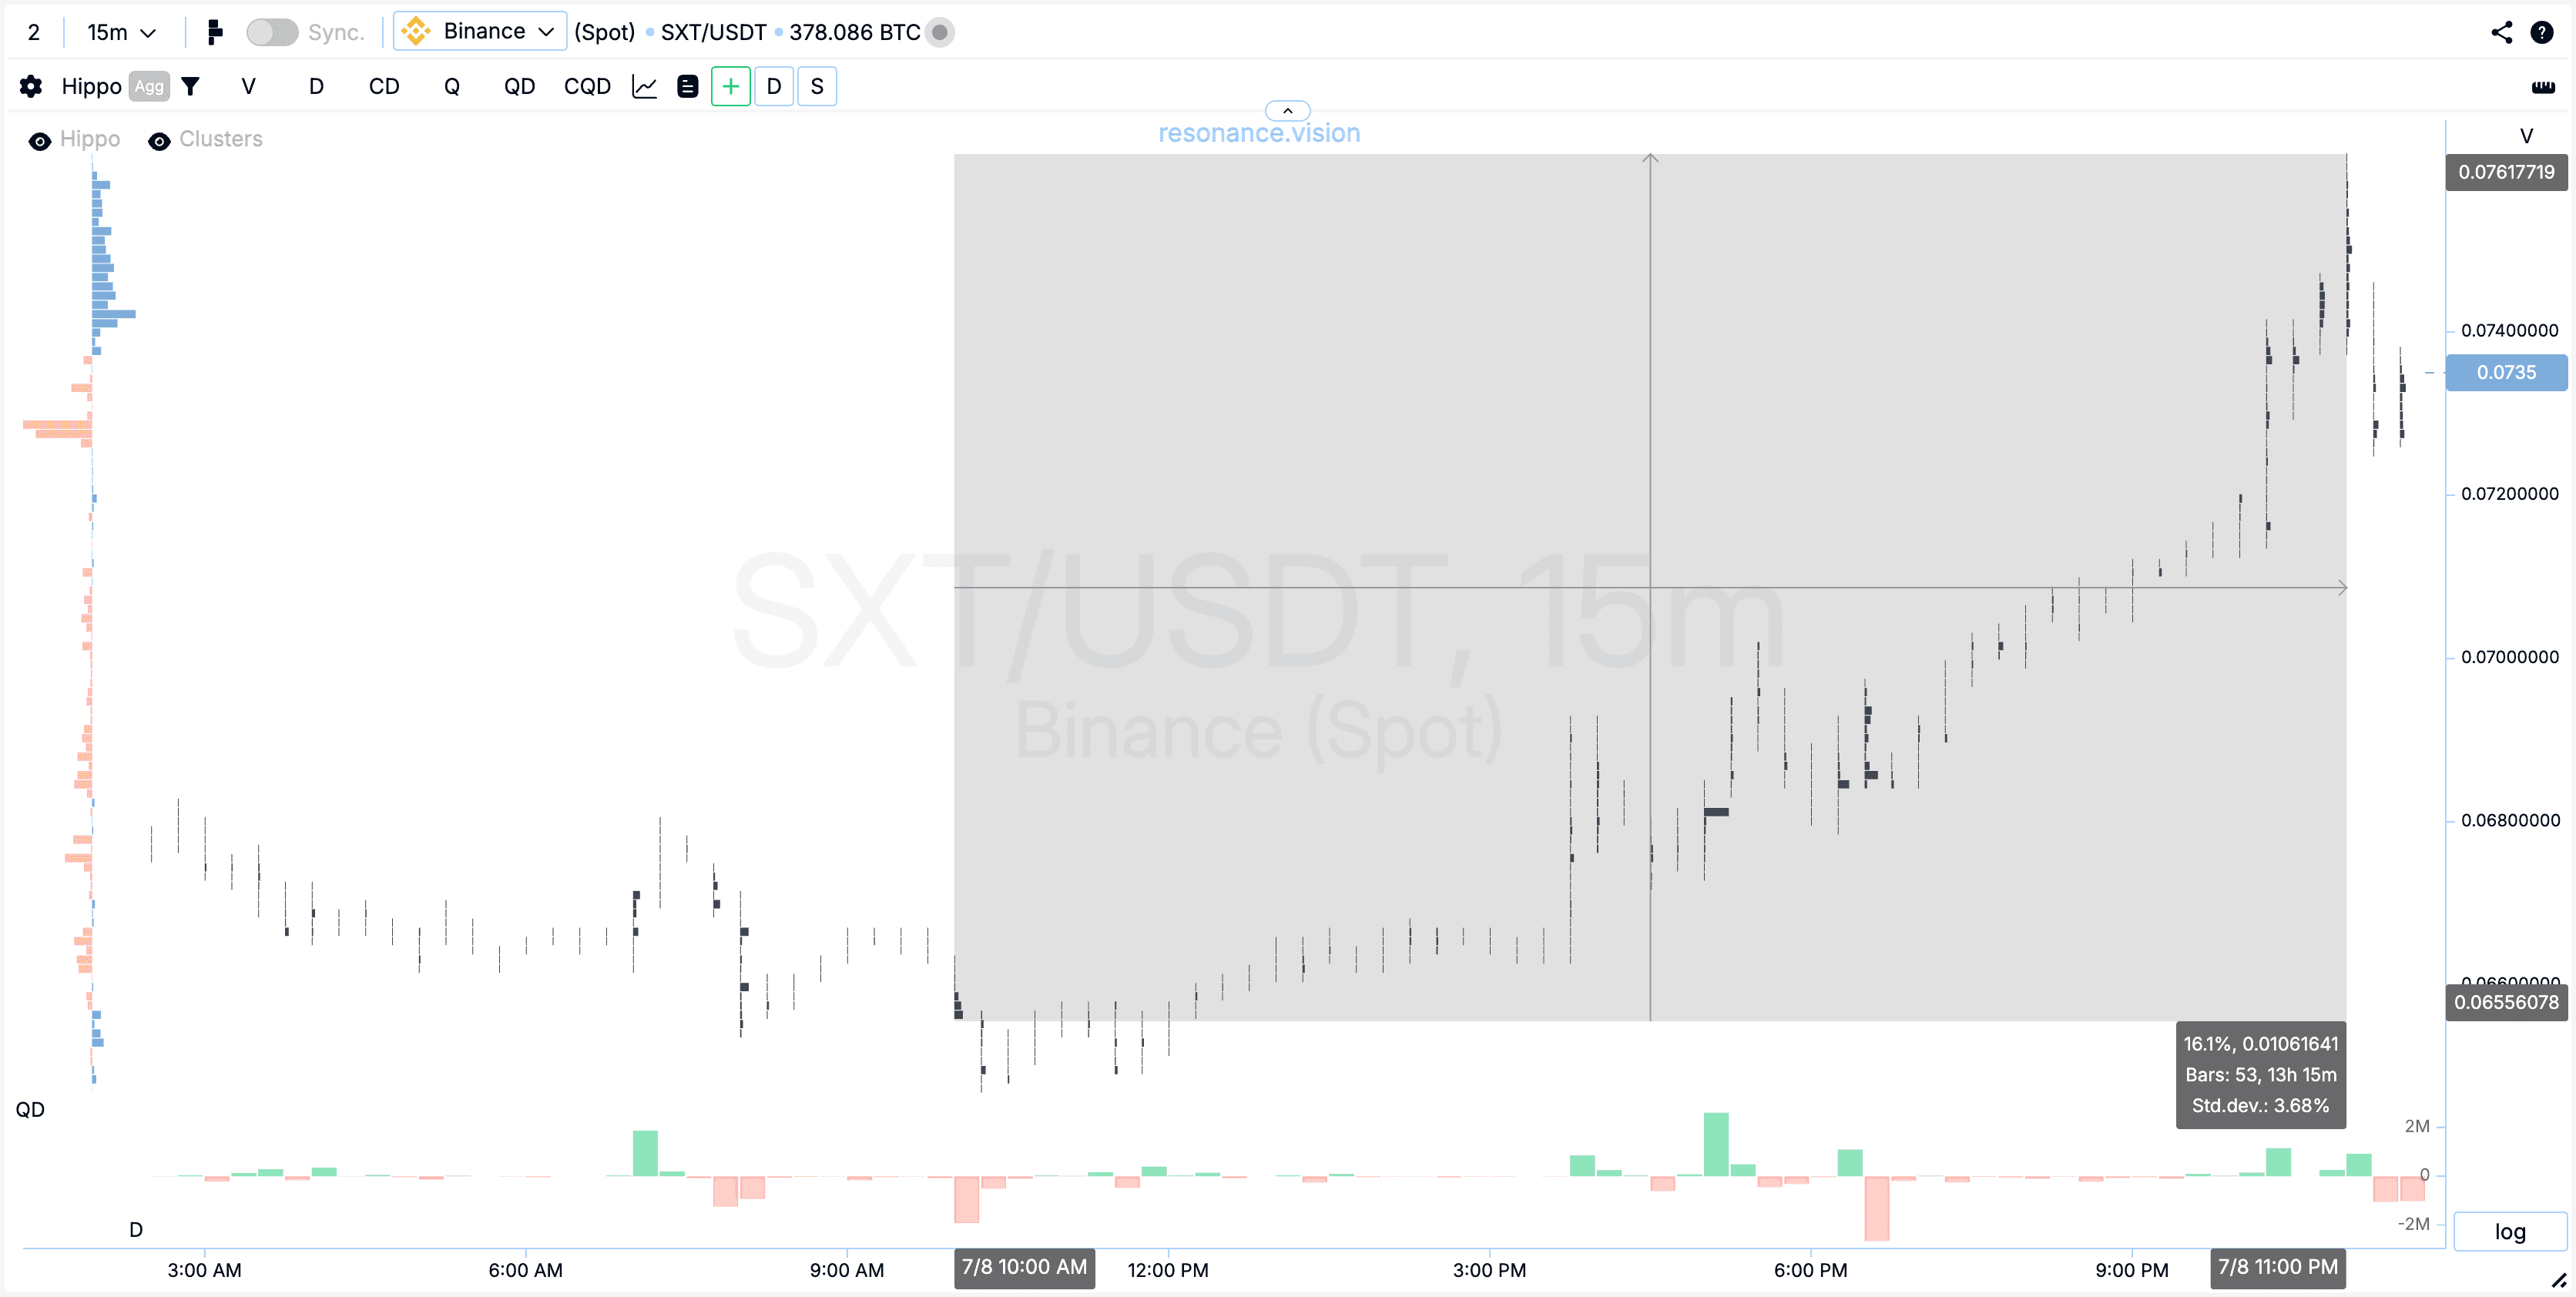
After some consolidation and a search for balance, signs of a deficit reappeared — significant sales did not lead to a significant price decline.
And again, buyers entered the game and continued to successfully push the price up with market orders. This can be seen in the green delta (1). After that, buyers continued to accept sales at limits, preventing the price from falling (2). Then there was another try by buyers to push the price higher, BUT they couldn’t really update the maximum. And that’s a warning sign and a sign of a surplus (3).
We could finally confirm the weakness of buyers by the significant volume of market buying, which failed to push the price up and renew the maximum.
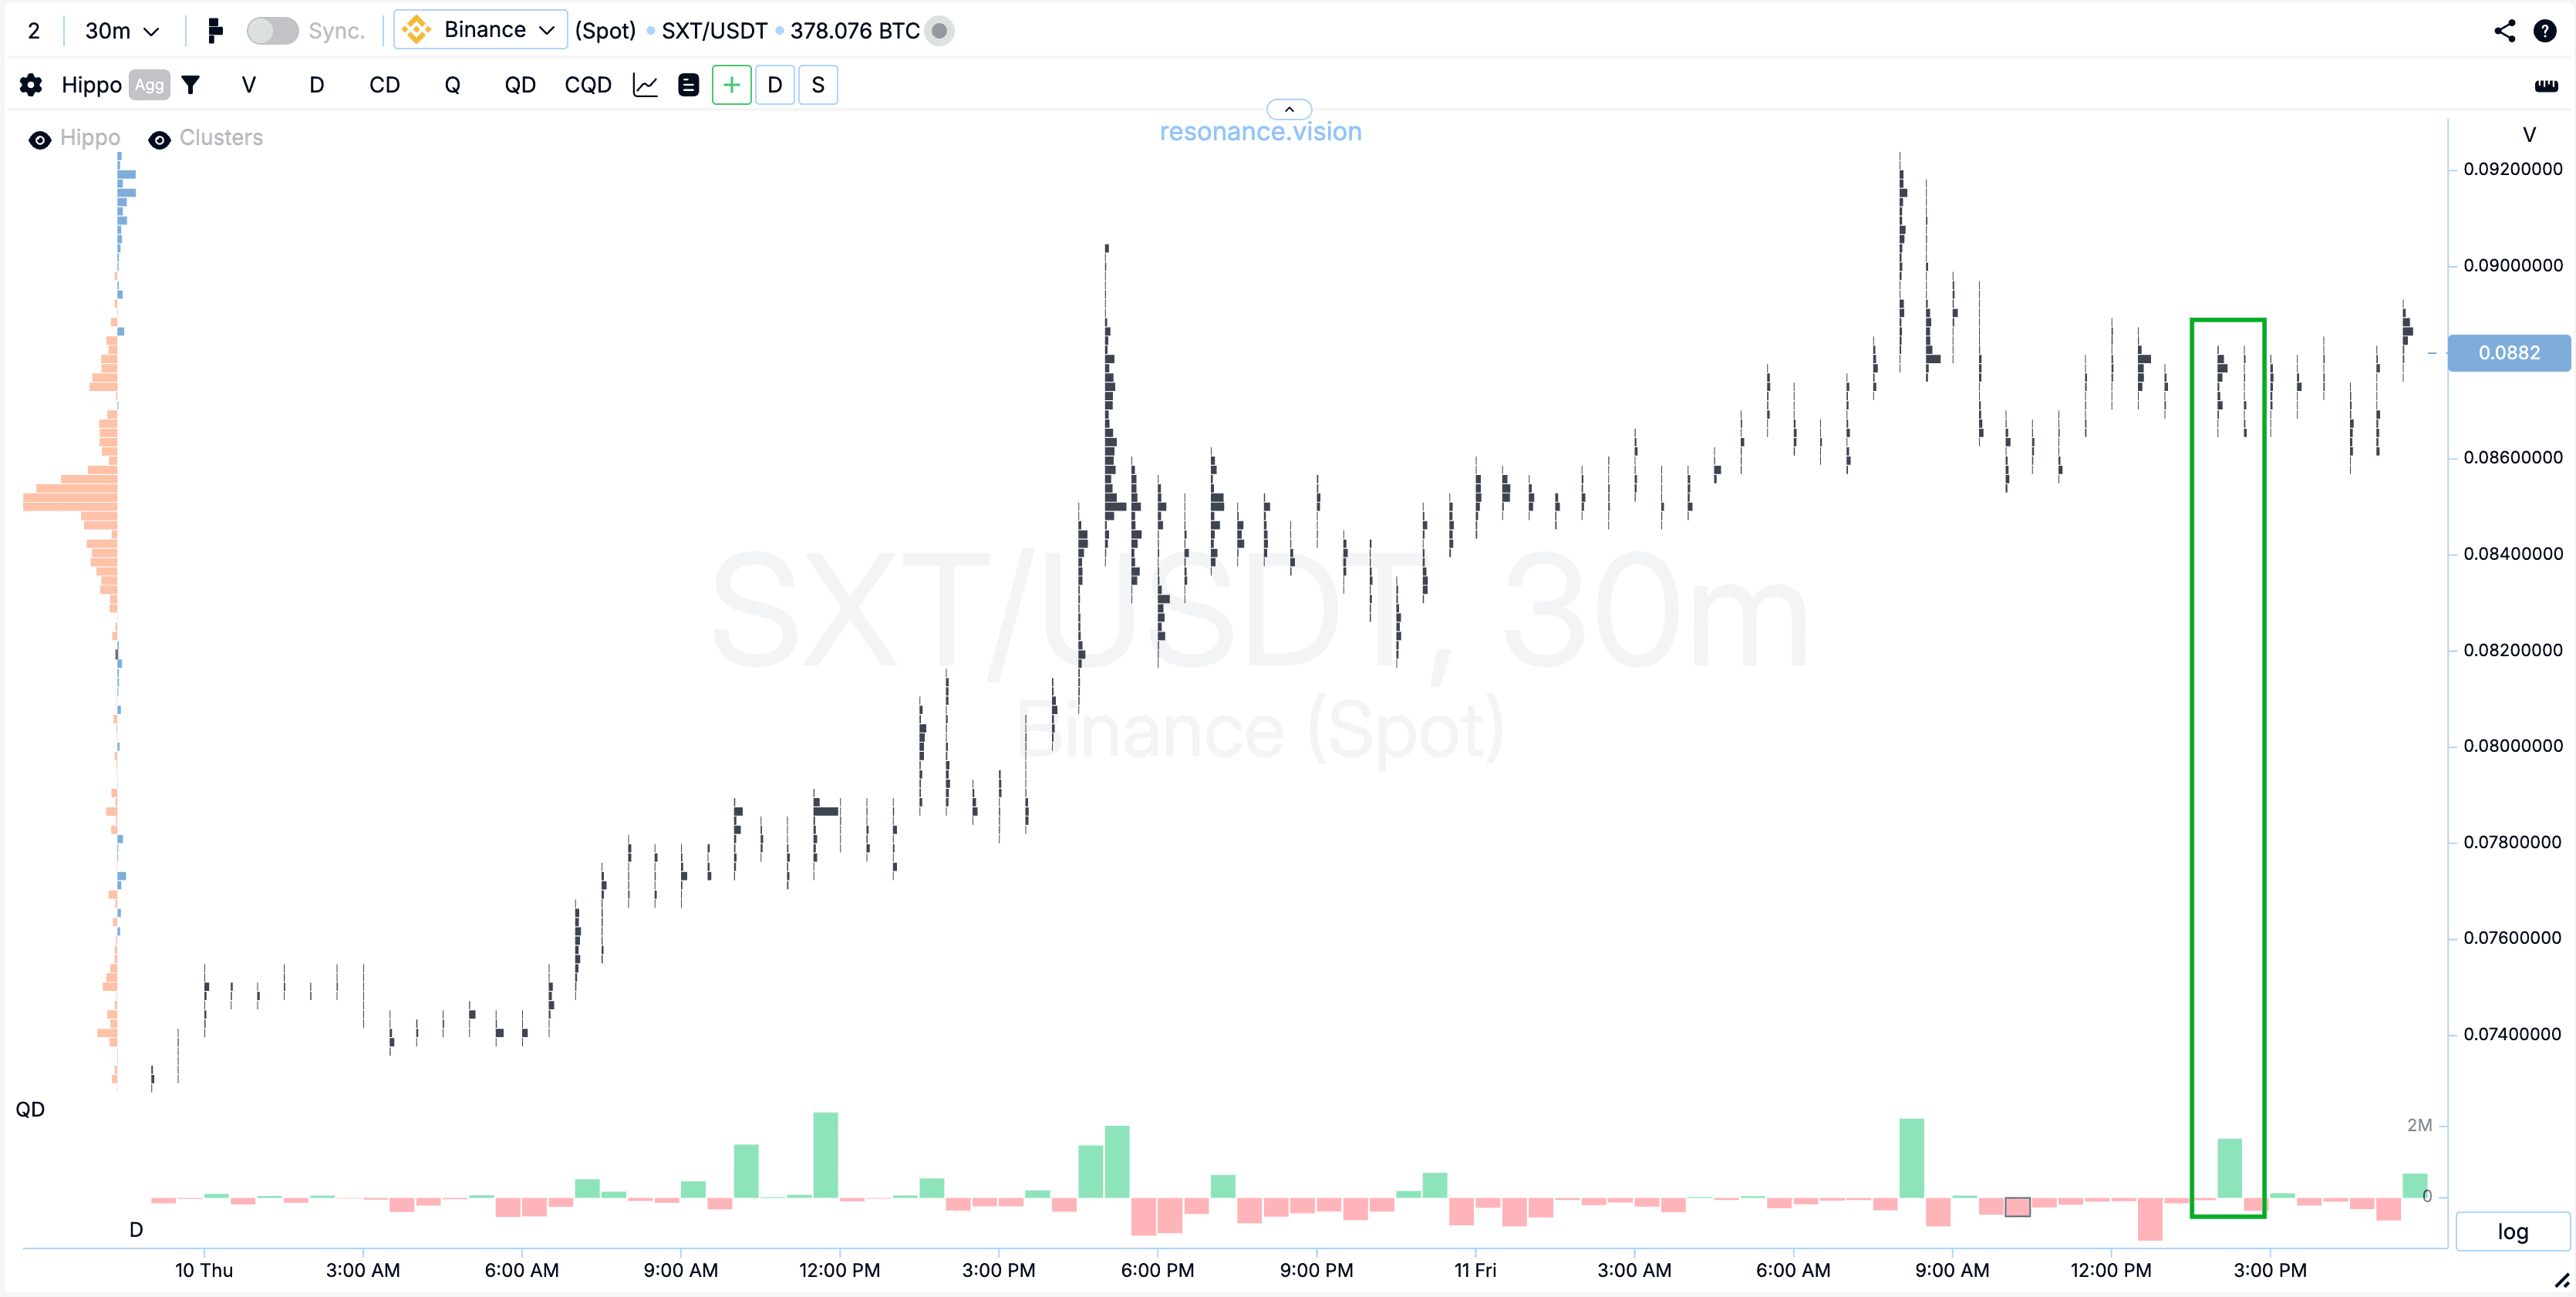
This is the culmination of buying and the time to close the long position. The coin’s growth was 36% overall.
Exit should occur when surplus appears or sell activity effectively pushes the price down. At the same time, stop losses had to be raised regularly to protect profits.
Note: all analysis above is based solely on market mechanics — only supply and demand. This trading setup was found online using the Speed Print search algorithm.
To make your scalping strategy as effective as possible, take a mini-training course to learn what to look for before opening trades. It is especially useful for beginners and will serve as an ideal foundation for a trading system, as it covers price reversal patterns in detail.
For more information about the search algorithm, see the article ‘Speed Print — your tool for cryptocurrency scalping’.
Risk Management: How to Control Risk?
Making money in the market is not only about strategy, but also about risk control. Risk management is individual, but here are some core principles:
- Risk no more than 1–2% of your deposit per trade
- Move stop-losses up as the price goes in your favor to protect profits
- Add to positions only with clear signals and confirmation
- Don’t try to trade every coin — focus on quality opportunities
Risk control preserves capital and mental stability. If you struggle here, read “Strategy Matters, but Risk Matters More.”
Finding Trade Ideas: Where and How?
The key to success is finding the right ideas online quickly. Use the tools of the Resonance platform:
- Screener
- Search engines such as Speed Print, Hippo, BAS, FTT
- Aires Reversal signals
These tools help you save time and find high-potential entry points with abnormal activity.
Create session lists: separate ones for scalping, grid bots, etc. to monitor selected assets efficiently.
Not every coin suits scalping. You may also find great swing ideas — see “How to Build Your Own Trading Strategy.”
Frequently asked questions (FAQ)
Is it possible to make money on every market movement?
No, it is impossible to constantly make money on every movement of a single coin. It is important to look for assets where there is a deficit or surplus, and the price has the potential for significant movement.
**What is the best timeframe for scalping? **
Small timeframes are used for scalping — from m1 to m30. But it never gets old to check the coin’s situation on higher timeframes.
Does analysis work on tick charts?
Tick charts are not very effective for most traders. It is better to focus on cluster charts, as they provide complete information about volumes.
Should you trust large limit orders?
Limit orders are just one source of information that only shows the intentions of market participants. They can be cancelled or changed. It is better to focus on executed trades, analysing their dynamics and effectiveness.
Can scalping be automated?
Yes, scalping is often automated using algorithms and bots. They react faster to market changes than humans, but this requires special technical knowledge and appropriate software.
How to avoid spoofing?
Do not open trades based solely on large limits without confirmation of the volume of executed trades. Focus on traded volumes — cluster charts — to see the real market situation.
Conclusion
Cryptocurrency scalping is a dynamic trading method that requires high concentration, quick reactions, and an understanding of market mechanics. The best strategy should always be based on an analysis of supply and demand.
The key to success is choosing the right analytical tools, understanding market conditions, and strict risk management.
Remember that trading is not about quick profits, but about a systematic approach, learning, and constant market analysis.”Which Charts and Indicators to Use in Crypto Trading”
Use online search engines and the analytical tools of the Resonance platform to quickly select assets, create your own session lists, and don’t be afraid to experiment with different strategies.
May your trading be successful and profitable!
Follow new insights in our telegram channel.
No need to invent complex schemes and look for the "grail". Use the Resonance platform tools.
Register via the link — get a bonus and start earning:
OKX | BingX | KuCoin.
Promo code TOPBLOG gives you a 10% discount on any Resonance tariff plan.
For anyone serious about fast and precise market work, crypto scalping becomes a disciplined process, not a game. A strong scalping strategy relies on real volume behavior, not hope or randomness, and this is what separates profitable traders from emotional ones. Whether you prefer classic setups or intraday scalping on volatile pairs, the logic is the same: study supply and demand, react to confirmed signals, and use only the most reliable indicators for scalping to filter noise instead of chasing it.
If you approach intraday crypto trading with structure, risk control and proven tools — every session becomes clearer, safer and more profitable. And these practical tips help you stay focused on quality opportunities. Read the article "10 tips on how to protect your deposit".
Recommended articles


